. 2021 Oct 19;12(1):6078.
doi: 10.1038/s41467-021-26360-2.

PHF3 regulates neuronal gene expression through the Pol II CTD reader domain SPOC

Affiliations

PHF3 regulates neuronal gene expression through the Pol II CTD reader domain SPOC

Lisa-Marie Appel et al. Nat Commun. .

Abstract

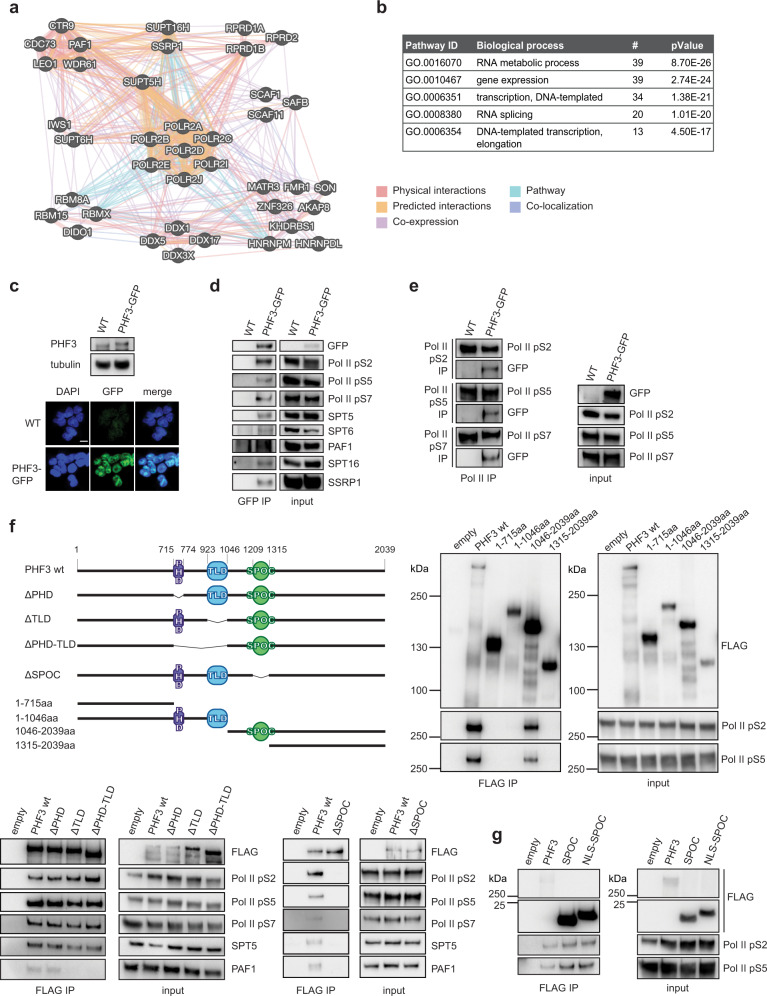
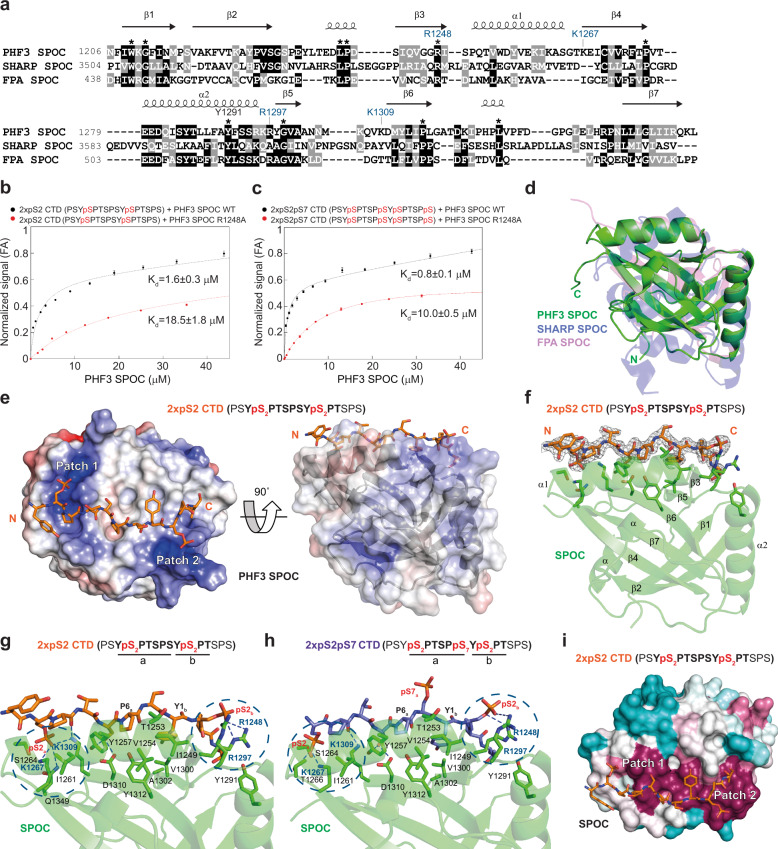
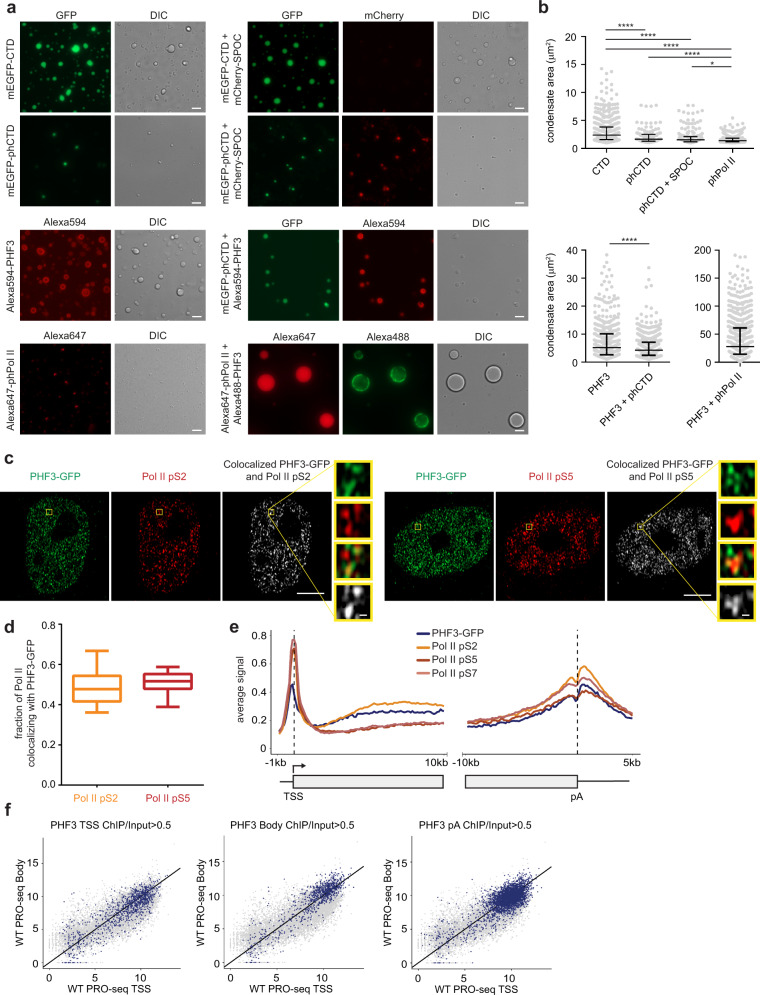
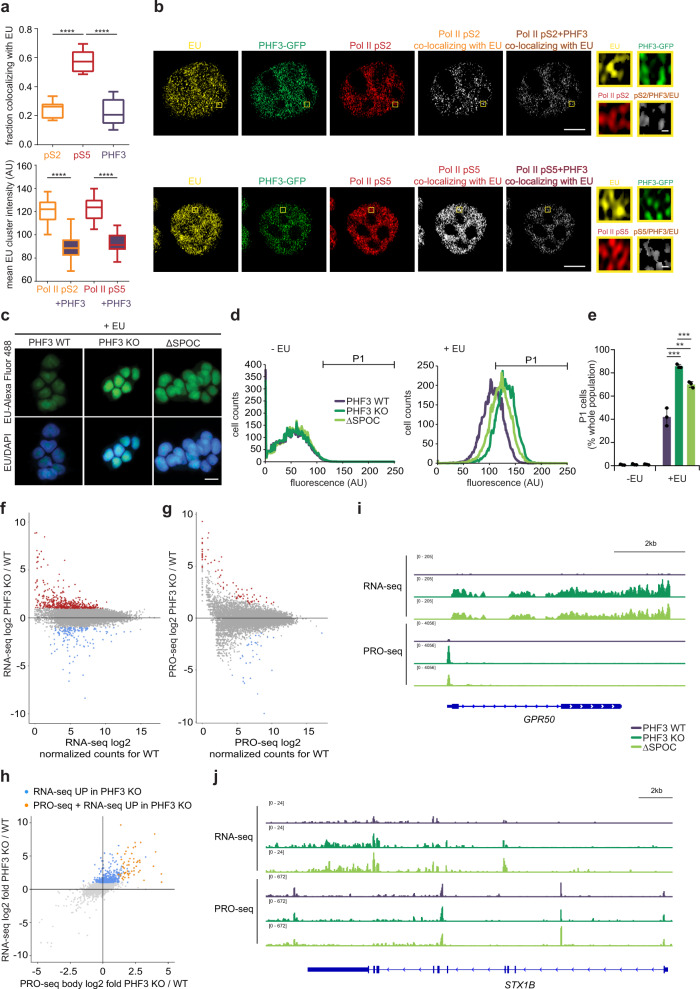
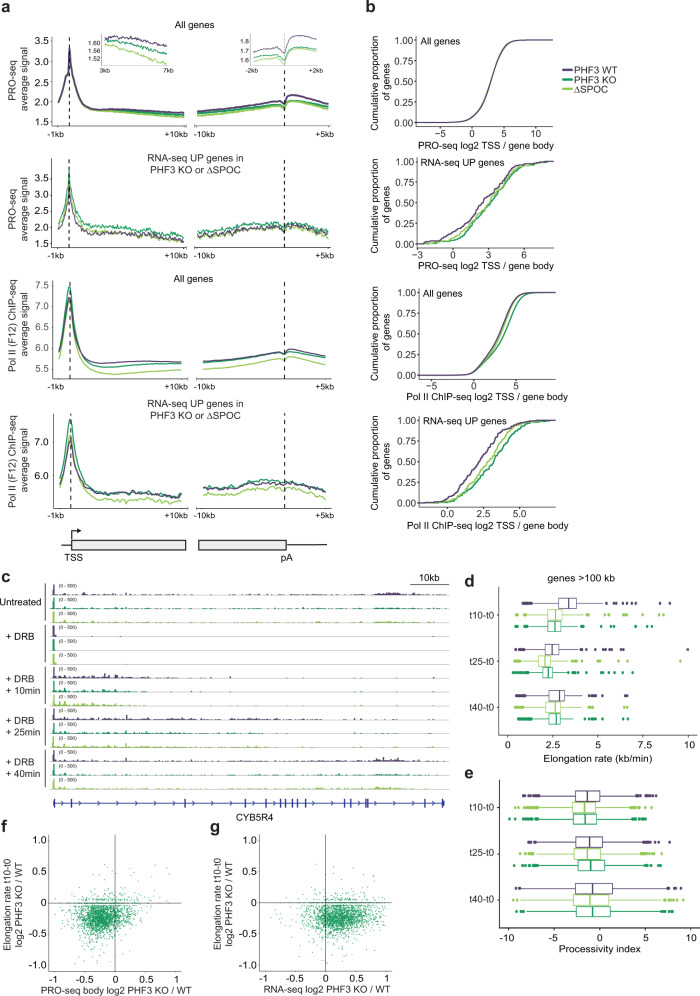
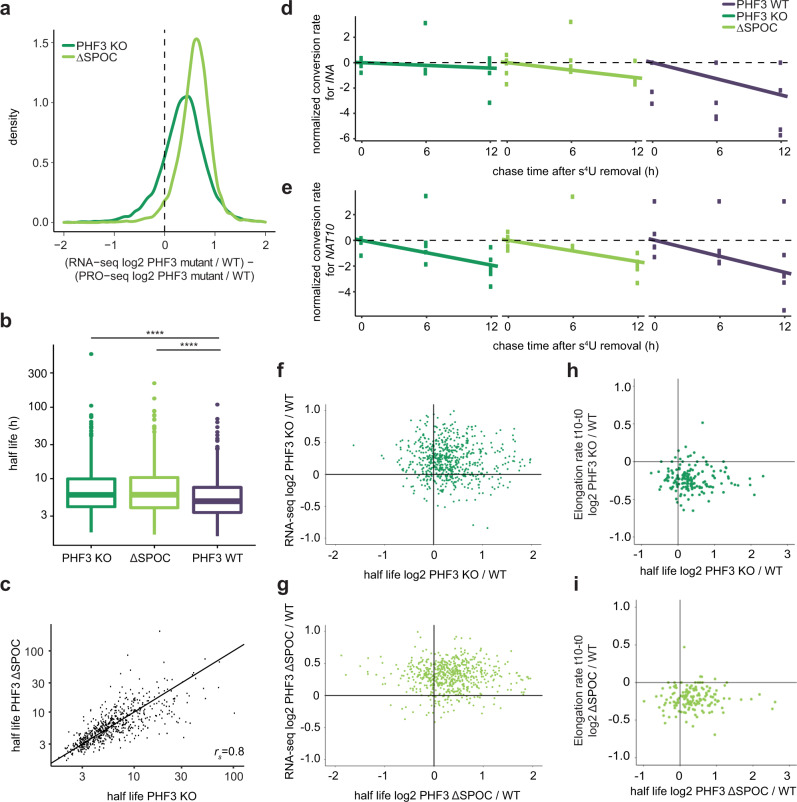
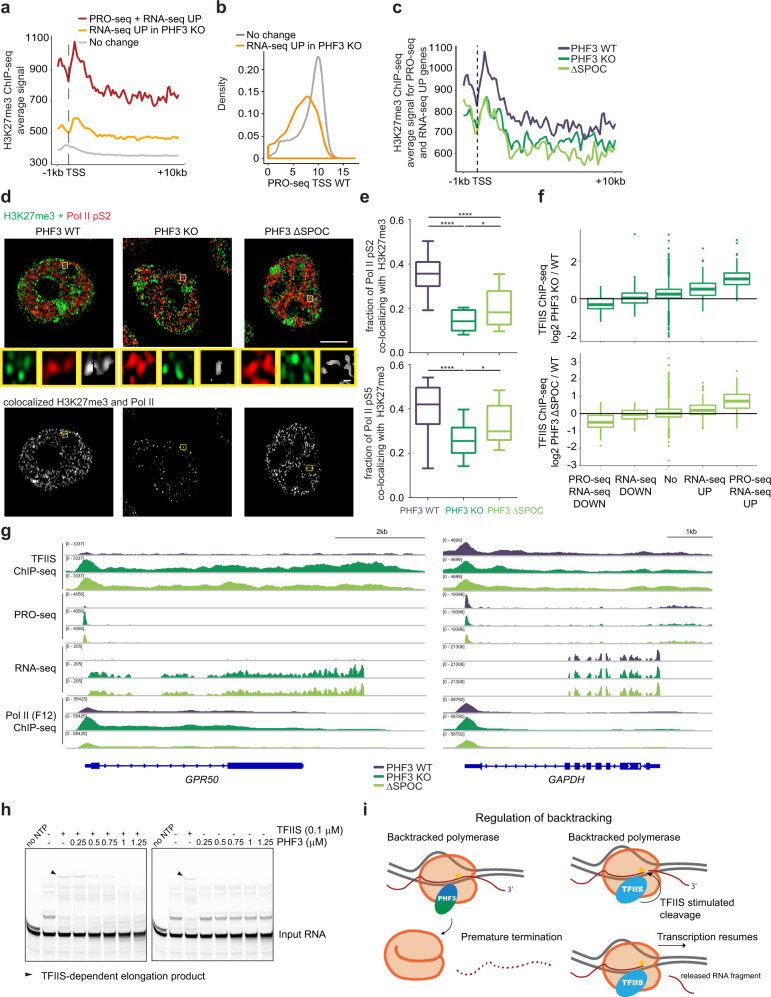
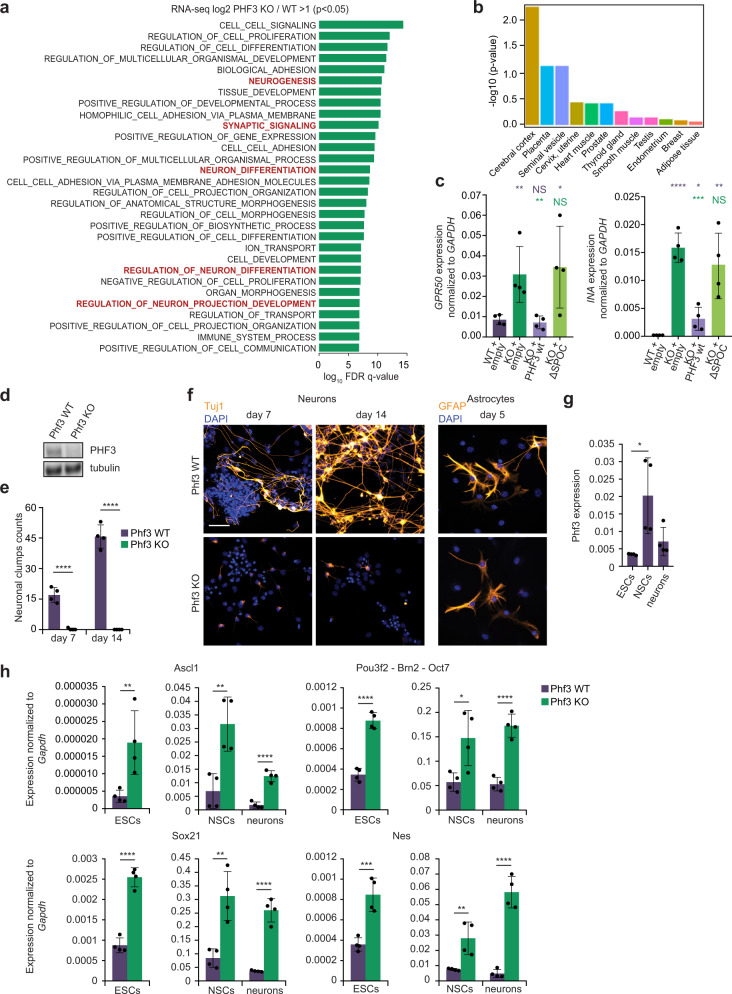
The C-terminal domain (CTD) of the largest subunit of RNA polymerase II (Pol II) is a regulatory hub for transcription and RNA processing. Here, we identify PHD-finger protein 3 (PHF3) as a regulator of transcription and mRNA stability that docks onto Pol II CTD through its SPOC domain. We characterize SPOC as a CTD reader domain that preferentially binds two phosphorylated Serine-2 marks in adjacent CTD repeats. PHF3 drives liquid-liquid phase separation of phosphorylated Pol II, colocalizes with Pol II clusters and tracks with Pol II across the length of genes. PHF3 knock-out or SPOC deletion in human cells results in increased Pol II stalling, reduced elongation rate and an increase in mRNA stability, with marked derepression of neuronal genes. Key neuronal genes are aberrantly expressed in Phf3 knock-out mouse embryonic stem cells, resulting in impaired neuronal differentiation. Our data suggest that PHF3 acts as a prominent effector of neuronal gene regulation by bridging transcription with mRNA decay.


Conflict of interest statement

The authors declare no competing interests.

Figures

Fig. 1
Fig. 1. PHF3 interacts with RNA polymerase II via the SPOC domain.
a GeneMANIA interaction map of the PHF3 interactome. b Gene ontology biological processes of the PHF3 interactome revealed by mass spectrometry. c Expression levels and nuclear localization of PHF3-GFP in the endogenously tagged HEK293T cell line revealed by Western blotting with anti-PHF3 and fluorescence microscopy. Scale bar = 10 μm. The experiment was performed once. d PHF3-GFP was immunoprecipitated using anti-GFP. Pol II phosphoisoforms, as well as transcription regulators SPT5, SPT6, PAF1, and FACT complex (SPT16 and SSRP1) were detected in the eluates. The experiment was performed once. e Endogenous Pol II phosphoisoforms were immunoprecipitated from PHF3-GFP cells and PHF3-GFP was detected in the eluates. The experiment was performed once. f Anti-FLAG immunoprecipitation of FLAG-PHF3 deletion mutants. Pol II does not co-immunoprecipitate in the absence of the PHF3 SPOC domain. The experiment was performed four times. Representative blots are shown. g Anti-FLAG immunoprecipitation of the FLAG-SPOC domain shows interaction with Pol II. The experiment was performed once.
Fig. 2
Fig. 2. PHF3 SPOC binds pS2 CTD peptides in vitro.
a Structure-based alignment of SPOC domains from PHF3 (6Q2V), SHARP (2RT5), and FPA (5KXF). Conserved residues are marked with an asterisk. b, c Fluorescence anisotropy (FA) measurement of the binding of b, 2xpS2 and c, 2xpS2pS7 FAM-labeled CTD peptides to PHF3 SPOC WT or R1248A mutant. Normalized fluorescence anisotropy is plotted as a function of protein concentration (n = 3). The data were normalized for visualization purposes and the experimental isotherms were fitted to one site saturation with non-specific binding model. d Overlay of SPOC structures from PHF3 (6Q2V), SHARP (2RT5) and FPA (5KXF) showed an average RMSD of 2.75 Å over 149 aligned Cα atoms between PHF3 and SHARP SPOC, and average RMSD of 1.94 Å over 123 aligned Cα atoms between PHF3 and FPA SPOC. e 2xpS2 CTD peptide binds two positively charged patches (Patch 1 and 2) on the surface of PHF3 SPOC. The color coded electrostatic surface potential of SPOC was drawn using the Adaptive Poisson-Boltzmann Solver package within PyMol. The electrostatic potential ranges from −5 (red) to +5 (blue) kT/e. The N- and C-termini of the peptide are indicated and always shown in the same orientation. f 2 FoFc electron density map of pS2 peptide contoured at the 1.5σ level. CTD peptide sequences used for X-ray structures correspond to those used in binding assays. The residues of the CTD diheptapeptide that are visible in the structure are indicated in bold. CTD peptides used for X-ray structures had the same sequence as for the binding assays but were not fluorescently labeled. g, h Hydrogen bonding interactions between g, 2xpS2 and h, 2xpS2pS7 CTD peptides and PHF3 SPOC. SPOC monomer binds two phosphorylated S2 groups on the CTD peptides. SPOC residue labels from two positively charged patches are colored blue and the patches are contoured with dashed circles. i Evolutionary conservation of PHF3 SPOC residues projected onto the 2xpS2 co-structure using the ConSurf server. Residues are colored by their conservation grades with maroon showing the highest and turquoise the lowest degree of conservation. Two positively charged patches (Patch 1 and 2) are indicated.
Fig. 3
Fig. 3. PHF3 drives liquid-liquid phase separation of phosphorylated Pol II, colocalizes in Pol II clusters in cells and associates with Pol II genome-wide.
a Representative images of in vitro LLPS assays with 5 µM unphosphorylated or phosphorylated mEGFP-CTD, 5 µM mCherry-SPOC, 3 µM Alexa594-PHF3, 3 µM phosphorylated Alexa488-Pol II, 1.5 µM phosphorylated Alexa647-Pol II + 1.5 µM Alexa488-PHF3. Scale bar = 5 µm. The experiments were repeated three times and the representative images are shown. b Quantification of condensate area (µm2). N = 556 (CTD); 64 (phCTD); 89 (phCTD+SPOC); 582 (phPol II); 480 (PHF3); 580 (PHF3+phCTD); 588 (PHF3+phPol II). Data are presented as median with interquartile range. Mann-Whitney test was used to determine p-values (Supplementary Data 7). c Representative Airyscan high resolution images of PHF3-GFP (IF staining with rabbit anti-GFP + Alexa Fluor 488, green) and Pol II pS2 or pS5 (Alexa Fluor 594, red). Co-localization analysis of clusters that overlap in both channels (white). Scale bar = 5 µm or 200 nm for zoomed regions. d Quantification of the fraction of Pol II pS2 (N = 28) and Pol II pS5 (N = 23) co-localizing with PHF3. Box and whiskers plot with error bars representing 10 and 90 percentiles are shown. Each experiment was repeated three times with comparable results. Statistics are indicated in detail in Supplementary Data 7. e ChIP-seq analysis shows that PHF3 travels with Pol II across the length of genes. Relative enrichment of PHF3, Pol II pS2, pS5, and pS7 on TSS-gene body region (TSS viewpoint; left panel) and gene body-pA region (pA viewpoint; right panel) for genes that showed Pol II occupancy with the F-12 antibody (minimal gene body RPKM of 5 in F-12 ChIP-seq). f Scatter plots showing PRO-seq nascent transcription levels at gene body relative to TSS in WT cells. Blue dots indicate PHF3-bound genes at transcription start sites (TSS, left), gene body (Body, middle) or polyadenylation sites (pA, right).
Fig. 4
Fig. 4. PHF3 negatively regulates mRNA levels.
a High-resolution Airyscan imaging reveals a high degree of co-localization between Pol II pS5 and 5-EU whereas only a small fraction of Pol II pS2 or PHF3-GFP co-localizes with 5-EU (N = 21 for pS5; N = 15 for pS2; N = 23 for PHF3). The mean EU intensity is decreased in clusters where PHF3 and Pol II overlap compared to clusters containing only Pol II. Box and whiskers plots with error bars representing the 10 and 90 percentiles are shown. One-way ANOVA with Tukey’s multiple comparison test was performed to determine p-values (<0.0001). Each experiment was repeated twice with comparable results. Statistics are indicated in detail in Supplementary Data 7. b Representative Airyscan high resolution images of 5-EU (yellow), PHF3-GFP (green) and Pol II pS2 or pS5 (red) and clusters of Pol II that co-localize with EU or with both EU and PHF3 (white). Scale bar = 5 µm or 200 nm for zoomed regions. ce PHF3 KO and ΔSPOC show increased incorporation of EU-Alexa Fluor 488 by c, fluorescence microscopy (scale bar = 10 µm) and d, e FACS analysis. d Cell counts for each fluorescence intensity in the absence (-EU) or presence of EU (+EU). e Percentage of cells belonging to the gated P1 fluorescent population shown in d. The following cell numbers were examined over three independent experiments: N = 29059 (WT –EU), N = 29918 (KO –EU), N = 29847 (ΔSPOC –EU), N = 29146 (WT +EU), N = 29649 (KO +EU), N = 29771 (ΔSPOC +EU). Data are presented as mean values ± standard deviation. One-tailed, two-sample equal variance t-test was used to determine p-values (Supplementary Data 7). f RNA-seq analysis shows upregulation of 620 genes (red dots, fold-change>2, p < 0.05) and downregulation of 173 genes (blue dots, fold-change>2, p < 0.05) in PHF3 KO compared to WT. Drosophila S2 cells were used for spike-in normalization. g PRO-seq analysis shows upregulation of 68 genes (red dots, fold-change>2, p < 0.05) and downregulation of 39 genes (blue dots, fold-change>2, p < 0.05) in PHF3 KO compared to WT. Drosophila S2 nuclei were used for spike-in normalization. Mean Pearson correlation coefficient between the samples was 0.96 (see Supplementary Fig. S10c). h Relationship between RNA-seq and PRO-seq fold change for PHF3 KO vs WT. Genes that are upregulated in PHF3 KO in RNA-seq but not PRO-seq are indicated in blue. Genes that are upregulated in both RNA-seq and PRO-seq are indicated in orange. i Integrative Genomics Viewer (IGV) snapshots showing RNA-seq and PRO-seq reads for GPR50 as a typical gene with increased RNA-seq and PRO-seq in PHF3 KO and ΔSPOC cells. j IGV snapshots showing RNA-seq and PRO-seq reads for STX1B as a typical gene with increased RNA-seq but no change in PRO-seq in PHF3 KO and ΔSPOC cells. RNA-seq was performed after Ribo-Zero treatment of total RNA.
Fig. 5
Fig. 5. PHF3 loss results in increased Pol II stalling and reduced elongation rate.
a Composite analysis of PRO-seq and Pol II (F-12) ChIP-seq distribution and signal strength in PHF3 WT, KO, and ΔSPOC on TSS-gene body region and gene body-pA region for all genes or RNA-seq upregulated genes (fold-change>2, p < 0.05). Mouse chromatin was used for spike-in normalization of ChIP-seq. b Stalling index analysis calculated as PRO-seq or Pol II ChIP-seq TSS/gene body signal for all genes or RNA-seq upregulated genes (fold-change>2, p < 0.05). c IGV snapshots showing PRO-seq reads for CYB5R4 for the elongation rate experiment. Pause release was blocked with the CDK9 inhibitor DRB for 3.5 h, followed by DRB washout to allow transcription for 10, 25, and 40 min. d Pol II elongation rate for genes >100 kb (N = 795) was calculated as the leading edge of waves of nascent transcription divided by the time after DRB washout. Data are presented as box and whiskers plots showing the median and the interquartile range. e Processivity index for genes >100 kb (N = 795) was calculated as log10 distal/proximal reads. Data are presented as box and whiskers plots showing the median and the interquartile range. f Relationship between PRO-seq body fold change and t10 elongation rate (10 min after DRB washout) fold change for PHF3 KO vs WT. g Relationship between RNA-seq fold change and t10 elongation rate (10 min after DRB washout) fold change for PHF3 KO vs WT.
Fig. 6
Fig. 6. PHF3 negatively regulates mRNA stability via the SPOC domain.
a Density distribution of the differences in log2 fold changes PHF3 KO/WT or PHF3 ΔSPOC/WT between RNA-seq and PRO-seq data. b Comparison of mRNA half-lives for 757 genes calculated from T-C conversion rates as determined by SLAM-seq in PHF3 WT, KO, and ΔSPOC cells (n = 6). Median Spearman correlation coefficient of conversion rates for replicate samples belonging to the same group (same genotype and timepoint) was 0.75 (see Supplementary Fig. 12c). The difference between the distributions is statistically significant based on the one-sided Wilcoxon test [P(KO – WT) = 1.34 × 10−11, P(ΔSPOC – WT) = 2.28 × 10−11]. Statistics are indicated in detail in Supplementary Data 7. c, Scatter plot showing correlation between half-lives in PHF3 ΔSPOC and PHF3 KO. Spearman’s correlation coefficient is indicated. d, e Conversion rates determined from targeted SLAM-seq analysis of d, INA mRNA and e, NAT10 mRNA as a control labeled with s4U for 12 h followed by pulse chase for 6 h and 12 h. Robust linear models were fit on the linearized form of the exponential decay equation. Y-axis shows the log2 conversion rate, shifted by the median conversion rate at t = 0 h. For INA: t1/2 = 3.3 h (WT), 7.1 h (ΔSPOC), 19.5 h (PHF3 KO). For NAT10: t1/2 = 3.3 h (WT), 4.3 h (ΔSPOC), 5.0 h (PHF3 KO). f, g Relationship between RNA-seq fold change and half-life fold change for f, PHF3 KO vs WT or g, PHF3 ΔSPOC vs WT. The majority of differentially regulated genes cluster in the top right quadrant that corresponds to mRNAs with increased steady-state levels and half-lives. h, i Relationship between t10 elongation rate (10 min after DRB washout) fold change and half-life fold change for h, PHF3 KO vs WT or i, PHF3 ΔSPOC vs WT.
Fig. 7
Fig. 7. PHF3 negatively regulates a small subset of genes by competing with TFIIS.
a Composite analysis of H3K27me3 distribution and signal strength in PHF3 WT cells on TSS-gene body region for different gene categories based on RNA-seq and PRO-seq data. b Genes upregulated in PHF3 KO cells according to RNA-seq (fold change>2) have low expression levels in WT cells as judged by nascent transcription (PRO-seq) levels at TSS. c Composite analysis of H3K27me3 distribution and signal strength in PHF3 WT, KO, and ΔSPOC cells on TSS-gene body region for genes upregulated in RNA-seq and PRO-seq in PHF3 KO or ΔSPOC cells (fold change>2). d Representative Airyscan high resolution images of Pol II pS2 (Alexa Fluor 594, red) and H3K27me3 (Alexa Fluor 488, green) in PHF3 WT, KO, or ΔSPOC cells. Co-localization analysis of clusters that overlap in both channels (white). Scale bar = 5 µm. e Quantification of the fraction of Pol II pS2 and Pol II pS5 co-localizing with H3K27me3 (pS2: N = 20 for WT; N = 14 for KO; N = 15 for ΔSPOC. pS5: N = 18 for WT; N = 22 for KO; N = 15 for ΔSPOC.). Box and whiskers plots with error bars representing the 10 and 90 percentiles are shown. One-way ANOVA with Tukey’s multiple comparison test was performed to determine p-values (****<0.0001; * = 0.04). Each experiment was repeated twice with comparable results. Statistics are indicated in detail in Supplementary Data 7. f TFIIS ChIP-seq log2 fold change PHF3 KO/WT (top) or PHF3 ΔSPOC/WT (bottom) for TSS. Genes were grouped according to changes in RNA-seq and PRO-seq: downregulation in RNA-seq (fold change>2; N = 128), upregulation in RNA-seq (fold change>2; N = 395), downregulation in RNA-seq and PRO-seq (fold change>2; N = 25), upregulation in RNA-seq and PRO-seq (fold change>2; N = 45) or no change (N = 15868). Statistics are indicated in detail in Supplementary Data 7. Mouse chromatin was used for spike-in normalization of TFIIS ChIP-seq. g IGV snapshots showing TFIIS ChIP-seq, PRO-seq, RNA-seq, and Pol II ChIP-seq (F-12) reads for GPR50 (left) and GAPDH (right) as a housekeeping gene. RNA-seq was performed after Ribo-Zero treatment of total RNA. h In vitro assay monitoring Pol II elongation on an arrest sequence in the presence of TFIIS and increasing amounts of PHF3 (left) or in the presence of PHF3 alone (right). Pol II-EC was formed using an excess of a DNA–RNA bubble scaffold containing 5′-FAM-labeled RNA. The short elongation product seen in the ‘no NTP’ lane is due to residual ATP from the phosphorylation reaction. The experiments were repeated three times and the representative gels are shown. i A model of PHF3-mediated regulation of backtracking through competition with TFIIS. PHF3 represses transcription by competing with TFIIS and impeding Pol II rescue from backtracking, which may result in premature termination.
Fig. 8
Fig. 8. PHF3 regulates neuronal gene expression and neuronal differentiation of mouse embryonic stem cells (mESCs).
a GO analysis of genes upregulated in PHF3 KO HEK293T cells according to RNA-seq shows enrichment of genes involved in neurogenesis. GSEA Biological processes tool was used. b TissueEnrich analysis shows the enrichment of cerebral cortex among transcriptionally upregulated genes in PHF3 KO. TissueEnrich analyses the enrichment of a particular gene set in the tissue specific expression profiles provided by the GTEx transcriptional compendium (https://www.gtexportal.org/home/faq#citePortal). The y-axis shows the -log10 of Benjamini–Hochberg corrected p-value. c RT-qPCR analysis of INA and GPR50 mRNA levels in PHF3 WT and PHF3 KO HEK293T cells with stable integration of mCherry empty vector, and KO-complemented cell lines stably expressing mCherry-PHF3 wild-type or ΔSPOC. Four biologically independent experiments were performed. Data are presented as mean values ± standard deviation. The bars represent average expression from different clones as biological replicates. A t-test was performed by comparing expression levels with WT (violet asterisk) and KO (green asterisk). d CRISPR/Cas9 Phf3 knock-out in mESCs shows complete loss of protein by Western blotting. The experiment was performed once. e Quantification of beta III tubulin (TuJ1)-positive neuronal clump formation in Phf3 WT and KO cells after 7 or 14 days of neuronal differentiation. Neuronal clumps represent agglomerates of cells connected with Tuj1-positive cell projections. Four biologically independent experiments were performed. Data are presented as mean values ± standard deviation. f Representative immunofluorescence images of TuJ1-stained neurons and glial fibrillary acidic protein (GFAP)-stained astrocytes. Scale bar = 40 μm. The experiment was performed four times. g Phf3 expression levels in embryonic stem cells (ESCs), neural stem cells (NSCs) and neurons determined by RT-qPCR. Four biologically independent experiments were performed. Data are presented as mean values ± standard deviation. h Comparison of expression levels of different neuronal markers between Phf3 WT and KO ESCs, NSCs, and neurons by RT-qPCR. Four biologically independent experiments were performed. Data are presented as mean values ± standard deviation. One-tailed, two-sample equal variance t-test was used to determine p-values in c, e, g, h. P-values are indicated in Supplementary Data 7.

References

    1. Chen FX, Smith ER, Shilatifard A. Born to run: control of transcription elongation by RNA polymerase II. Nat. Rev. Mol. Cell Biol. 2018;19:464–478. doi: 10.1038/s41580-018-0010-5. - DOI - PubMed
    1. Kwak H, Lis JT. Control of transcriptional elongation. Annu. Rev. Genet. 2013;47:483–508. doi: 10.1146/annurev-genet-110711-155440. - DOI - PMC - PubMed
    1. Core L, Adelman K. Promoter-proximal pausing of RNA polymerase II: a nexus of gene regulation. Genes Dev. 2019;33:960–982. doi: 10.1101/gad.325142.119. - DOI - PMC - PubMed
    1. Lee TI, Young RA. Transcriptional regulation and its misregulation in disease. Cell. 2013;152:1237–1251. doi: 10.1016/j.cell.2013.02.014. - DOI - PMC - PubMed
    1. Chen FX, et al. PAF1, a molecular regulator of promoter-proximal pausing by RNA polymerase II. Cell. 2015;162:1003–1015. doi: 10.1016/j.cell.2015.07.042. - DOI - PMC - PubMed

Publication types

MeSH terms