

Passing rail traffic reduces bat activity
- PMID: 34667234
- PMCID: PMC8526610
- DOI: 10.1038/s41598-021-00101-3
Passing rail traffic reduces bat activity
Abstract
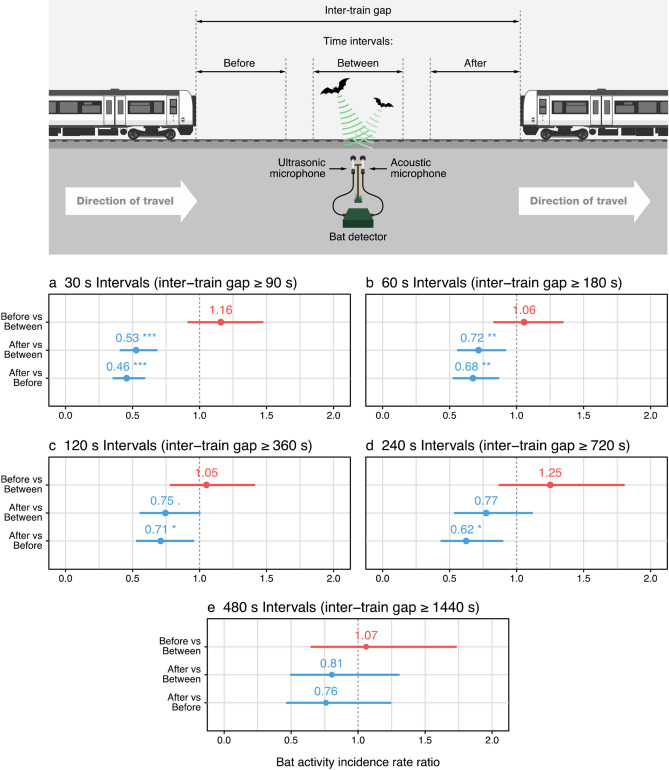
Rail transport is expanding, with a global increase in infrastructure of up to one-third predicted by 2050. Greater reliance on rail is expected to benefit the environment at a planetary level, by mitigating transport-related carbon emissions. However, smaller-scale, more direct consequences for wildlife are unclear, as unlike roads, railway impacts on animal ecology are rarely studied. As a group, bats frequently interact with transport networks due to their broad distribution and landscape-scale movements. Additionally, their nocturnality, and use of echolocation mean bats are likely to be affected by light and noise emitted by trains. To investigate whether passing trains affect bat activity levels, we monitored the two most abundant UK species using ultrasonic detectors at 12 wooded rail-side sites in southern England. Activity fell by ≥ 30-50% each time a train passed, for at least two minutes. Consequently, activity was reduced for no less than one-fifth of the time at sites with median rail traffic, and two-thirds or more of the time at the busiest site. Such activity changes imply repeated evasive action and/or exclusion from otherwise favourable environments, with potential for corresponding opportunity or energetic costs. Hence, disturbance by passing trains may disadvantage bats in most rail-side habitats.
© 2021. The Author(s).
Conflict of interest statement
The authors declare no competing interests.
Figures
References
-
- Dulac, J. Global land transport infrastructure requirements. (2013).
-
- Baker CJ, Chapman L, Quinn A, Dobney K. Climate change and the railway industry: A review. Proc. Inst. Mech. Eng. Part C J. Mech. Eng. Sci. 2010;224:519–528. doi: 10.1243/09544062JMES1558. - DOI
-
- IEA. The Future of Rail - Opportunities for energy and the environment. (2019). doi:10.1787/9789264312821-en
-
- Popp JN, Boyle SP. Railway ecology: Underrepresented in science? Basic Appl. Ecol. 2017;19:84–93. doi: 10.1016/j.baae.2016.11.006. - DOI
-
- IRF. IRF World Road Statistics 2019. (2019).
Publication types
LinkOut - more resources
Full Text Sources
Research Materials
