

Transmission dynamics of Monkeypox virus: a mathematical modelling approach
- PMID: 34667829
- PMCID: PMC8516625
- DOI: 10.1007/s40808-021-01313-2
Transmission dynamics of Monkeypox virus: a mathematical modelling approach
Abstract
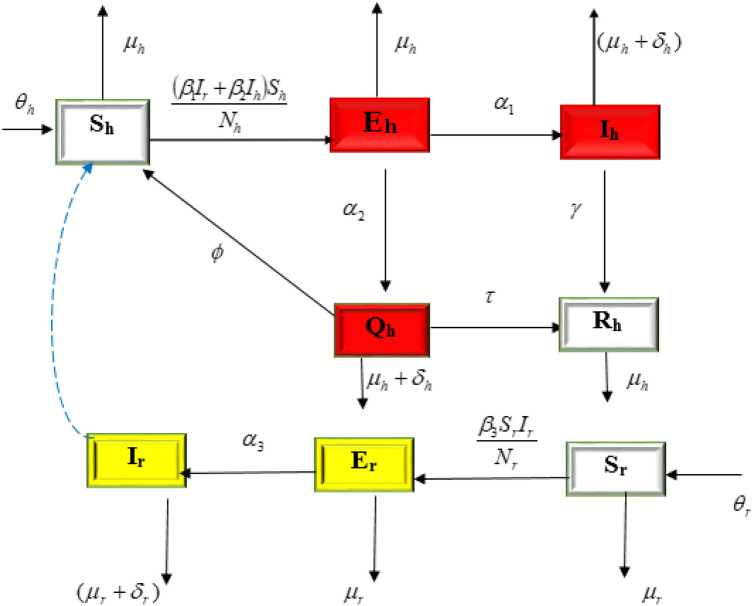
Monkeypox (MPX), similar to both smallpox and cowpox, is caused by the monkeypox virus (MPXV). It occurs mostly in remote Central and West African communities, close to tropical rain forests. It is caused by the monkeypox virus in the Poxviridae family, which belongs to the genus Orthopoxvirus. We develop and analyse a deterministic mathematical model for the monkeypox virus. Both local and global asymptotic stability conditions for disease-free and endemic equilibria are determined. It is shown that the model undergo backward bifurcation, where the locally stable disease-free equilibrium co-exists with an endemic equilibrium. Furthermore, we determine conditions under which the disease-free equilibrium of the model is globally asymptotically stable. Finally, numerical simulations to demonstrate our findings and brief discussions are provided. The findings indicate that isolation of infected individuals in the human population helps to reduce disease transmission.
Keywords: Backward bifurcation; Mathematical model; Monkeypox virus; Stability.
© The Author(s), under exclusive licence to Springer Nature Switzerland AG 2021.
Figures


References
-
- Bhunu C, Mushayabasa S. Modelling the transmission dynamics of pox-like infections. IAENG Int J. 2011;41(2):1–9.
LinkOut - more resources
Full Text Sources