. 2022 May 14;32(10):2231-2244.
doi: 10.1093/cercor/bhab352.

Brain Responses to Surprising Stimulus Offsets: Phenomenology and Functional Significance

Affiliations

Brain Responses to Surprising Stimulus Offsets: Phenomenology and Functional Significance

R Somervail et al. Cereb Cortex. .

Abstract

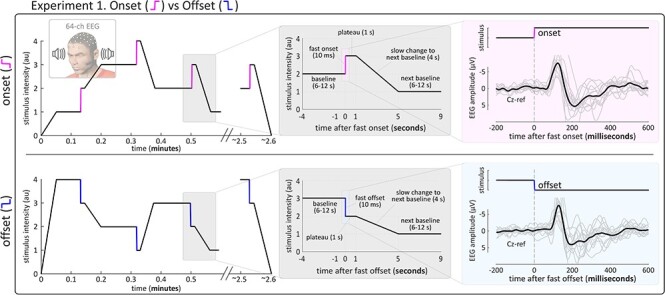
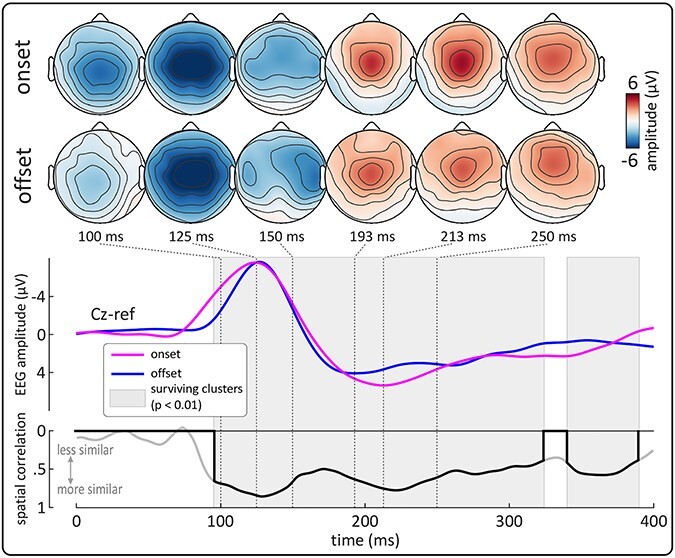
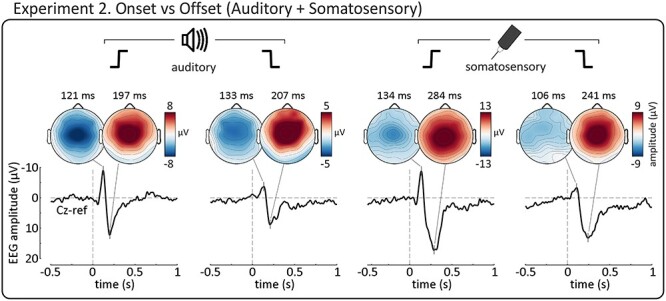
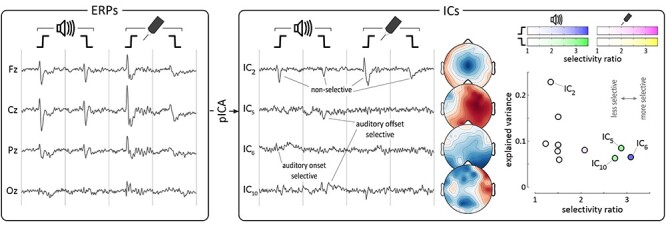
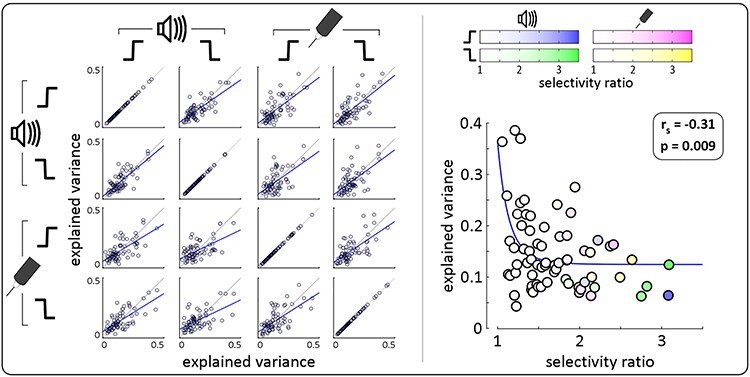
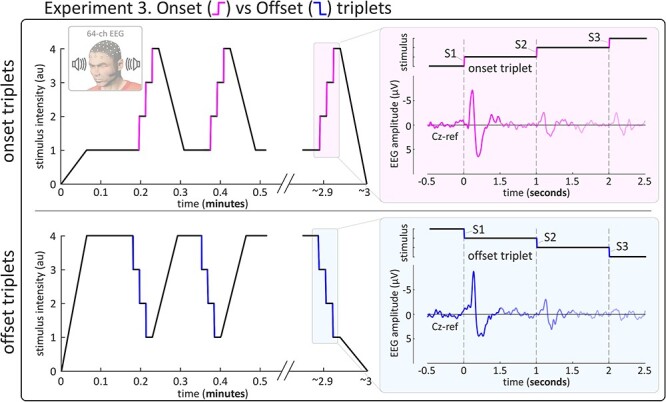
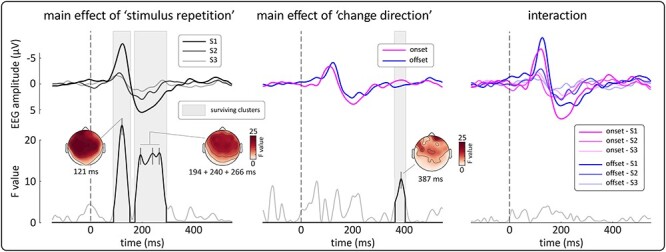
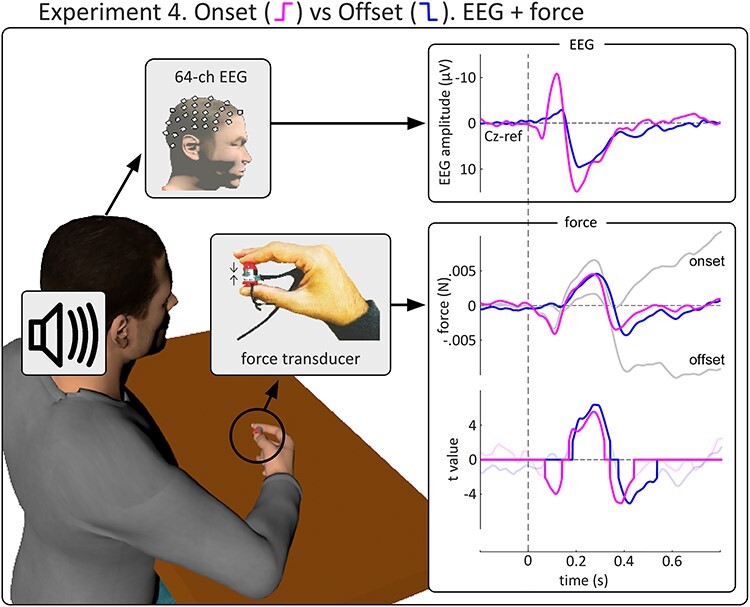
Abrupt increases of sensory input (onsets) likely reflect the occurrence of novel events or objects in the environment, potentially requiring immediate behavioral responses. Accordingly, onsets elicit a transient and widespread modulation of ongoing electrocortical activity: the Vertex Potential (VP), which is likely related to the optimisation of rapid behavioral responses. In contrast, the functional significance of the brain response elicited by abrupt decreases of sensory input (offsets) is more elusive, and a detailed comparison of onset and offset VPs is lacking. In four experiments conducted on 44 humans, we observed that onset and offset VPs share several phenomenological and functional properties: they (1) have highly similar scalp topographies across time, (2) are both largely comprised of supramodal neural activity, (3) are both highly sensitive to surprise and (4) co-occur with similar modulations of ongoing motor output. These results demonstrate that the onset and offset VPs largely reflect the activity of a common supramodal brain network, likely consequent to the activation of the extralemniscal sensory system which runs in parallel with core sensory pathways. The transient activation of this system has clear implications in optimizing the behavioral responses to surprising environmental changes.

Keywords: Electroencephalography (EEG); Vertex Potential; behavioral relevance; stimulus offset; surprise.


Figures

Figure 1
Figure 1
Experiment 1: stimulation profile and experimental design. Left. Stimulation profile of typical onset (top) and offset (bottom) blocks in Experiment 1. Stimulus intensity abruptly increased (onset; pink segments) or decreased (offset; blue segments) from a baseline level to a target level in 10 ms (colored segments), plateaued for 1 s and then slowly increased or decreased to the next baseline level in 4 s. All abrupt intensity changes had the same differential intensity (1/4 of the intensity range). Right. Grand averages (black) and participant-level averages (gray) elicited by onsets (top) and offsets (bottom).
Figure 2
Figure 2
Experiment 1: abrupt onsets and offsets of auditory stimuli elicit highly-similar Vertex Potentials. Topographies show the evolution of the scalp distribution of onset and offset ERPs over time. The top plot shows the grand-average waveforms (Cz) elicited by abrupt auditory onsets and offsets. The bottom plot shows the timecourse of the mean spatial correlation between the two waveforms. Gray areas show time intervals in which spatial correlation was statistically significant at group-level. Both responses had highly similar scalp distributions throughout their timecourse. The similarity was strongest at the peak latencies, where both responses were dominated by widespread negative and positive waves, maximal at scalp vertex (Vertex Potentials).
Figure 3
Figure 3
Experiment 2: both onset and offset Vertex Potentials are highly supramodal. Plots show the grand-average waveforms (Cz) elicited by abrupt auditory onsets (far-left), auditory offsets (middle-left), somatosensory onsets (middle-right) and somatosensory offsets (far-right). Scalp distributions are shown for the N and P peak of each ERP. All four waveforms were dominated by highly similar Vertex Potentials, although the N wave of the somatosensory offset VP overlapped with a left-lateralised component, possibly reflecting the activity of the primary somatosensory cortex contralateral to the stimulated hand (Valentini et al. 2012).
Figure 4
Figure 4
Experiment 2: probabilistic independent component analysis (pICA) applied to the average waveforms of an example participant. We used pICA to decompose the concatenated participant-level averages (left panel) into a set of temporally-independent and spatially-fixed independent components (ICs) best reflecting the data (right panel). Four example ICs are shown along with their spatial distributions. The scatterplot shows how selective each component was for a particular condition, compared with how much variance it explained on average. Color opacity reflects the selectivity for a particular condition (auditory onset: blue; offset: green; somatosensory onset: pink; offset: yellow). The three most selective components (IC 5, 6 and 10) were somewhat selective for auditory offset (green), onset (blue) and offset respectively. Note that the largest component (IC 2) was highly unselective, while the most selective components did not contribute greatly to the overall variance of the waveforms.
Figure 5
Figure 5
Experiment 2: group-level pICA results. Supramodal, non-specific components explained the most variance. Left. Scatterplots show, for each component, the mean explained variance in each pair of conditions, at group-level (i.e., circles show components from each participant). Blue lines show linear regression. Gray lines are identity lines. Strong positive correlations can be seen in all scatterplots, showing that components explaining a certain amount of variance in one stimulus condition were likely to explain a similar amount of variance in other conditions. Right. The scatterplot shows how selective these same components were for a particular condition, compared with how much variance they explained on average. Color opacity indexes the selectivity for a particular condition (auditory onset: blue; offset: green; somatosensory onset: pink; offset: yellow). Blue line shows non-linear regression (power law). The strong negative correlation shows that components explaining the most variance were also the least selective, while the most selective components explained the least variance.
Figure 6
Figure 6
Experiment 3: stimulation profile and experimental design. Left. Stimulation profile of typical onset (top) and offset (bottom) blocks in Experiment 3. From baseline, stimulus intensity abruptly increased (onset) or decreased (offset) three times in a row (S1-S2-S3) with a 1-s interval between each change (i.e., a triplet at 1 Hz). Before each triplet, the baseline level preceding the first change (S1) was reached by slowly changing the intensity level from the previous triplet in 4 s. Right. Grand averages for the Vertex Potentials (VPs) elicited by the three stimuli in the triplet. Repetition of the abrupt change reduced the magnitude of subsequent VPs, for both onsets and offsets.
Figure 7
Figure 7
Experiment 3: onset- and offset-evoked potentials similarly habituated when the stimulus was repeated predictably at 1 Hz. Top row. Group-level average waveforms (Cz) for each level of “stimulus repetition” (S1, S2, S3; left), “change direction” (onset, offset; middle) and for each individual condition (right). Bottom row. F-value timecourses for each factor (Cz). Gray areas show significant clusters after permutation testing. The N and P waves were both significantly modulated by factor “stimulus repetition”, reflecting the habituation of the Vertex Potentials (VPs) after the first abrupt change (S1). Importantly, these effects were widespread across the scalp and there was no evidence of an interaction, indicating that the onset and offset VPs habituated similarly across the scalp. There were no significant effects associated with the factor “change direction” during the timecourse of the VP. These results show that that similar underlying neural generators were modulated by stimulus repetition and provide further evidence that the onset and offset VPs reflect a common brain network.
Figure 8
Figure 8
Experiment 4: abrupt onsets and offsets elicit similar modulations of motor output during an isometric force task. Left. Experimental setup of Experiment 4: participants sat at a table applying a constant force with their index and thumb (measured by a force transducer), while receiving abrupt auditory onsets and offsets. Right. Top row shows the grand-average EEG responses elicited by onsets (pink) and offsets (blue). Middle row shows the grand-average force modulations. Colored plots show the high-pass filtered signals; gray plots show the unfiltered signals. Bottom row shows the t-value timecourse from the t-tests against zero across participants. Opaque lines show significant clusters. Onsets and offsets both elicited a similar transient increase of force at ~ 280 ms, followed by a decrease at ~ 400 ms. Onsets, but not offsets, elicited an initial force decrease at ~ 100 ms. These results indicate that both onsets and offsets elicited a largely similar multiphasic pattern of force modulations. Unfiltered force plots (in gray, bottom right panel) show that both onsets and offsets both elicited a late force modulation, albeit in the opposite direction.

Similar articles

Cited by

References

    1. Albe-Fessard D, Besson JM. 1973. Convergent Thalamic and Cortical Projections - The Non-Specific System. In: Iggo A, editor. Somatosensory System. Handbook of Sensory Physiology. Berlin, Heidelberg: Springer Berlin Heidelberg, pp. 489–560.
    1. Albe-Fessard D, Kruger L. 1962. Duality of unit discharges from cat centrum medianum in response to natural and electrical stimulation. J Neurophysiol. 25:3–20. - PubMed
    1. Anderson LA, Christianson GB, Linden JF. 2009. Stimulus-specific adaptation occurs in the auditory thalamus. J Neurosci. 29:7359–7363. - PMC - PubMed
    1. Baltzell LS, Billings CJ. 2014. Sensitivity of offset and onset cortical auditory evoked potentials to signals in noise. Clin Neurophysiol. 125:370–380. - PMC - PubMed
    1. Bancaud J, Bloch V, Paillard J. 1953. Contribution EEG à l’étude des potentiels évoqués chez l’homme au niveau du vertex. Rev Neurol. 89:399–418. - PubMed

Publication types