

A global ecological signal of extinction risk in terrestrial vertebrates
- PMID: 34668599
- PMCID: PMC9299904
- DOI: 10.1111/cobi.13852
A global ecological signal of extinction risk in terrestrial vertebrates
Abstract
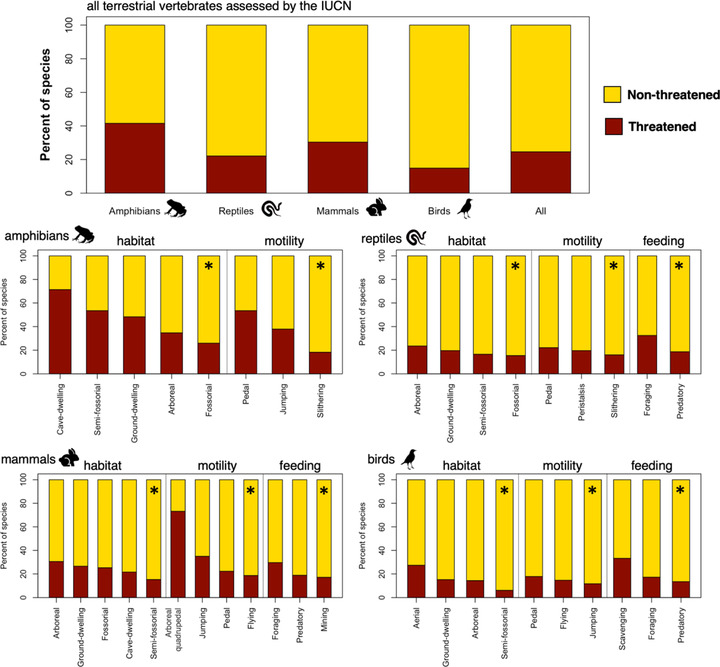
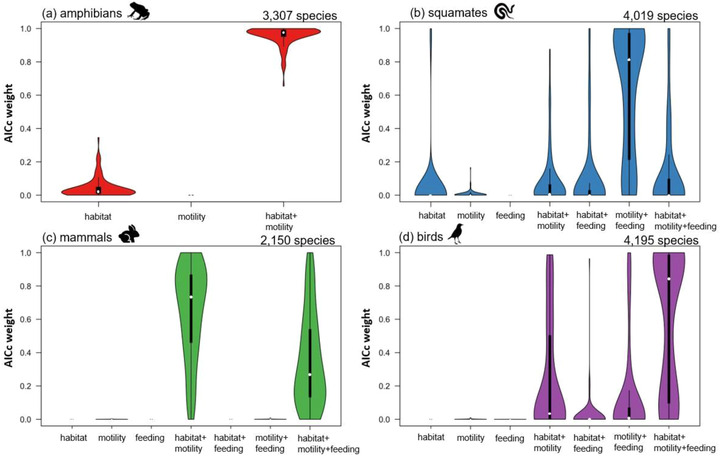
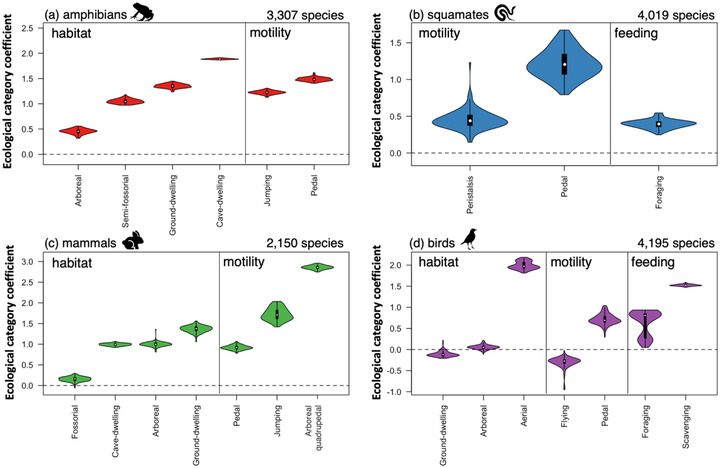
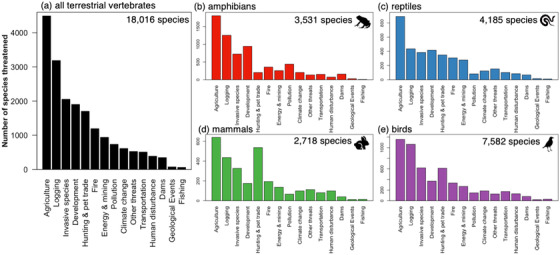
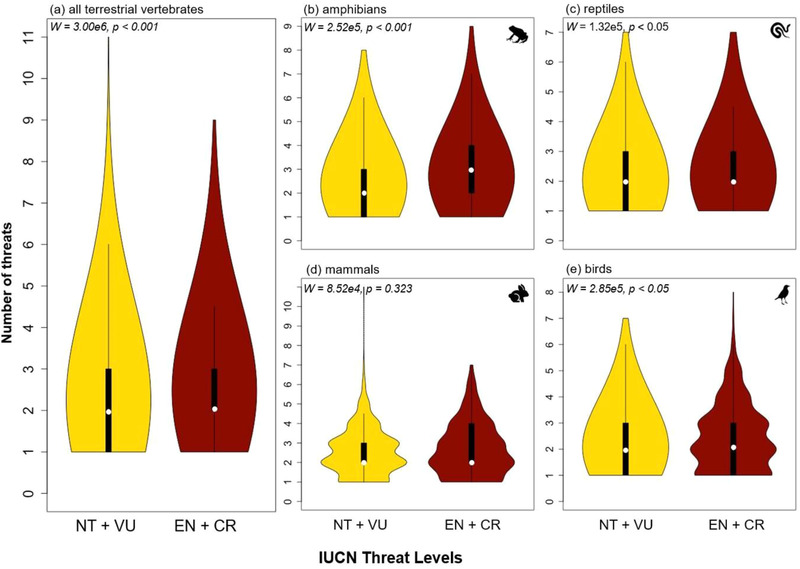
To determine the distribution and causes of extinction threat across functional groups of terrestrial vertebrates, we assembled an ecological trait data set for 18,016 species of terrestrial vertebrates and utilized phylogenetic comparative methods to test which categories of habitat association, mode of locomotion, and feeding mode best predicted extinction risk. We also examined the individual categories of the International Union for Conservation of Nature Red List extinction drivers (e.g., agriculture and logging) threatening each species and determined the greatest threats for each of the four terrestrial vertebrate groups. We then quantified the sum of extinction drivers threatening each species to provide a multistressor perspective on threat. Cave dwelling amphibians (p < 0.01), arboreal quadrupedal mammals (all of which are primates) (p < 0.01), aerial and scavenging birds (p < 0.01), and pedal (i.e., walking) squamates (p < 0.01) were all disproportionately threatened with extinction in comparison with the other assessed ecological traits. Across all threatened vertebrate species in the study, the most common risk factors were agriculture, threatening 4491 species, followed by logging, threatening 3187 species, and then invasive species and disease, threatening 2053 species. Species at higher risk of extinction were simultaneously at risk from a greater number of threat types. If left unabated, the disproportionate loss of species with certain functional traits and increasing anthropogenic pressures are likely to disrupt ecosystem functions globally. A shift in focus from species- to trait-centric conservation practices will allow for protection of at-risk functional diversity from regional to global scales.
Una Señal Ecológica Mundial del Riesgo de Extinción de los Vertebrados Terrestres Resumen Construimos un conjunto de datos de atributos ecológicos de 18,016 especies de vertebrados terrestres y utilizamos métodos de comparación filogenética para analizar cuáles categorías de asociación de hábitat, modo de locomoción y modo de alimentación predicen de mejor manera el riesgo de extinción. Lo anterior lo hicimos para determinar la distribución y las causas de las amenazas de extinción a lo largo de los grupos funcionales de vertebrados terrestres. También examinamos las categorías individuales de los factores de extinción (p. ej.: agricultura, tala de árboles) de la Lista Roja de la Unión Internacional para la Conservación de la Naturaleza que amenazan a cada especie y determinamos las principales amenazas para cada uno de los cuatro grupos de vertebrados terrestres. Después cuantificamos la suma de los factores de extinción que amenazan a cada especie para proporcionar una perspectiva de estresores múltiples sobre la amenaza. Los anfibios cavernícolas (p < 0.01), mamíferos arbóreos cuadrúpedos (todos son primates) (p < 0.01), aves aéreas y carroñeras (p < 0.01) y los escamados caminantes (p < 0.01) tuvieron una amenaza de extinción desproporcionada en comparación con los otros atributos ecológicos analizados. En todas las especies de vertebrados que estudiamos, los factores de riesgo más comunes fueron la agricultura, que amenaza a 4,491 especies, y la deforestación, que amenaza a 3,187 especies; le siguen las especies invasoras y las enfermedades, que juntas amenazan a 2,053 especies. Las especies con el mayor riesgo de extinción también se encontraban simultáneamente en riesgo por un mayor número de tipos de amenazas. Si esto se mantiene constante, la pérdida desproporcionada de especies con ciertos atributos funcionales y la creciente presión antropogénica probablemente alteren las funciones ecosistémicas a nivel mundial. Un cambio en el enfoque de las prácticas de conservación, de estar centradas en la especie a estar centradas en los atributos, permitirá la protección de la diversidad funcional en riesgo desde la escala regional hasta la global.
Keywords: extinction drivers; factores de extinción; feeding mode; habitat; hábitat; locomoción; locomotion; modo de alimentación; nivel de riesgo; risk level.
© 2021 The Authors. Conservation Biology published by Wiley Periodicals LLC on behalf of Society for Conservation Biology.
Figures
References
-
- Adler, D. , & Kelly, S. T . (2020). vioplot: Violin plot. R package version 0.3.5. Available from https://github.com/TomKellyGenetics/vioplot.
-
- AmphibiaWeb . (2020). Data from The AmphibiaWeb. Available from https://amphibiaweb.org.
-
- Baillie, J. E. , Hilton‐Taylor, C. , & Stuart, S. N . (2004). IUCN Red List of threatened species. A global species assessment. Gland: IUCN.
Publication types
MeSH terms
LinkOut - more resources
Full Text Sources
