The K18-Human ACE2 Transgenic Mouse Model Recapitulates Non-severe and Severe COVID-19 in Response to an Infectious Dose of the SARS-CoV-2 Virus
- PMID: 34668775
- PMCID: PMC8754221
- DOI: 10.1128/JVI.00964-21
The K18-Human ACE2 Transgenic Mouse Model Recapitulates Non-severe and Severe COVID-19 in Response to an Infectious Dose of the SARS-CoV-2 Virus
Abstract
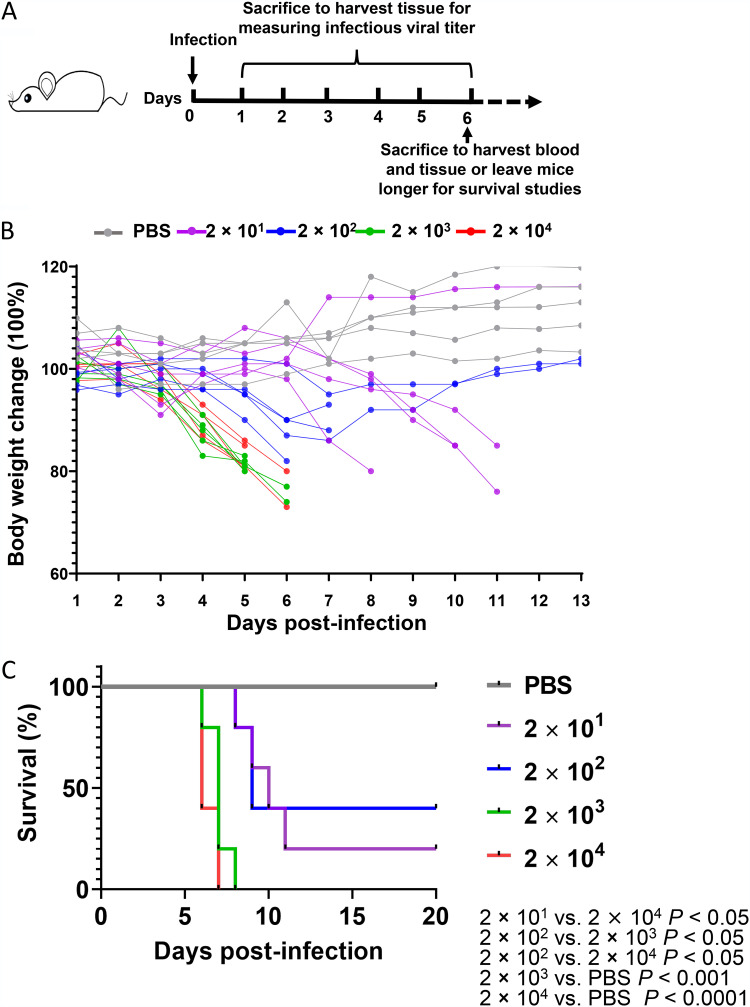
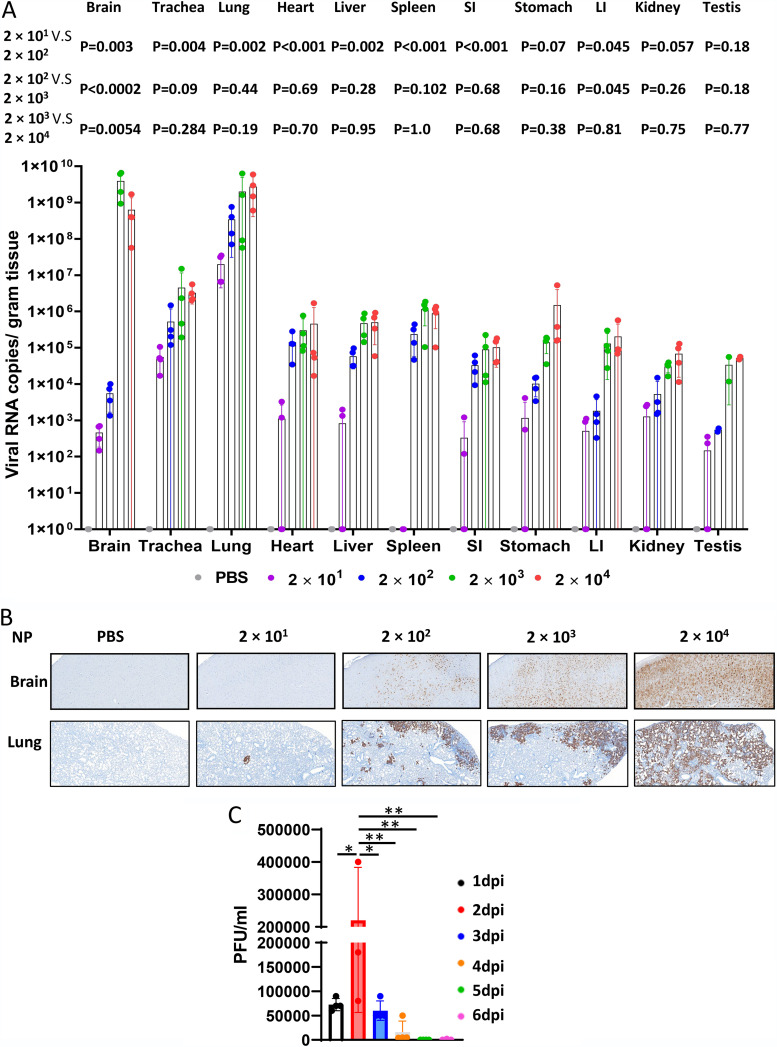
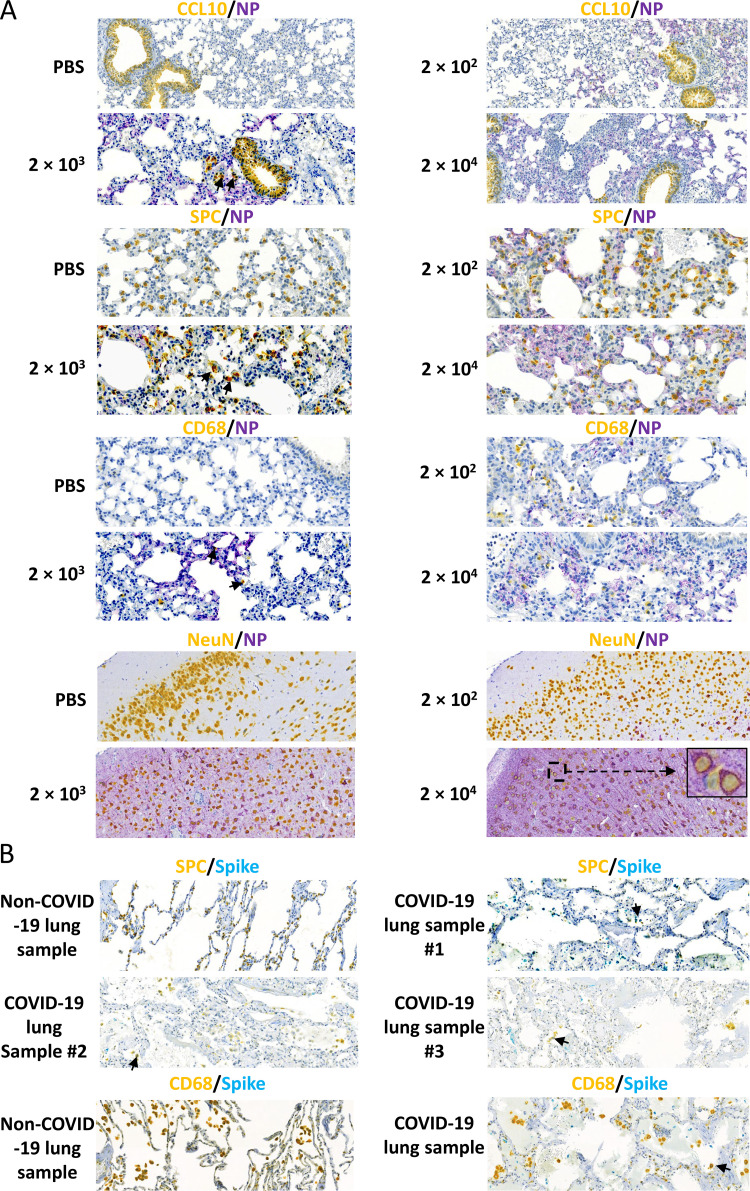
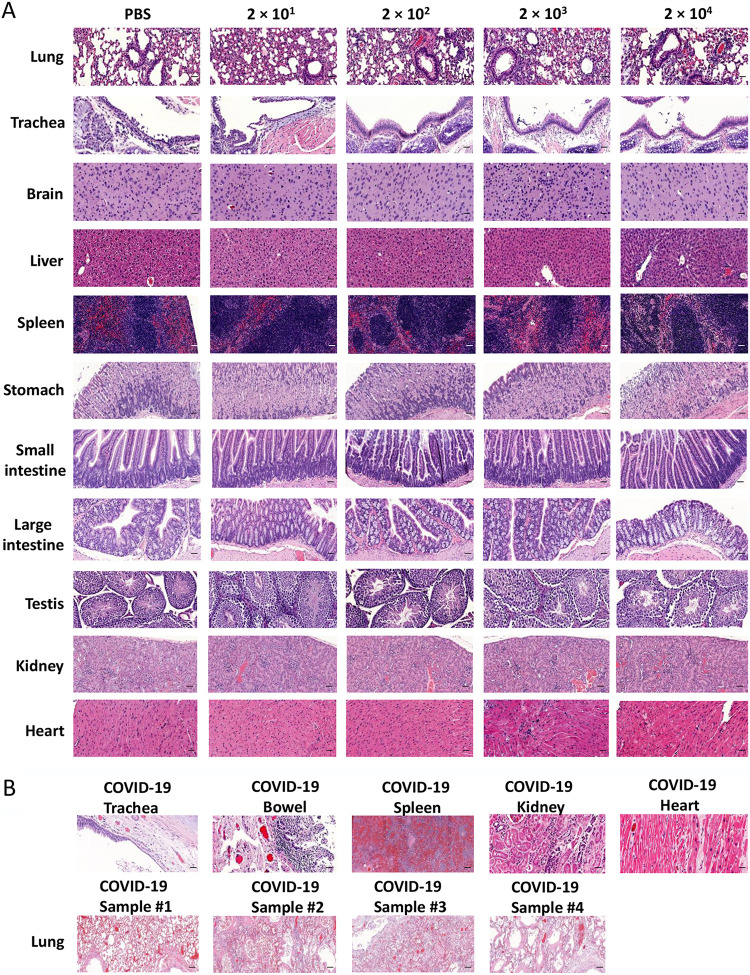
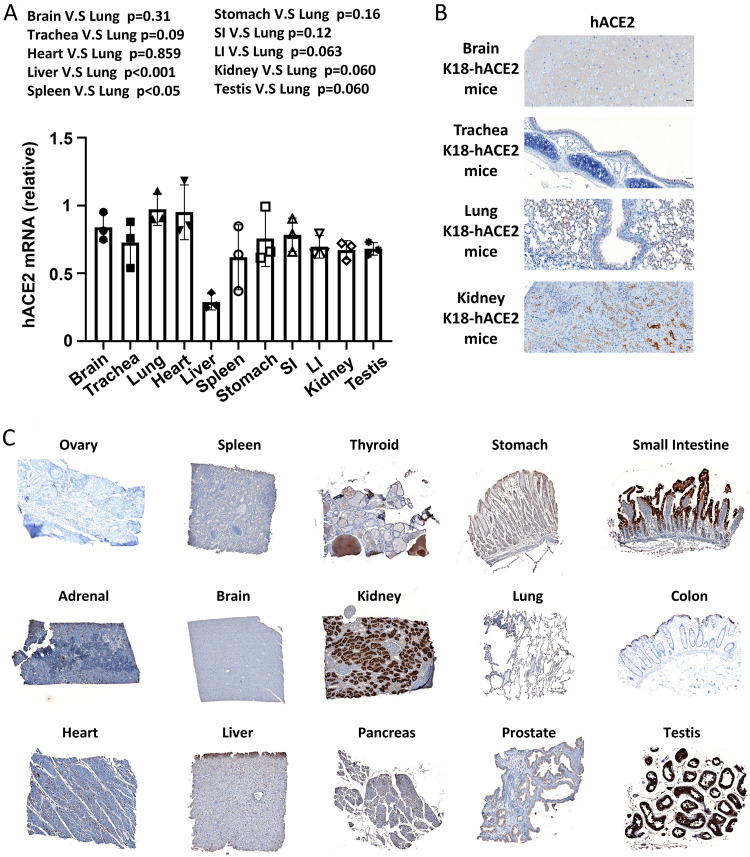
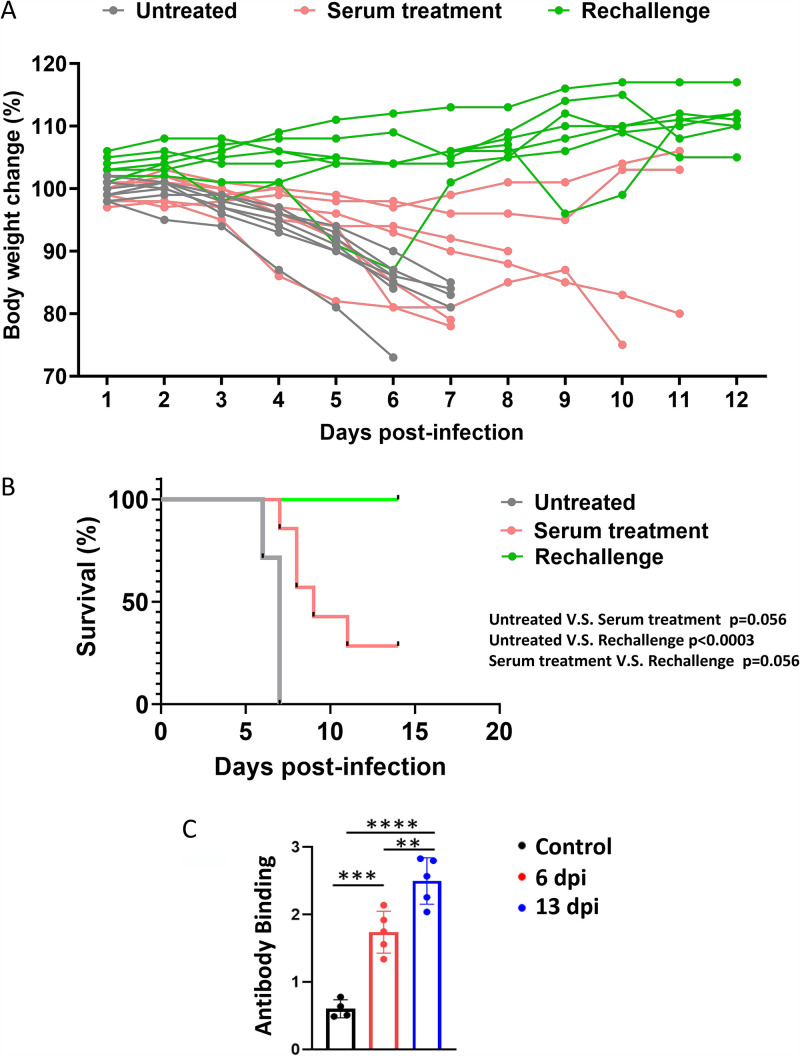
A comprehensive analysis and characterization of a severe acute respiratory syndrome coronavirus 2 (SARS-CoV-2) infection model that mimics non-severe and severe coronavirus disease 2019 (COVID-19) in humans is warranted for understating the virus and developing preventive and therapeutic agents. Here, we characterized the K18-hACE2 mouse model expressing human (h)ACE2 in mice, controlled by the human keratin 18 (K18) promoter, in the epithelia, including airway epithelial cells where SARS-CoV-2 infections typically start. We found that intranasal inoculation with higher viral doses (2 × 10³ and 2 × 10⁴ PFU) of SARS-CoV-2 caused lethality of all mice and severe damage of various organs, including lung, liver, and kidney, while lower doses (2 × 101 and 2 × 10² PFU) led to less severe tissue damage and some mice recovered from the infection. In this hACE2 mouse model, SARS-CoV-2 infection damaged multiple tissues, with a dose-dependent effect in most tissues. Similar damage was observed in postmortem samples from COVID-19 patients. Finally, the mice that recovered from infection with a low dose of virus survived rechallenge with a high dose of virus. Compared to other existing models, the K18-hACE2 model seems to be the most sensitive COVID-19 model reported to date. Our work expands the information available about this model to include analysis of multiple infectious doses and various tissues with comparison to human postmortem samples from COVID-19 patients. In conclusion, the K18-hACE2 mouse model recapitulates both severe and non-severe COVID-19 in humans being dose-dependent and can provide insight into disease progression and the efficacy of therapeutics for preventing or treating COVID-19. IMPORTANCE The pandemic of coronavirus disease 2019 (COVID-19) has reached nearly 240 million cases, caused nearly 5 million deaths worldwide as of October 2021, and has raised an urgent need for the development of novel drugs and therapeutics to prevent the spread and pathogenesis of severe acute respiratory syndrome coronavirus 2 (SARS-CoV-2). To achieve this goal, an animal model that recapitulates the features of human COVID-19 disease progress and pathogenesis is greatly needed. In this study, we have comprehensively characterized a mouse model of SARS-CoV-2 infection using K18-hACE2 transgenic mice. We infected the mice with low and high doses of SARS-CoV-2 to study the pathogenesis and survival in response to different infection patterns. Moreover, we compared the pathogenesis of the K18-hACE2 transgenic mice with that of the COVID-19 patients to show that this model could be a useful tool for the development of antiviral drugs and therapeutics.
Keywords: COVID-19; K18-hACE2; SARS-CoV-2; infectious disease; lung infection; mouse model.
Figures
References
-
- WHO. 2021. Report of the WHO-China Joint Mission on Coronavirus Disease 2019 (COVID-19).
-
- Steenblock C, Schwarz PEH, Ludwig B, Linkermann A, Zimmet P, Kulebyakin K, Tkachuk VA, Markov AG, Lehnert H, de Angelis MH, Rietzsch H, Rodionov RN, Khunti K, Hopkins D, Birkenfeld AL, Boehm B, Holt RIG, Skyler JS, DeVries JH, Renard E, Eckel RH, Alberti K, Geloneze B, Chan JC, Mbanya JC, Onyegbutulem HC, Ramachandran A, Basit A, Hassanein M, Bewick G, Spinas GA, Beuschlein F, Landgraf R, Rubino F, Mingrone G, Bornstein SR. 2021. COVID-19 and metabolic disease: mechanisms and clinical management. Lancet Diabetes Endocrinol 9:786–798. 10.1016/S2213-8587(21)00244-8. - DOI - PMC - PubMed
Publication types
MeSH terms
Substances
Grants and funding
- R01 AI129582/AI/NIAID NIH HHS/United States
- NS106170/HHS | NIH | National Institute of Neurological Disorders and Stroke (NINDS)
- R01 NS106170/NS/NINDS NIH HHS/United States
- R35 CA210087/CA/NCI NIH HHS/United States
- CA223400/HHS | NIH | National Cancer Institute (NCI)
- DISC2COVID19-11947/California Institute for Regenerative Medicine
- CA210087/HHS | NIH | National Cancer Institute (NCI)
- P30 CA033572/CA/NCI NIH HHS/United States
- AI129582/HHS | NIH | National Institute of Allergy and Infectious Diseases (NIAID)
- CA247550/HHS | NIH | National Cancer Institute (NCI)
- P01 CA163205/CA/NCI NIH HHS/United States
- R01 CA247550/CA/NCI NIH HHS/United States
- CA163205/HHS | NIH | National Cancer Institute (NCI)
- R21 CA223400/CA/NCI NIH HHS/United States
- 1364-19/Leukemia and Lymphoma Society (LLS)
- R01 CA266457/CA/NCI NIH HHS/United States
- R01 CA265095/CA/NCI NIH HHS/United States
- R01 AI161175/AI/NIAID NIH HHS/United States
LinkOut - more resources
Full Text Sources
Other Literature Sources
Medical
Molecular Biology Databases
Miscellaneous