. 2022 Jan;59(1):276-293.
doi: 10.1007/s12035-021-02591-8. Epub 2021 Oct 20.

Sex-Stratified Single-Cell RNA-Seq Analysis Identifies Sex-Specific and Cell Type-Specific Transcriptional Responses in Alzheimer's Disease Across Two Brain Regions

Affiliations

Sex-Stratified Single-Cell RNA-Seq Analysis Identifies Sex-Specific and Cell Type-Specific Transcriptional Responses in Alzheimer's Disease Across Two Brain Regions

Stella A Belonwu et al. Mol Neurobiol. 2022 Jan.

Abstract

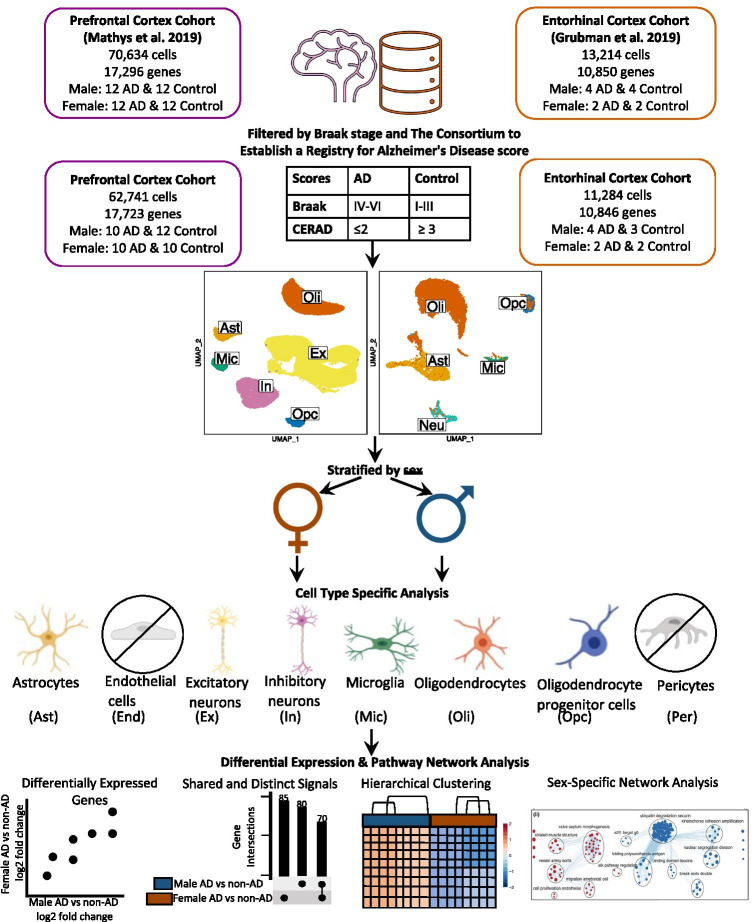
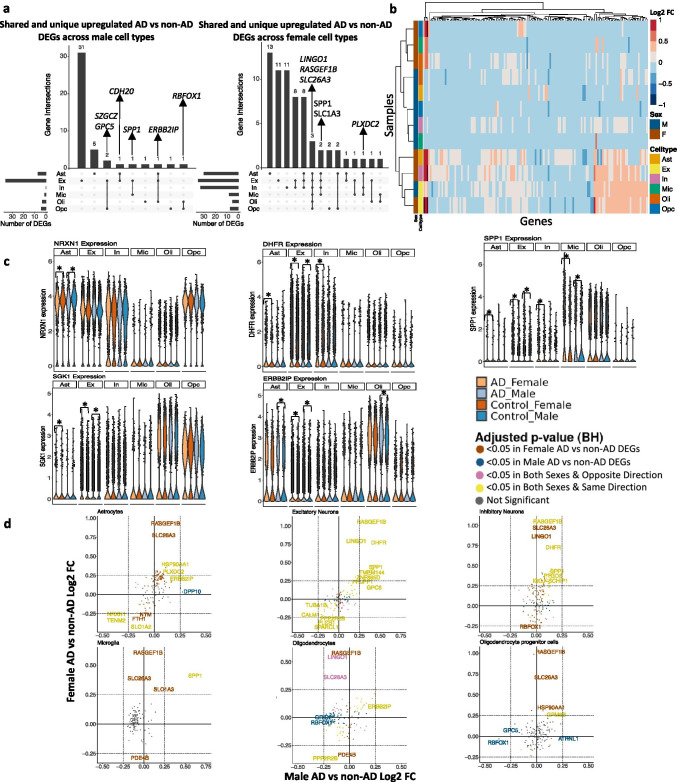
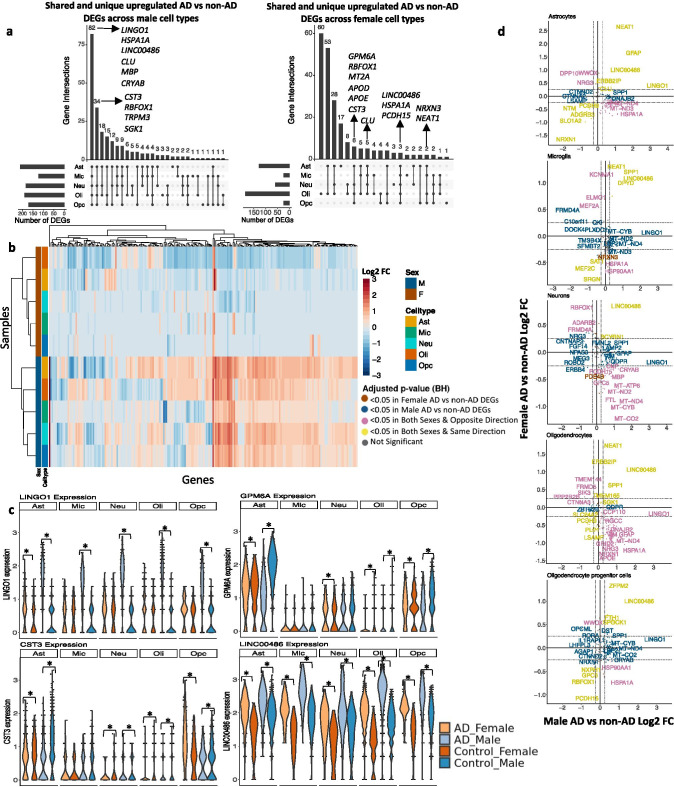
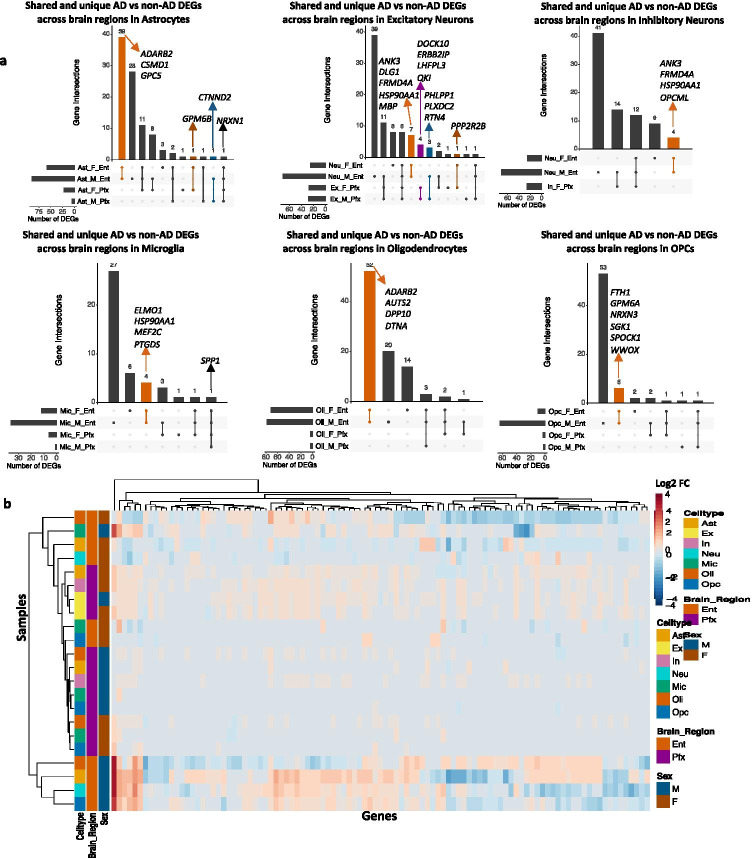
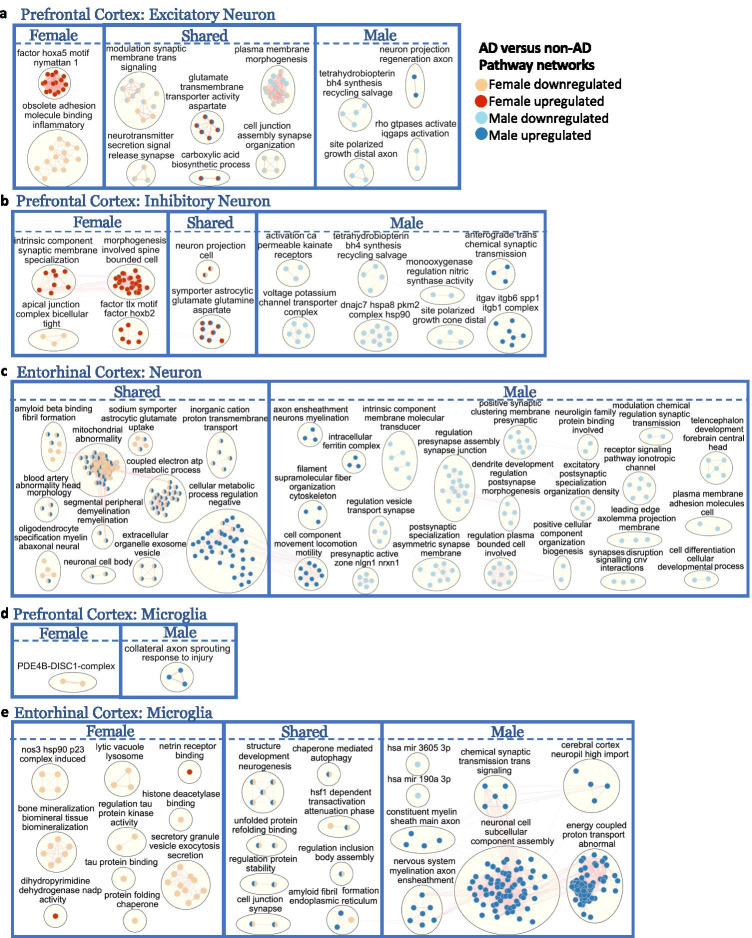
Alzheimer's disease (AD) is a pervasive neurodegenerative disorder that disproportionately affects women. Since neural anatomy and disease pathophysiology differ by sex, investigating sex-specific mechanisms in AD pathophysiology can inform new therapeutic approaches for both sexes. Previous bulk human brain RNA sequencing studies have revealed sex differences in dysregulated molecular pathways related to energy production, neuronal function, and immune response; however, the sex differences in disease mechanisms are yet to be examined comprehensively on a single-cell level. We leveraged nearly 74,000 cells from human prefrontal and entorhinal cortex samples from the first two publicly available single-cell RNA sequencing AD datasets to perform a case versus control sex-stratified differential gene expression analysis and pathway network enrichment in a cell type-specific manner for each brain region. Our examination at the single-cell level revealed sex differences in AD prominently in glial cells of the prefrontal cortex. In the entorhinal cortex, we observed the same genes and networks to be perturbed in opposing directions between sexes in AD relative to healthy state. Our findings contribute to growing evidence of sex differences in AD-related transcriptomic changes, which can fuel the development of therapies that may prove more effective at reversing AD pathophysiology.

Keywords: Alzheimer’s disease; RNA sequencing; Sex differences; Single-cell.


Conflict of interest statement

MS is on the advisory board of twoXAR. Other authors declare no competing financial interests.

Figures

Fig. 1
Fig. 1
Workflow for cohort sample definition and sex-stratified cell type-specific differential gene expression and functional enrichment. AD and non-AD cells were determined based on tau (Braak) and amyloid-β plaque (CERAD) burdens. Cell types were identified, and AD versus non-AD differential expression and pathway network enrichment analyses were performed separately for each sex in each cell type
Fig. 2
Fig. 2
Sex-stratified cell type-specific differential gene expression signatures in the prefrontal cortex. a. Upset plots indicating intersections of AD versus non-AD DEGs (BH-adjusted p value < 0.05 and absolute LFC > 0.25) across cell types. Rows correspond to cell types. The bar chart shows the number of single and common sets of DEGs across cell types. Single filled dots represent a unique set of DEGs for the corresponding cell type. Multiple filled black dots connected by vertical lines represent common sets of DEGs across cell types. b. LFC scores of all genes in the DE analysis clustered by cell type and sex. c. LINGO1, PLXDC2, SPP1, RBFOX1, and ERBB21P expressions. Asterisks represent meeting both significance and absolute LFC thresholds. Colors correspond to sex and AD status. d. Pairwise DEG plots of DEGs in male and female samples using LFC scores. Genes shown are significant and have a LFC > 0.25 in at least one sex. Colors indicate significance level of DEGs and whether DEGs are unique or shared by both sexes
Fig. 3
Fig. 3
Sex-stratified cell type-specific differential gene expression signatures in the entorhinal cortex. a. Upset plots indicating intersections of AD versus non-AD DEGs (BH-adjusted p value < 0.05 and absolute LFC > 0.25) across cell types. Rows correspond to cell types. The bar chart shows the number of single and common sets of DEGs across cell types. Single filled dots represent a unique set of DEGs for the corresponding cell type. Multiple filled black dots connected by vertical lines represent common sets of DEGs across cell types. b. LFC scores of all genes in the DE analysis clustered by cell type and sex. c. LINGO1, GPM6A, CST3, and LINC00486 expressions. Asterisks represent meeting both significance and absolute LFC thresholds. Colors correspond to sex and AD status. d. Pairwise DEG plots of DEGs in male and female samples using LFC scores. Genes shown are significant and have a LFC > 0.25 in at least one sex. Colors indicate significance level of DEGs and whether DEGs are unique or shared by both sexes
Fig. 4
Fig. 4
Sex-stratified cell type-specific disease signatures across brain regions. a. Upset plots indicating intersections of AD versus non-AD DEGs (BH-adjusted p value < 0.05 and absolute LFC > 0.25) within cell types across brain region and sex. Rows correspond to brain region and sex pairings. The bar chart shows the number of single and common sets of DEGs across brain regions and sex. Single filled dots represent a unique set of DEGs for the corresponding brain region and sex. Multiple filled black dots connected by vertical lines represent common sets of DEGs across brain region and sex. Bar chart colors correspond to whether DEGs are shared by brain regions or sex using the bottom right key. b. LFC scores of all genes in the DE analysis of both brain regions clustered by cell type, brain region, and sex
Fig. 5
Fig. 5
Enriched disease pathway networks in female and male neurons and microglia. AD compared to non-AD functionally enriched pathways with a BH-adjusted p value < 0.05 clustered into biological themes for a. excitatory and b. inhibitory neurons from the prefrontal cortex; c. neurons from the entorhinal cortex; and microglia from the d. prefrontal and e. entorhinal cortices. Lines represent gene set overlaps with magnitude showed by thickness

References

    1. Masters CL, Bateman R, Blennow K, Rowe CC, Sperling RA, Cummings JL. Alzheimer’s disease. Nat Rev Dis Primers. 2015;1(1):1–18. - PubMed
    1. Murray ME, Graff-Radford NR, Ross OA, Petersen RC, Duara R, Dickson DW. Neuropathologically defined subtypes of Alzheimer’s disease with distinct clinical characteristics: a retrospective study. Lancet Neurol. 2011;10(9):785–796. - PMC - PubMed
    1. Scheltens P, Blennow K, Breteler MMB, de Strooper B, Frisoni GB, Salloway S, et al. Alzheimer’s disease. Lancet. 2016;388(10043):505–517. - PubMed
    1. Prince MJ, Comas-Herrera A, Knapp M, Guerchet MM, Karagiannidou M. World Alzheimer report 2016—improving healthcare for people living with dementia: coverage, quality and costs now and in the future. 11/6/2020; Available from: https://kclpure.kcl.ac.uk/portal/en/publications/world-alzheimer-report-...
    1. Bureau UC. An Aging World: 2015 [Internet]. The United States Census Bureau. [cited 2021 Mar 15]. 11/6/2020 Available from: https://www.census.gov/library/publications/2016/demo/P95-16-1.html