. 2022 Jan 12;22(1):533-542.
doi: 10.1021/acs.nanolett.1c02503. Epub 2021 Oct 20.

Orthogonal Design of Experiments for Optimization of Lipid Nanoparticles for mRNA Engineering of CAR T Cells

Affiliations

Orthogonal Design of Experiments for Optimization of Lipid Nanoparticles for mRNA Engineering of CAR T Cells

Margaret M Billingsley et al. Nano Lett. .

Abstract

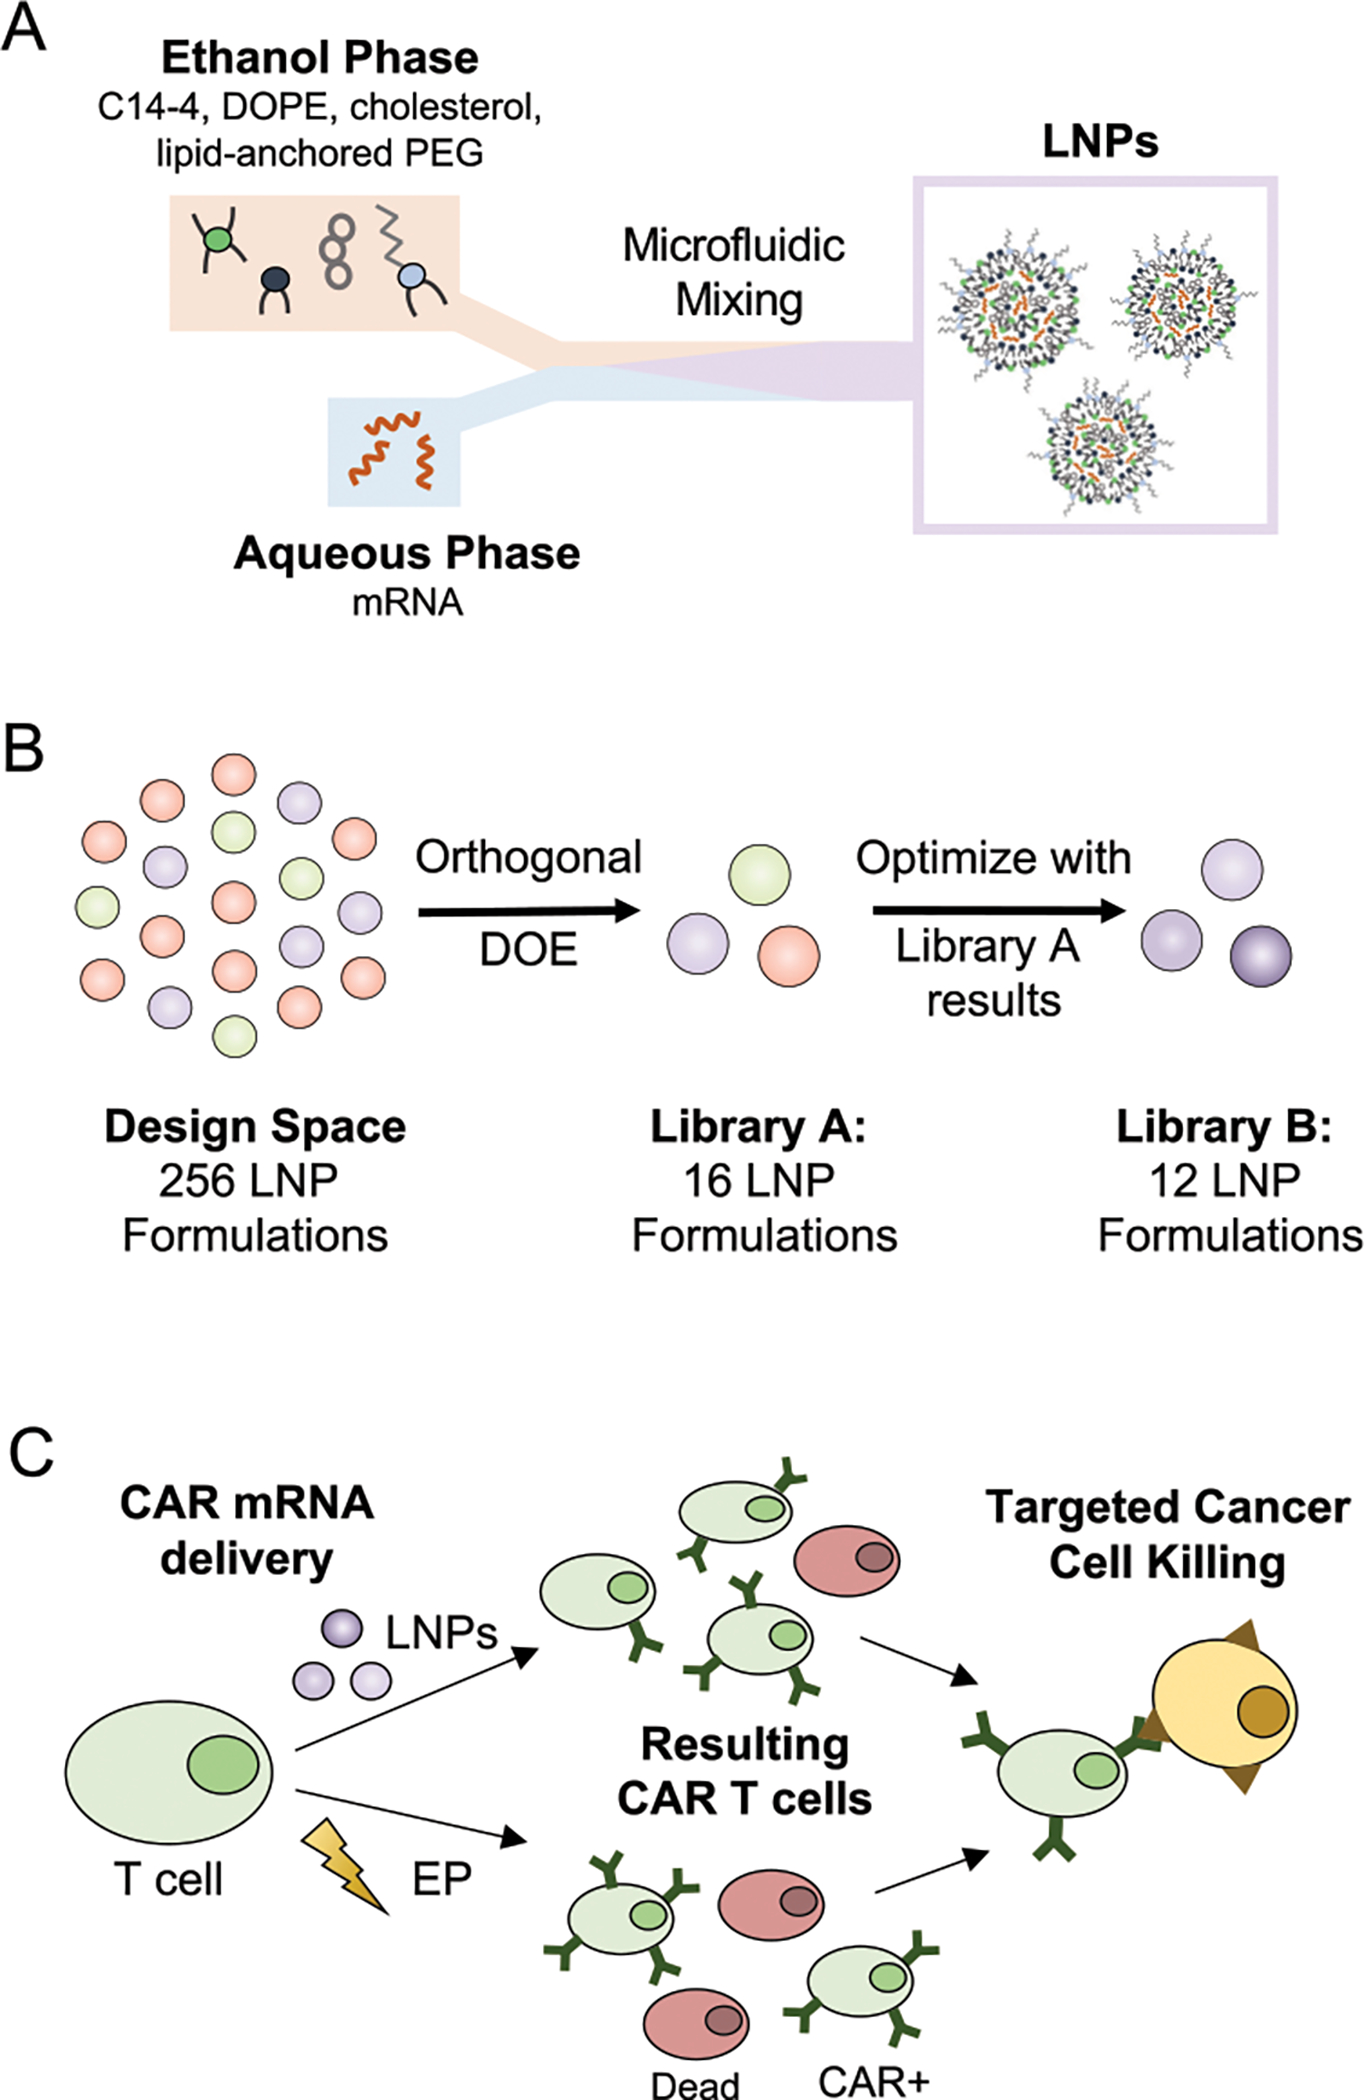
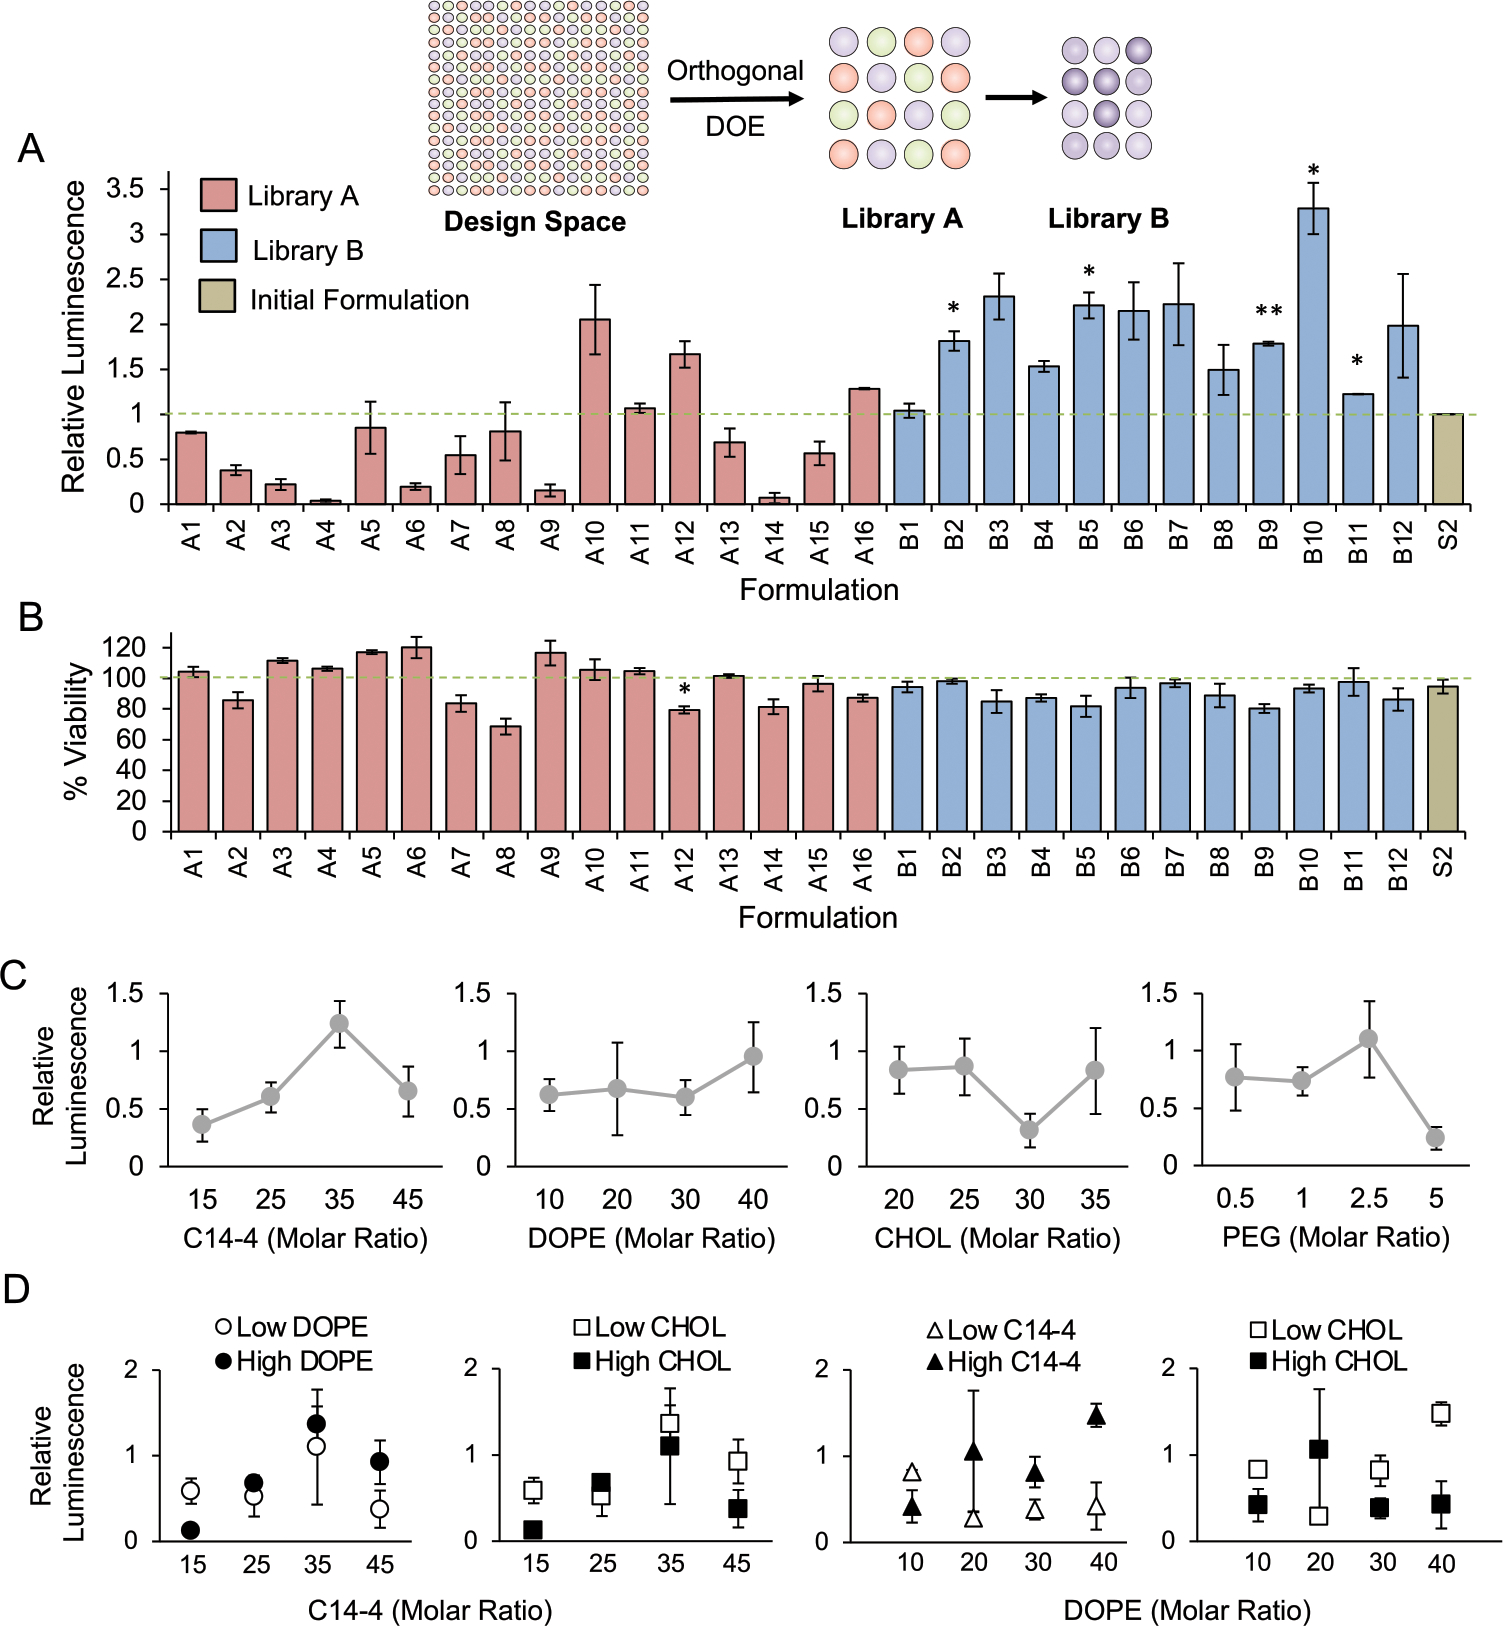
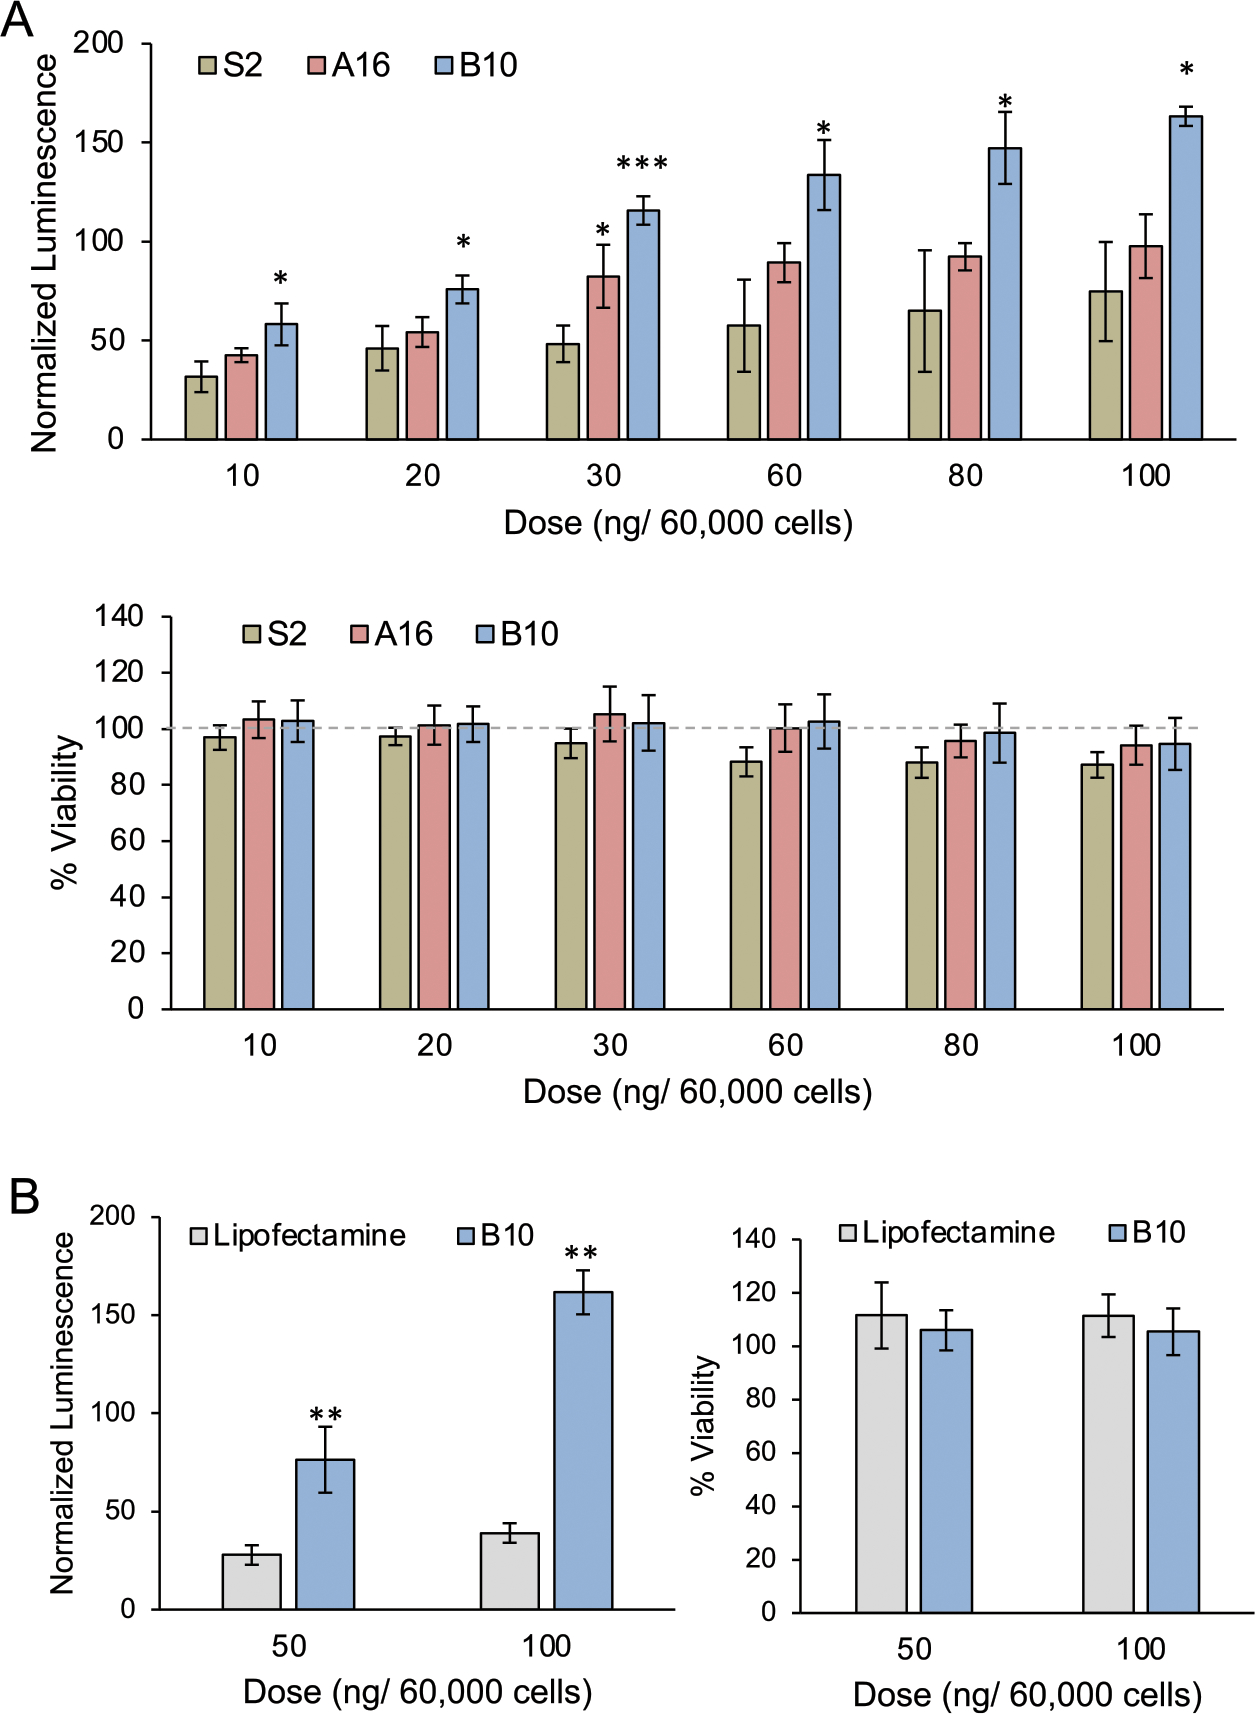
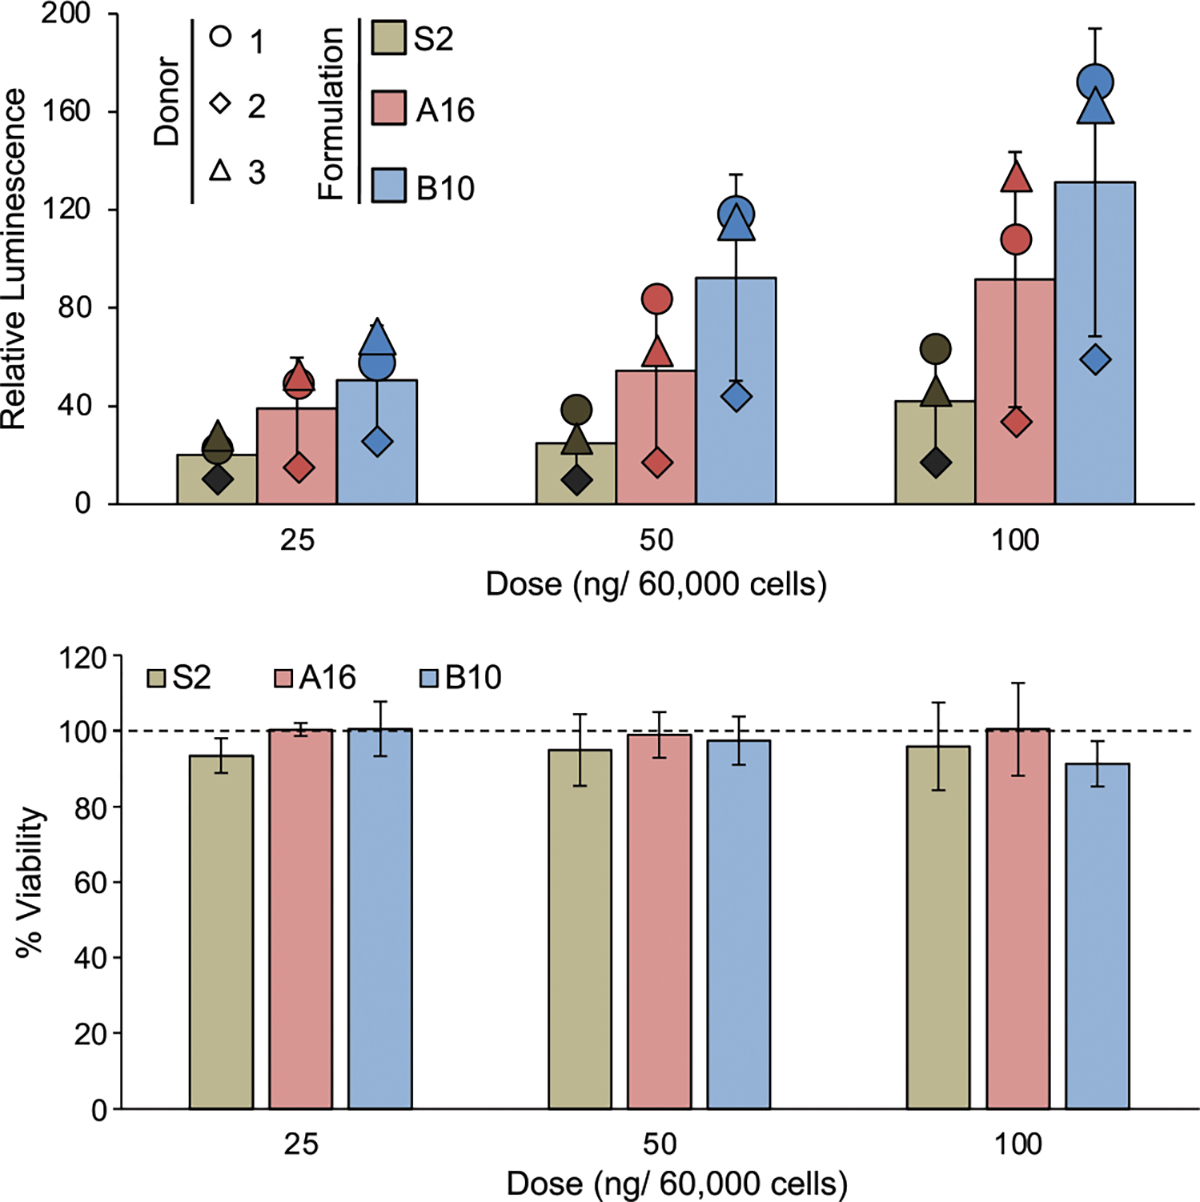
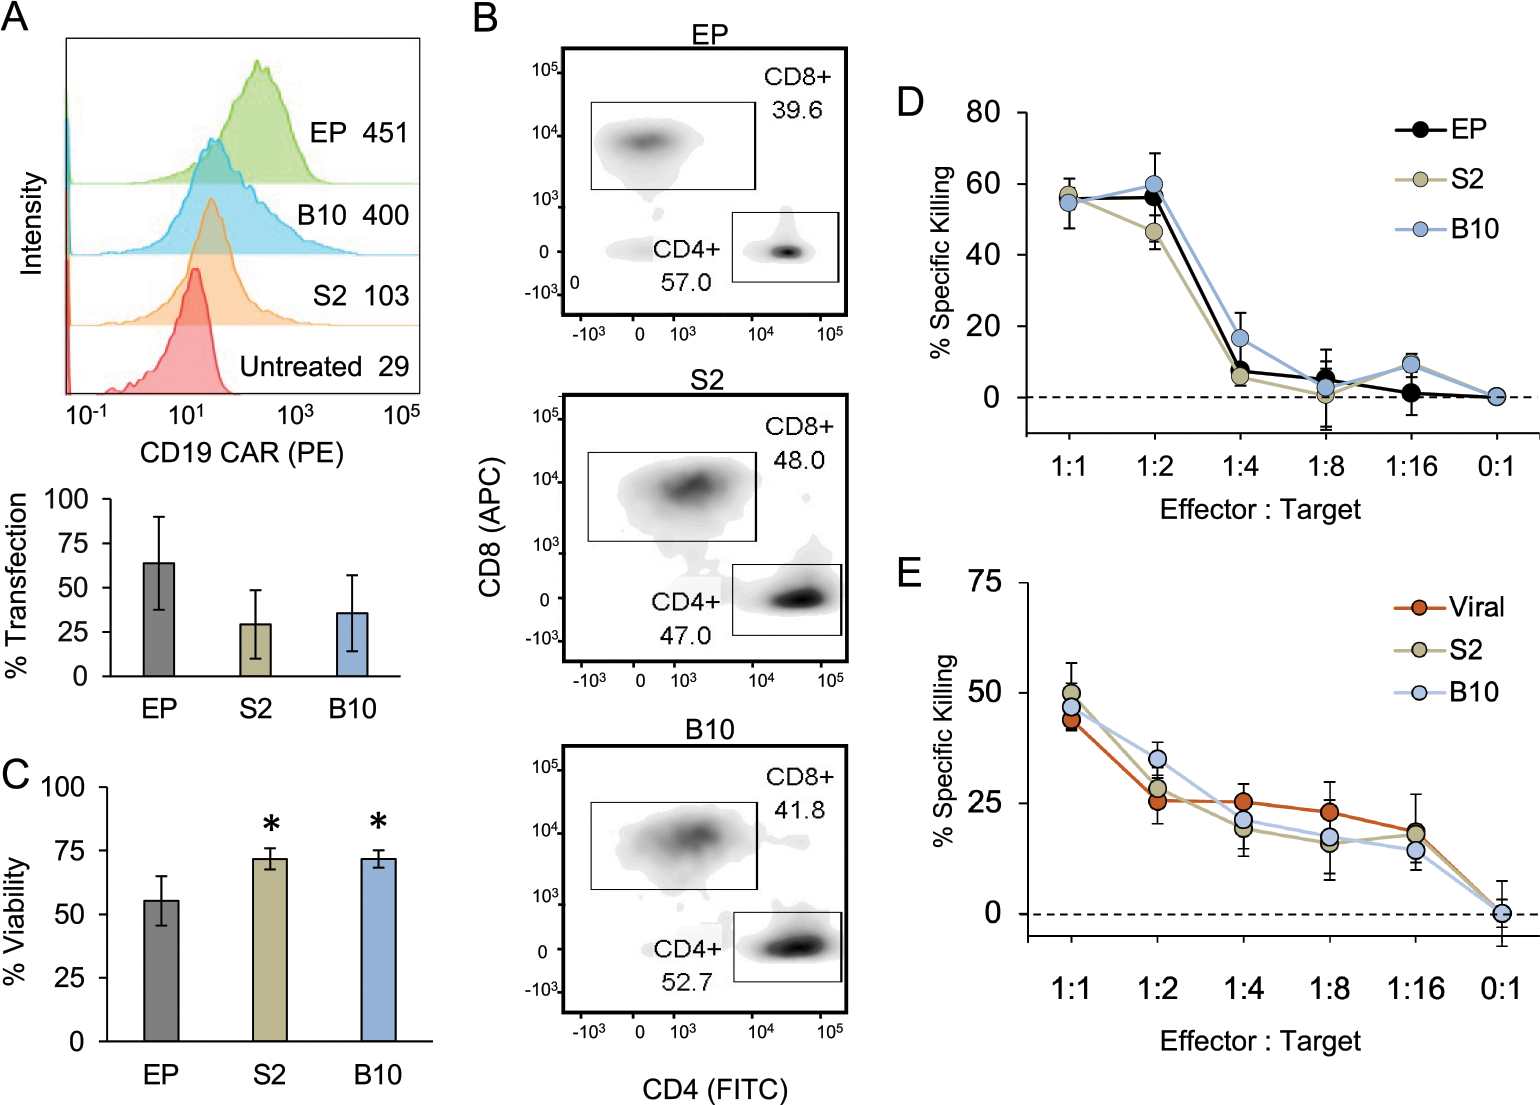
Viral engineered chimeric antigen receptor (CAR) T cell therapies are potent, targeted cancer immunotherapies, but their permanent CAR expression can lead to severe adverse effects. Nonviral messenger RNA (mRNA) CAR T cells are being explored to overcome these drawbacks, but electroporation, the most common T cell transfection method, is limited by cytotoxicity. As a potentially safer nonviral delivery strategy, here, sequential libraries of ionizable lipid nanoparticle (LNP) formulations with varied excipient compositions were screened in comparison to a standard formulation for improved mRNA delivery to T cells with low cytotoxicity, revealing B10 as the top formulation with a 3-fold increase in mRNA delivery. When compared to electroporation in primary human T cells, B10 LNPs induced comparable CAR expression with reduced cytotoxicity while demonstrating potent cancer cell killing. These results demonstrate the impact of excipient optimization on LNP performance and support B10 LNPs as a potent mRNA delivery platform for T cell engineering.

Keywords: CAR T; T cell engineering; lipid nanoparticles; mRNA delivery.


Conflict of interest statement

The authors declare the following competing financial interest(s): M.J.M., M.M.B., and C.H.J. are inventors on patents related to this work filed by the Trustees of the University of Pennsylvania (PCT/US20/56252 and PCT/ US20/56255).

Figures

Figure 1.
Figure 1.
(A) Schematic of LNP synthesis including the components used to make LNPs via microfluidic mixing and the expected resulting structure. (B) Visualization of the design process used to generate libraries A and B with library A resulting from an orthogonal DOE screening a wide range of excipient molar ratios, and library B examining more formulations within a narrowed range of excipient ratios based on the results from the library A screen. (C) Schematic of the CAR T cell production utilizing either LNPs or EP for mRNA delivery to T cells. The treated T cell populations may differ in viability and CAR potency depending on the transfection method, but both are able to generate functional CAR T cells to induce targeted cancer cell killing.
Figure 2.
Figure 2.
Subsequent screens of libraries A and B for luciferase mRNA delivery and toxicity in a T cell line (Jurkat) establish trends in excipient molar ratio and delivery. (A) Luciferase expression in Jurkat cells after treatment with LNP libraries and the initial formulation (S2) for 48 h at a dose of 30 ng/60 000 cells identifies formulations that achieve higher functional mRNA delivery than S2 (dashed line) and indicates that library B LNPs resulted in increased luciferase activity compared to library A. Results were normalized to cells treated with S2 and compared in a one-way ANOVA with post hoc t tests using Holm’s correction. *p < 0.05, **p < 0.01 compared to S2, n = 3 biological replicates, error bars = standard deviation. Inset schematic demonstrates the progression of library design from total potential design space with decreasing formulations in each library. (B) Viability of Jurkat cells treated with LNP libraries and S2 at 30 ng/60 000 cells for 48 h identifies formulations with increased cytotoxicity compared to S2 and reveals that library B resulted in fewer toxic LNP formulations than library A. Results were normalized to untreated cells (dashed line) and compared in a one-way ANOVA with post hoc t tests using Holm’s correction. *p < 0.05 compared to S2, n = 3 biological replicates, error bars = standard deviation. (C) To observe the effects of individual excipient ratios on mRNA delivery, each data point represents the average relative luminescence of the four LNP formulations with the given excipient molar ratio. The trends indicate that increased C14–4 and DOPE may improve delivery while moderate ratios of cholesterol or high ratios of PEG may be detrimental. error bars = standard error of the mean. (D) To observe the effects of two excipient ratios on mRNA delivery, each data point represents the average relative luminescence of two LNP formulations with the given excipient molar ratio with either the higher or lower molar ratios of the second excipient. The trends indicate that higher ratios of C14–4 and DOPE may enhance delivery when increased together while decreasing the cholesterol. Error bars = standard error of the mean.
Figure 3.
Figure 3.
Dose–response of top-performing LNPs from libraries A and B confirm enhanced mRNA delivery to a T cell line (Jurkat) over a standard LNP formulation and lipofectamine. (A) Luciferase expression and viability of Jurkat cells treated with S2, A16, or B10 LNPs for 48 h, confirming the relative performance of each formulation. Luminescence and viability were normalized to untreated cells and compared within each dose using a one-way ANOVA with post hoc t tests using Holm’s correction. *p < 0.05, ***p < 0.001 as compared to S2, n = 3 biological replicates, error bars = standard deviation. (B) Luciferase expression and viability of Jurkat cells treated with B10 LNPs or lipofectamine for 48 h showing the ability of B10 LNPs to achieve increased mRNA delivery with no increase in cytotoxicity. Luminescence and viability were normalized to untreated cells, and the treatment groups were compared within each dose using a t test with post hoc t tests using Holm’s correction. **p < 0.01, n = 3 biological replicates, error bars = standard deviation.
Figure 4.
Figure 4.
Luciferase expression and viability of primary human T cells treated with S2, A16, or B10 LNPs for 24 h, confirming trends in LNP formulation performance. The bar graphs represent an average of 3 individual donors as normalized to untreated cells. To demonstrate the donor-to-donor variability, the average relative luminescence for each donor at each treatment and dose is represented as a shape. The effects of the three treatments were compared via a one-way ANOVA at each dose, but no significance was found. However, the results from each donor demonstrate the same trends observed previously with B10 resulting in the highest luminescence and S2 resulting in the lowest. n = 3 biological replicates (bar graphs), n = 3 technical replicates (points), error bars = standard deviation.
Figure 5.
Figure 5.
LNPs enable functional CAR mRNA delivery to primary human T cells with minimal toxicity compared to electroporation (EP). (A) Representative histogram of CAR expression (top) and average transfection rates (bottom) of primary human T cells 24 h after treatment with 300 ng of CAR mRNA per 60 000 cells using EP, S2 LNPs, or B10 LNPs. T cells were stained with a PE-labeled antibody to measure surface CAR expression with the histogram showing the mean fluorescent intensities associated with each treatment. The percent of transfection was determined as the fraction of living T cells expressing CAR. Results were compared via an ANOVA, which revealed no significant differences across the treatment groups. n = 3 biological replicates, error bars = standard deviation. (B) Representative flow cytometry data showing the CAR+ population of primary human T cells treated with EP, S2 LNPs, or B10 LNPs stained for CD8 (APC) and CD4 (FITC) surface expression. The boxes indicate the CD8+ and CD4+ T cell populations, and the percent of CAR+ T cells that fall into each population is noted. As the CAR expression is evenly split across CD8+ and CD4+ T cells for all three treatment groups, it seems the method of mRNA delivery did not impact this characteristic of the resulting CAR T cell population. (C) Viability of primary human T cells 24 h after treatment with 300 ng of CAR mRNA per 60 000 cells using EP, S2 LNPs, or B10 LNPs as compared to untreated cells. Results were compared in a one-way ANOVA with post hoc t tests using Holm’s correction. *p < 0.05 compared with EP, n = 3 biological replicates, error bars = standard deviation. (D) Representative results of CAR T and ALL cell coculture assay after 48 h at different T cell to tumor cell ratios. n = 3 wells, error bars = standard deviation. (E) Representative results of CAR T and ALL cell coculture assay comparing CAR T cells generated with lentivirus to those made with S2 or B10 LNPs. n = 4 technical replicates, error bars = standard deviation. The percent of cancer cell killing in both panels D and E was determined by comparison to ALL cells cultured without T cells as the negative control, and the results from each treatment group within each ratio were compared in a one-way ANOVA with no significance found.

References

    1. U.S. Food & Drug Administration. https://www.fda.gov/news-events/press-announcements/fda-approves-first-c... (accessed September 27, 2021).
    1. Bouchkouj N; Kasamon YL; Claro R. A. de; George B; Lin X; Lee S; Blumenthal GM; Bryan W; McKee AE; Pazdur R FDA Approval Summary: Axicabtagene Ciloleucel for Relapsed or Refractory Large B-Cell Lymphoma. Clin. Cancer Res. 2019, 25 (6), 1702–1708. - PubMed
    1. FDA. FDA Approves First Cell-Based Gene Therapy For Adult Patients with Relapsed or Refractory MCL. U.S. Food Drug Adm. 2020, 1.
    1. U.S. Food & Drug Administration. https://www.fda.gov/news-events/press-announcements/fda-approval-brings-... (accessed September 27, 2021).
    1. Li H; Huang Y; Jiang DQ; Cui LZ; He Z; Wang C; Zhang ZW; Zhu HL; Ding YM; Li LF; et al. Antitumor Activity of EGFR-Specific CAR T Cells against Non-Small-Cell Lung Cancer Cells in Vitro and in Mice. Cell Death Dis. 2018, 9 (2), 1–11. - PMC - PubMed

Publication types