

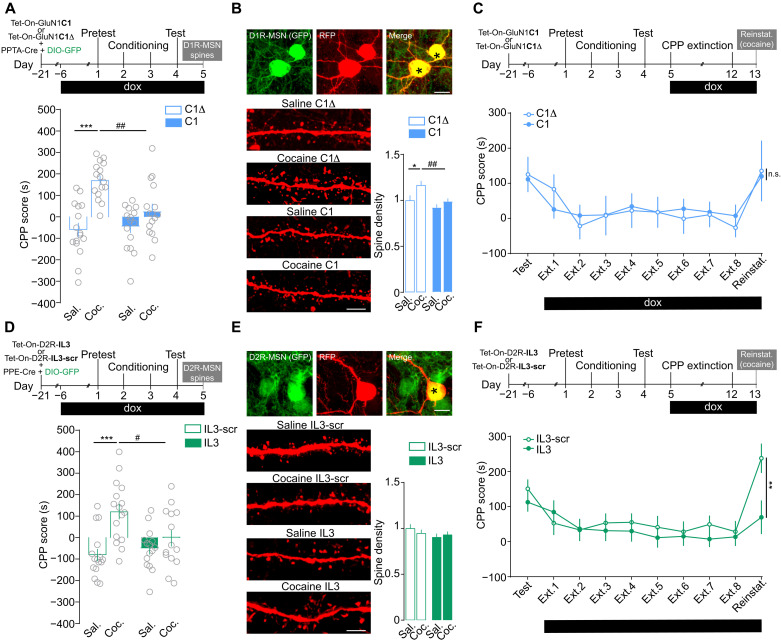
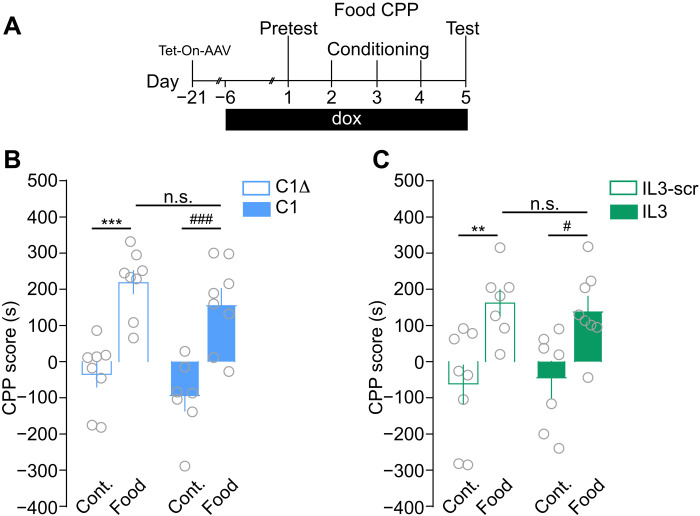
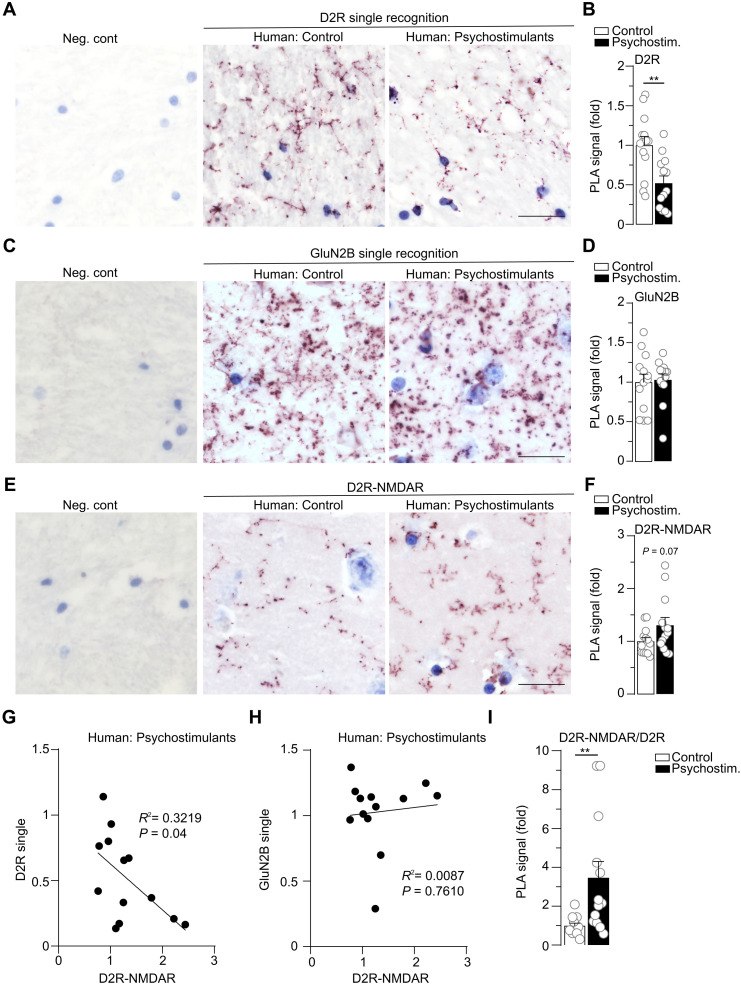
Disrupting D1-NMDA or D2-NMDA receptor heteromerization prevents cocaine's rewarding effects but preserves natural reward processing
- PMID: 34669474
- PMCID: PMC8528421
- DOI: 10.1126/sciadv.abg5970
Disrupting D1-NMDA or D2-NMDA receptor heteromerization prevents cocaine's rewarding effects but preserves natural reward processing
Abstract
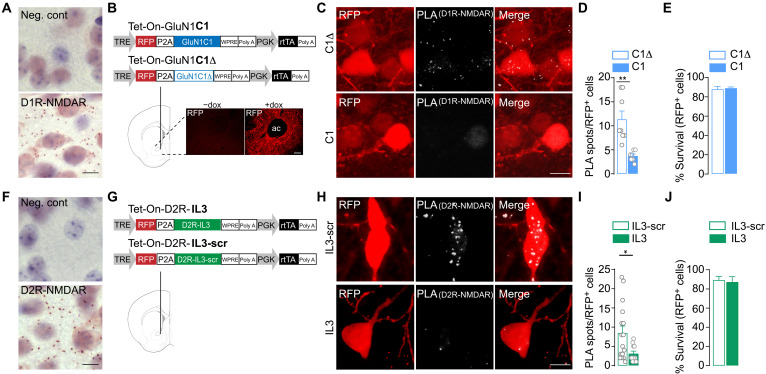
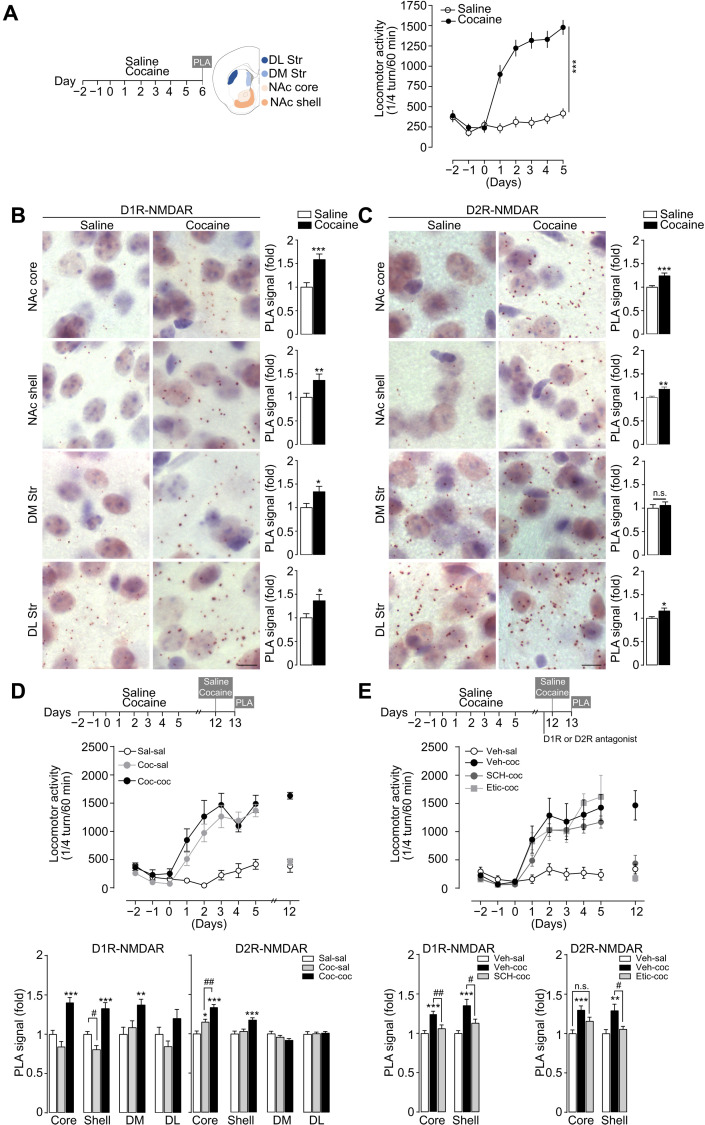
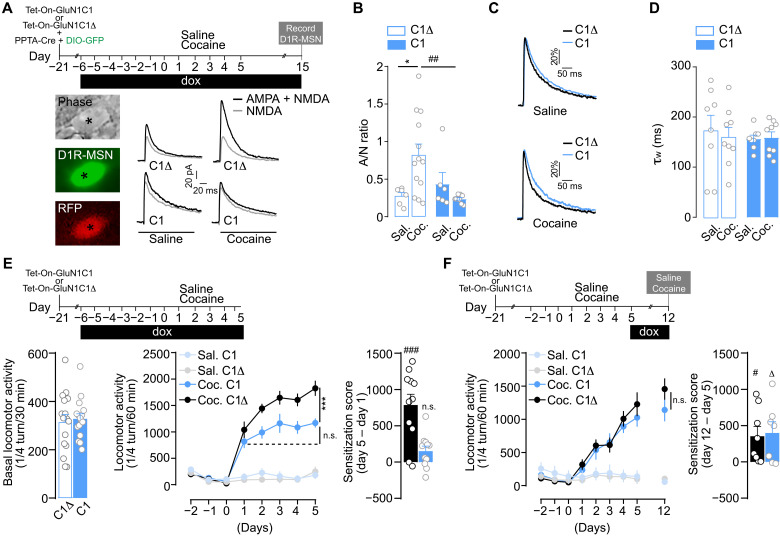
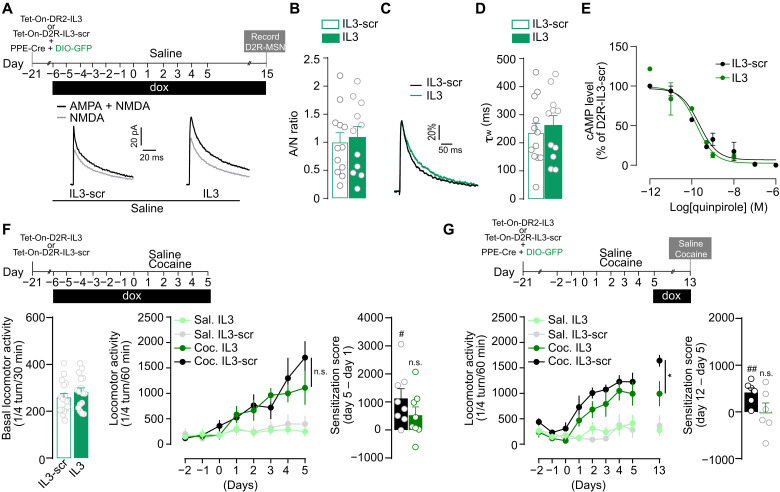
Addictive drugs increase dopamine in the nucleus accumbens (NAc), where it persistently shapes excitatory glutamate transmission and hijacks natural reward processing. Here, we provide evidence, from mice to humans, that an underlying mechanism relies on drug-evoked heteromerization of glutamate N-methyl-
Figures
References
-
- Salery M., Trifilieff P., Caboche J., Vanhoutte P., From signaling molecules to circuits and behaviors: Cell-type-specific adaptations to psychostimulant exposure in the striatum. Biol. Psychiatry 87, 944–953 (2020). - PubMed
-
- Volkow N. D., Morales M., The brain on drugs: From reward to addiction. Cell 162, 712–725 (2015). - PubMed
-
- Hyman S. E., Malenka R. C., Nestler E. J., Neural mechanisms of addiction: The role of reward-related learning and memory. Annu. Rev. Neurosci. 29, 565–598 (2006). - PubMed
Grants and funding
LinkOut - more resources
Full Text Sources
