. 2021 Oct 22;7(43):eabi9654.
doi: 10.1126/sciadv.abi9654. Epub 2021 Oct 20.

Disrupted circadian oscillations in type 2 diabetes are linked to altered rhythmic mitochondrial metabolism in skeletal muscle

Affiliations

Disrupted circadian oscillations in type 2 diabetes are linked to altered rhythmic mitochondrial metabolism in skeletal muscle

Brendan M Gabriel et al. Sci Adv. .

Abstract

Circadian rhythms are generated by an autoregulatory feedback loop of transcriptional activators and repressors. Circadian rhythm disruption contributes to type 2 diabetes (T2D) pathogenesis. We elucidated whether altered circadian rhythmicity of clock genes is associated with metabolic dysfunction in T2D. Transcriptional cycling of core-clock genes BMAL1, CLOCK, and PER3 was altered in skeletal muscle from individuals with T2D, and this was coupled with reduced number and amplitude of cycling genes and disturbed circadian oxygen consumption. Inner mitochondria–associated genes were enriched for rhythmic peaks in normal glucose tolerance, but not T2D, and positively correlated with insulin sensitivity. Chromatin immunoprecipitation sequencing identified CLOCK and BMAL1 binding to inner-mitochondrial genes associated with insulin sensitivity, implicating regulation by the core clock. Inner-mitochondria disruption altered core-clock gene expression and free-radical production, phenomena that were restored by resveratrol treatment. We identify bidirectional communication between mitochondrial function and rhythmic gene expression, processes that are disturbed in diabetes.


Figures
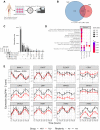
Fig. 1.
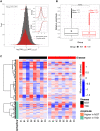
Fig. 1.. Intrinsically dysregulated circadian rhythm of gene expression in T2D.
(A) Schematic overview of primary cell culture circadian experiment and RNA sequencing. RNA sequencing of primary human skeletal muscle cells from men with NGT (n = 7) or T2D (n = 5). (B) Venn diagram showing the overlapping rhythmic genes between NGT and T2D. Overlapping rhythmic genes were significantly enriched (Fisher’s exact test, P = 1.74 × 10−60; odds ratio, OR = 2.56, background = 18,482). (C) Upset plot showing number of circadian genes identified via RAIN analysis for each disease and treatment comparison (FDR < 0.10). (D) Circadian gene enrichment results using ORA (Fisher’s exact test) and Reactome pathways. Circadian genes identified via RAIN analysis (FDR < 0.10), and the top 10 enriched Reactome pathways are shown (FDR < 0.10). (E) Circadian rhythmicity of core clock genes. Red = T2D, black = NGT. Lines show the harmonic regression fits and solid line indicates circadian (FDR < 0.10) genes, while dashed lines indicate noncircadian genes. Time points are hours after synchronization.
Fig. 2.
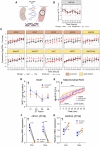
Fig. 2.. Reduced amplitudes of overall rhythmic gene expression in T2D.
(A) Log2 relative amplitude of circadian genes for T2D as compared to NGT; relative amplitudes were determined via harmonic regression with first-degree polynomial trend using mean-centered data. Histogram of circadian genes (red) and all genes (black), log2 relative amplitude of T2D versus NGT. The main panel shows count histogram of log2 relative amplitudes of circadian genes (red) and noncircadian genes (black). Right panels show the density distributions and empirical cumulative distribution function. Red = circadian, determined via RAIN algorithm (FDR < 0.1), black = noncircadian. Log2 relative amplitude distributions were significantly different in circadian genes compared to noncircadian genes (PKS < 2.2 × 10⁻¹⁶, two-sided Kolmogorov-Smirnov test). μ = population mean. (B) Boxplots showing the relative amplitude comparison between NGT and T2D groups for the union of circadian genes. Means and medians are reported for each group in the plot. Black: NGT, red: T2D groups. The difference between the relative amplitudes are calculated using Wilcoxon rank sum test (****P < 2.2 × 10⁻¹⁶). (C) Heatmaps showing the amplitude differences of RNA-sequencing gene expression data of NGT and T2D groups. The linear trends are removed for visual purposes to highlight the patterns in data (see Materials and Methods). To show the amplitude differences between NGT and T2D, the data were mean-centered for the groups. Each time point shown in the heatmap is the average value after mean-centering. Hierarchical clustering was performed by using geodesic distance and “ward.D2” algorithm separately for higher amplitude clusters in NGT and T2D groups.
Fig. 3.
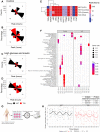
Fig. 3.. Altered peak-time signature of cycling inner-mitochondrial genes and ablated rhythmic mitochondrial metabolism in myotubes from T2D donors.
(A) Number of circadian genes at each peak time for control treatments. (B) Percentage of circadian genes at each peak time for control treatments. (C) Number of circadian genes at each peak time when treated with high concentrations of glucose and insulin. (D) Percentage of circadian genes at each peak time when treated with high concentrations of glucose and insulin. (E) Heatmap showing the peak times of core clock genes for control conditions and cells treated with high concentrations of glucose and insulin. Colors represent the peak times. Hierarchical clustering was performed by using geodesic distance and “ward.D2” algorithm. Asterisks represent the adjusted P values from rhythmicity analysis (RAIN): ***0 ≤ P ≤ 0.001; **0.001 < P ≤ 0.01; *0.01 < P ≤ 0.05; · 0.05 < P ≤ 0.1; empty boxes, 0.1 < P ≤ 1. (F) GO:CC enriched at each time point in NGT (control), T2D (control), NGT (high concentration of glucose and insulin), and T2D (high concentration of glucose and insulin). (G) Schematic of circadian basal cellular oxygen consumption rate (OCR) time-course experiment. (H) Relative OCR of synchronized myotube cultures from donors with NGT (black) versus T2D (red), as measured by Seahorse XF Analyzer (Agilent) for n = 5 donors in each group. Differential rhythmicity (DODR, period = 16 hours) and rhythmicity (RAIN) analysis statistics are shown in table inset. See also fig. S4. Lines show the harmonic regression fits, and solid line indicates rhythmic (FDRRAIN < 0.1) OCR, while dashed lines indicate nonrhythmic OCR (RAIN analysis). The harmonic regression line in the figure is for illustration purposes only and was not used in the statistical analysis. a.u., arbitrary units.
Fig. 4.
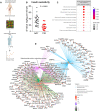
Fig. 4.. Mitochondrial inner membrane is enriched for genes that correlate with whole-body insulin sensitivity.
(A) Schematic of experimental design. (B) Insulin sensitivity (M value: mg glucose infused/kg per minute) of T2D and NGT participants. Student’s t test. (C) Enrichment analysis based on microarray of skeletal muscle biopsies obtained in the fasted state from 24 men with NGT and 25 men with T2D. Top 10 differentially enriched GO:CC, ranked by gene ratios (FDR < 0.10). Pathway enrichment calculated from genes correlating (FDR < 0.10) with M value (whole-body insulin sensitivity) in vivo. (D) GO term–gene interaction plot of the top five GO:CC enrichments calculated from genes correlating (FDR < 0.1) M value (whole-body insulin sensitivity) in vivo: organelle inner membrane, mitochondrial inner membrane, mitochondrial protein complex, mitochondrial matrix, and oxidoreductase complex. Node colors for each gene represent the Spearman correlation coefficient (ρ).
Fig. 5.
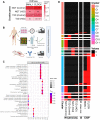
Fig. 5.. Mitochondrial pathways are enriched for genes with Clock and Bmal1 binding and are associated with whole-body insulin sensitivity.
(A) Enrichment analysis between circadian genes and ChIP-sequencing peaks. The association between circadian genes in each disease-treatment group and BMAL1/CLOCK bound genes were tested using Fisher’s exact test, and P values are adjusted for multiple testing with the Benjamini-Hochberg method. Columns: BMAL1/CLOCK ChIP-sequencing experiments; rows: rhythmic genes in NGT and T2D for both control conditions and high concentration of glucose and insulin treatment groups; numbers: adjusted P values (ns: not significant); colors: Jaccard similarity index indicating the percentage of genes overlapping in each dataset. (B) Schematic of experimental design used for the integrative analysis. (C) Gene enrichment analysis using ORA (Fisher’s exact test) with the top 10 GO:CC was performed (FDR < 0.10) for each cluster identified in (B). (D) Heatmap showing the clusters from the integrative analysis. Binary data used for clustering with “clust” algorithm (67) and resulted in 12 clusters. Columns “NGT (Control),” “T2D (Control),” “NGT (high concentration of glucose and insulin),” and “T2D (high concentration of glucose and insulin)” represent circadian (black) and noncircadian (white) genes; “M value cor” shows whether a significant (black) correlation between the insulin sensitivity metric (M value) and basal gene expression; “BMAL1” and “CLOCK” show whether a ChIP-sequencing peak for the given protein was detected (black) or not (white).
Fig. 6.
Fig. 6.. Pharmacological, genetic, and siRNA-mediated disruption of inner-mitochondrial metabolism results in altered clock-gene expression.
(A) mRNA expression of molecular clock–associated gene DBP in myotubes from NGT donors (n = 4–6 donors). One-way analysis of variance (ANOVA), *P < 0.05 compared to vehicle control (Con.). (B) mRNA expression of molecular clock–associated gene NR1D1 in myotubes from NGT donors (n = 4 to 6 donors). One-way ANOVA, *P < 0.05 compared to vehicle control (Con.). (C) OPA1 and Clock gene expression (Bmal1, Clock, Nr1d1, Per2, and Per3) from skeletal muscle-specific Opa1 knockout (Opa1 mKO) mice (n = 8) relative to control (n = 7). Black = Opa1 mKO Opa1 gene expression, purple = core-clock–associated gene expression one-way ANOVA, ***P < 0.001, *P < 0.05. (D) OPA1 mRNA expression and protein abundance (inset) over the time-course experiment after synchronization in primary human skeletal muscle cells treated with siRNA targeting OPA1 (siOPA1) (n = 6) compared to Scramble siRNA (n = 6). (E to H) Primary human skeletal muscle cells treated with siOPA1 (n = 6). Molecular-clock genes BMAL1 (E), NPAS2 (F), PER2 (G), and PER3 (H). †P < 0.05 overall difference siOPA1 versus Scramble. ****P < 0.0001, *P < 0.05 siOPA1 versus Scramble at time point (two-way ANOVA). Genes are shown in synchronized cells and presented at each ZT after serum shock. (I) Protein abundance of electron transport complexes. Orange, siOPA1 (n = 4–6 donors). One-way ANOVA, † = overall effect of siOPA1 (P < 0.05), *P < 0.05 effect of siOPA1.
Fig. 7.
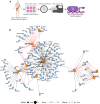
Fig. 7.. TF-gene interaction network analysis reveals divergent circadian TF enrichment of NPAS2 and RELA between T2D and NGT.
(A) Schematic overview of primary cell culture circadian experiment and RNA sequencing. RNA sequencing of primary human skeletal muscle cells (myotubes) from men with NGT (n = 7) or T2D (n = 5). These data were used for the TF-gene network analysis. (B) The human TF-gene interactions were retrieved from TRRUST database version 2. Genes interacting with each TF were checked for enrichment with rhythmicity using Fisher’s exact test (FDR < 0.10). Large orange dots: TFs; small blue open circles: genes. Black and red lines represent the TF-gene interactions with rhythmic genes for myotubes from NGT and T2D donors, respectively.
Fig. 8.
Fig. 8.. siRNA depletion of OPA1 increases mitochondrial ROS, and OPA1-mediated changes in clock-gene expression can be restored by resveratrol.
(A) Circadian rhythms, transcription factor activity, and circadian inner-mitochondrial membrane metabolism are disrupted in T2D. Changes in NAD+/NADH metabolism and ROS signaling constitute a feedback loop permitting bidirectional control of circadian metabolism. (B) Time course of HIF1α mRNA in synchronized myotubes from donors with NGT (n = 7) or T2D (n = 5). Lines show harmonic regression fits, the solid line indicates circadian (FDRRAIN < 0.1) genes, and dashed lines indicate non-circadian genes. (C) mRNA expression of antioxidant enzymes, and those linked to NAD+/NADH metabolism that localize to mitochondria in myotube cultures as described in (B). (D) NAD+ concentration in synchronized myotubes from NGT donors (n = 6) treated with siRNA against a scrambled sequence (blue) or OPA1 (orange), two-way ANOVA, †overall time effect, *P < 0.05 difference between time points (12 versus 20 hours, and 28 versus 36 hours) only in Scramble. (E) Live-cell microscopy measuring MitoSOX fluorescence, indicative of mitochondrial ROS in myotube cultures as described in (D). Mixed-effects analysis, †P < 0.05 overall difference between conditions, ***P < 0.0001 difference between siOPA1 versus siOPA1-resv, Scramble versus siOPA1, and Scramble versus siOPA1-resv. (F) OPA1 and (G) NPAS2 mRNA assessed at ZT28 in synchronized myotubes from NGT donors (n = 4) treated with siRNA against a scrambled sequence (blue) or OPA1 (orange). Cells were incubated in the absence (vehicle control) or presence of 10 μM resveratrol. Relative to Scramble siRNA at ZT28. Two-way ANOVA, †P < 0.05 overall effect siRNA (Scramble versus siOPA1), **P < 0.01 control-Scramble versus control-treated siOPA1. ***P < 0.001 siOPA1 versus Scramble. Results are mean ± SEM.

References

    1. Mokhlesi B., Temple K. A., Tjaden A. H., Edelstein S. L., Utzschneider K. M., Nadeau K. J., Hannon T. S., Sam S., Barengolts E., Manchanda S., Ehrmann D. A., Van Cauter E.; Rise Consortium , Association of self-reported sleep and circadian measures with glycemia in adults with prediabetes or recently diagnosed untreated type 2 diabetes. Diabetes Care 42, 1326–1332 (2019). - PMC - PubMed
    1. Vetter C., Dashti H. S., Lane J. M., Anderson S. G., Schernhammer E. S., Rutter M. K., Saxena R., Scheer F. A. J. L., Night shift work, genetic risk, and type 2 diabetes in the UK biobank. Diabetes Care 41, 762–769 (2018). - PMC - PubMed
    1. Shan Z., Li Y., Zong G., Guo Y., Li J., Manson J. E., Hu F. B., Willett W. C., Schernhammer E. S., Bhupathiraju S. N., Rotating night shift work and adherence to unhealthy lifestyle in predicting risk of type 2 diabetes: Results from two large US cohorts of female nurses. BMJ 363, k4641 (2018). - PMC - PubMed
    1. Tan X., Chapman C. D., Cedernaes J., Benedict C., Association between long sleep duration and increased risk of obesity and type 2 diabetes: A review of possible mechanisms. Sleep Med. Rev. 40, 127–134 (2018). - PubMed
    1. Takahashi J. S., Molecular components of the circadian clock in mammals. Diabetes Obes. Metab. 17 ( Suppl 1), 6–11 (2015). - PMC - PubMed