. 2022 Jan 26;96(2):e0106321.
doi: 10.1128/JVI.01063-21. Epub 2021 Oct 20.

Functional Effects of Cardiomyocyte Injury in COVID-19

Affiliations

Functional Effects of Cardiomyocyte Injury in COVID-19

Mustafa M Siddiq et al. J Virol. .

Abstract

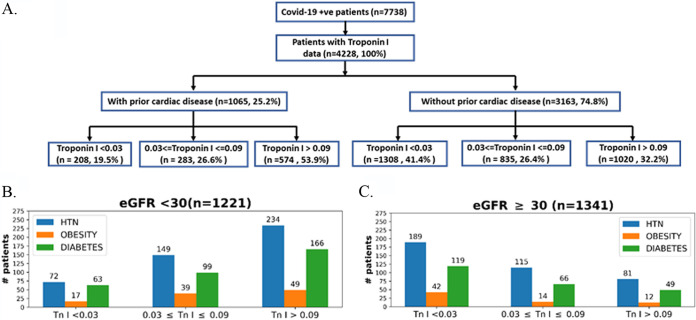
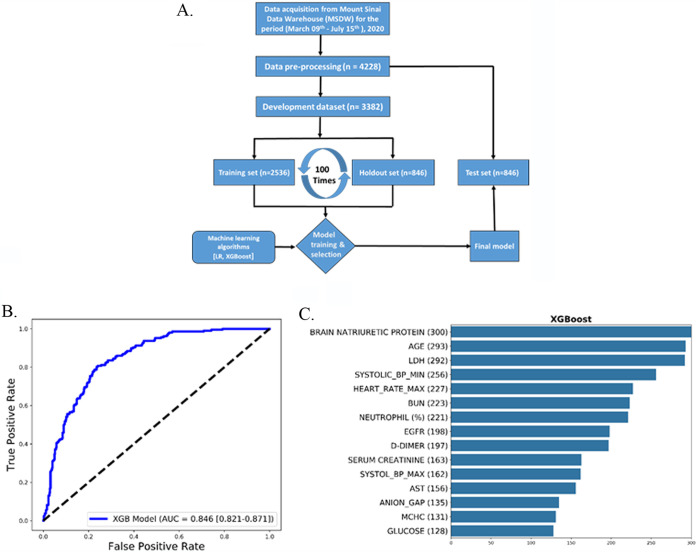
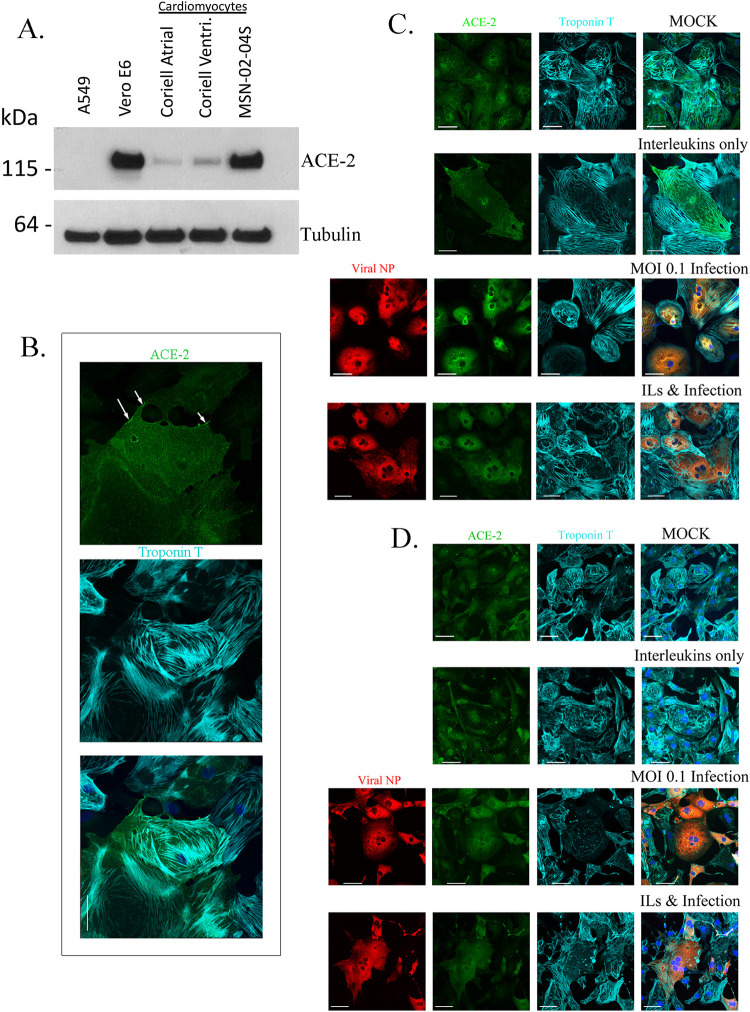
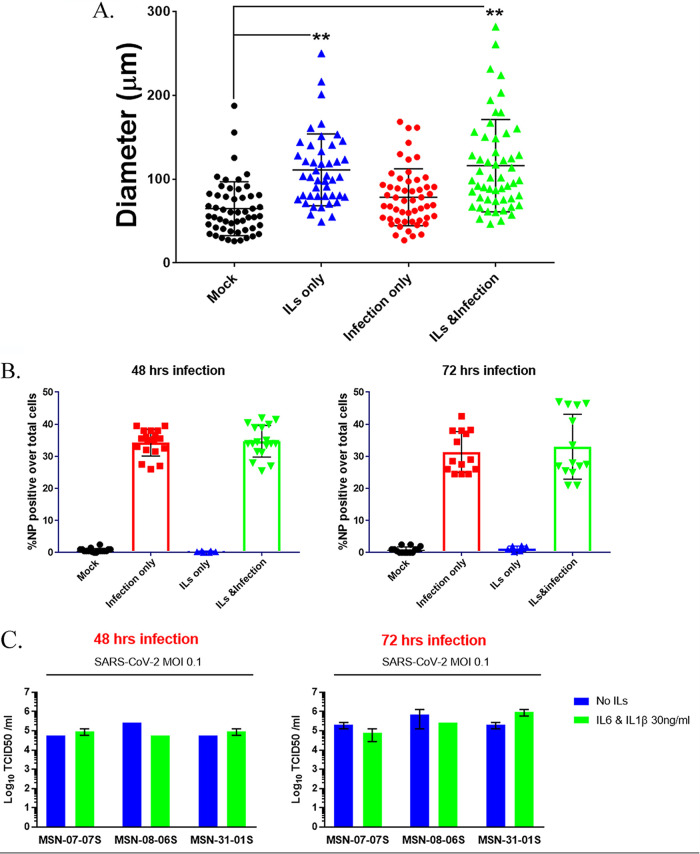
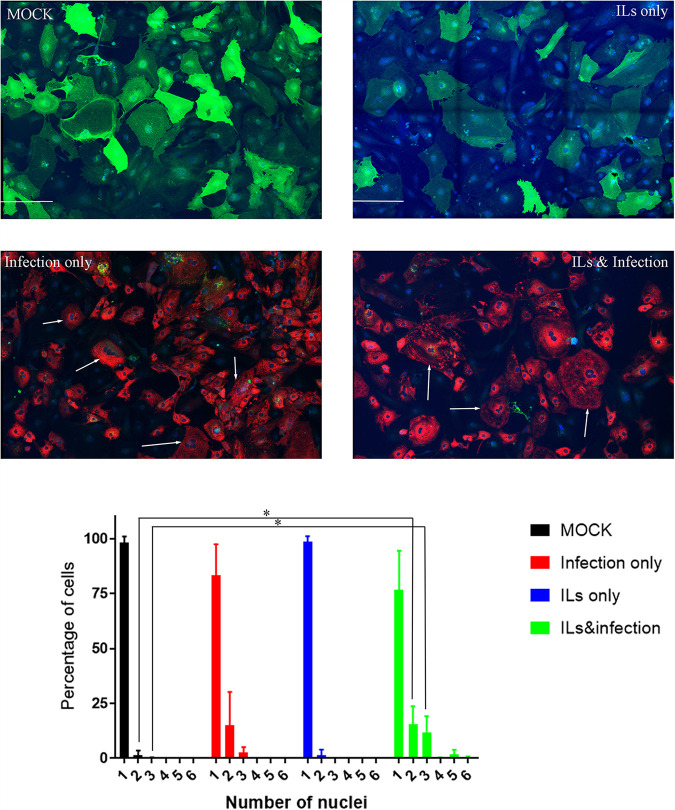
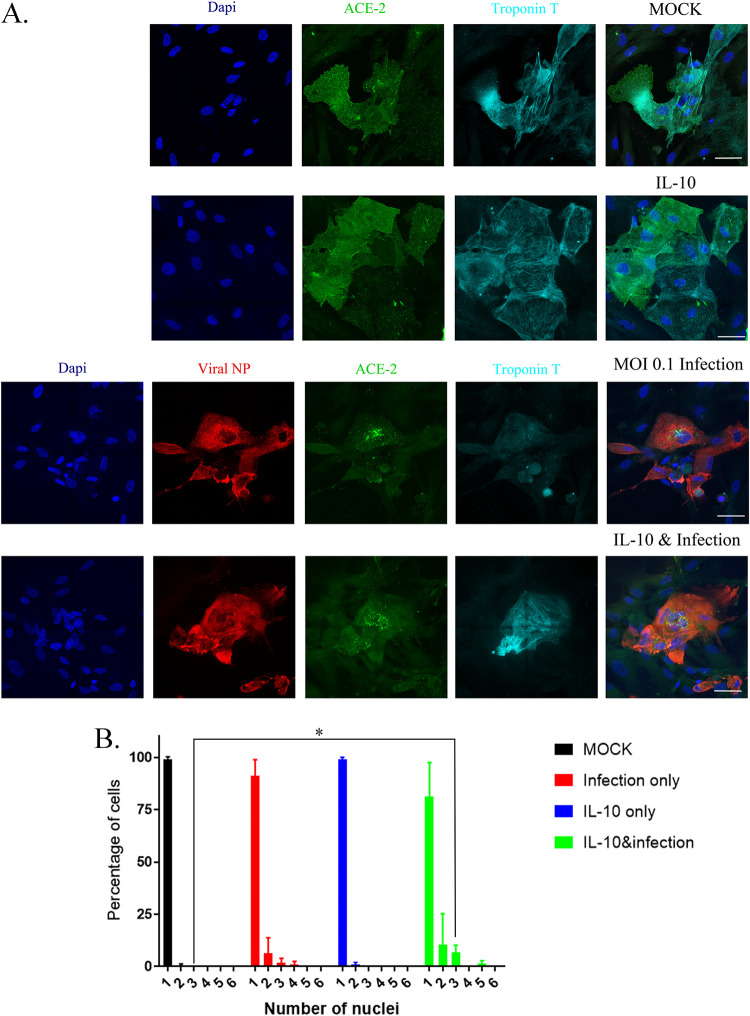
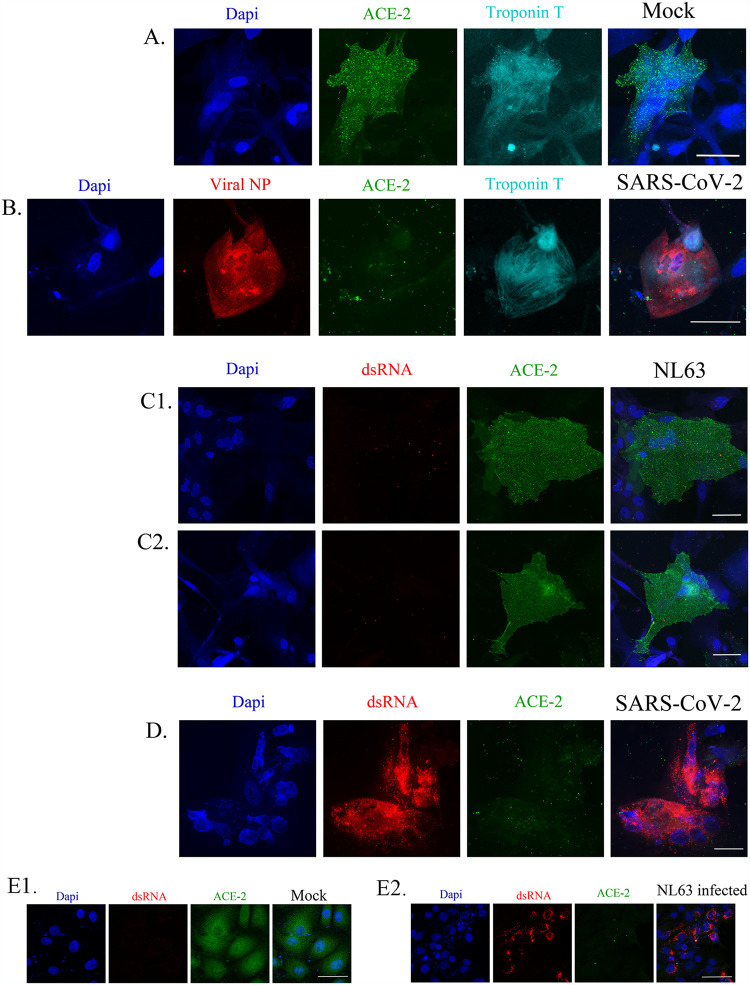
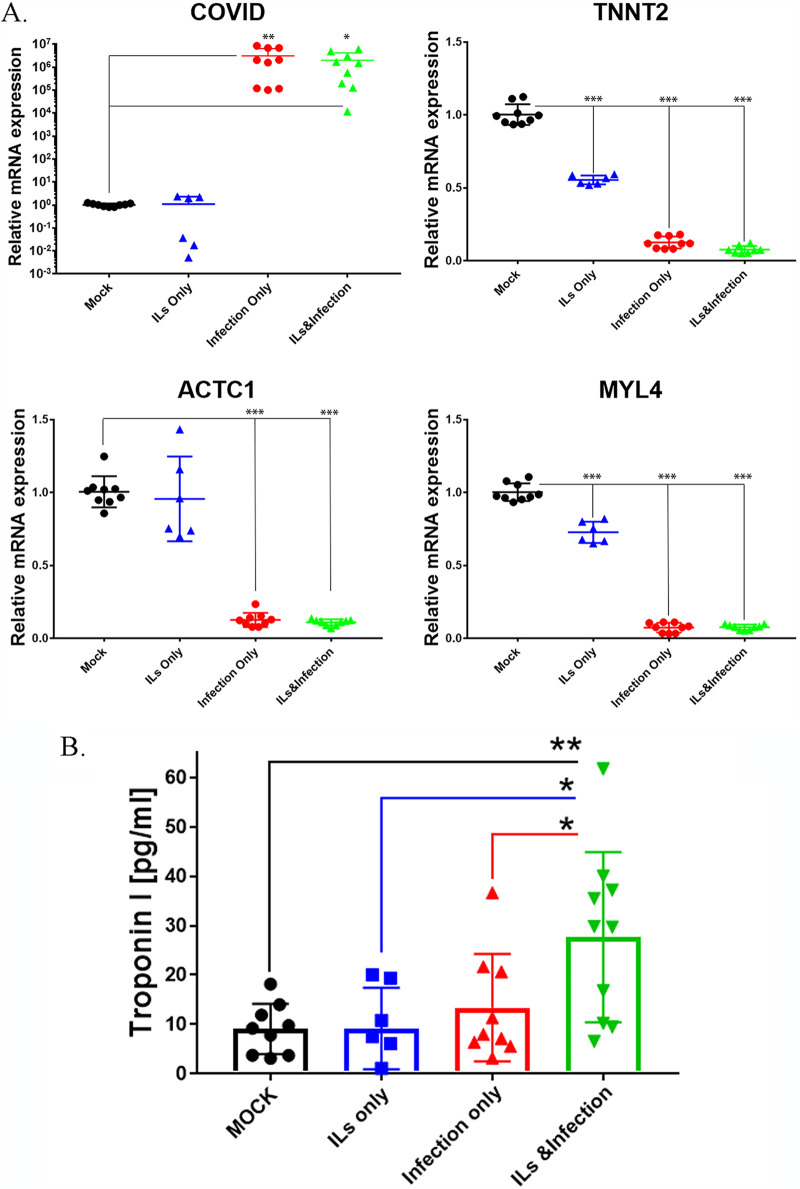
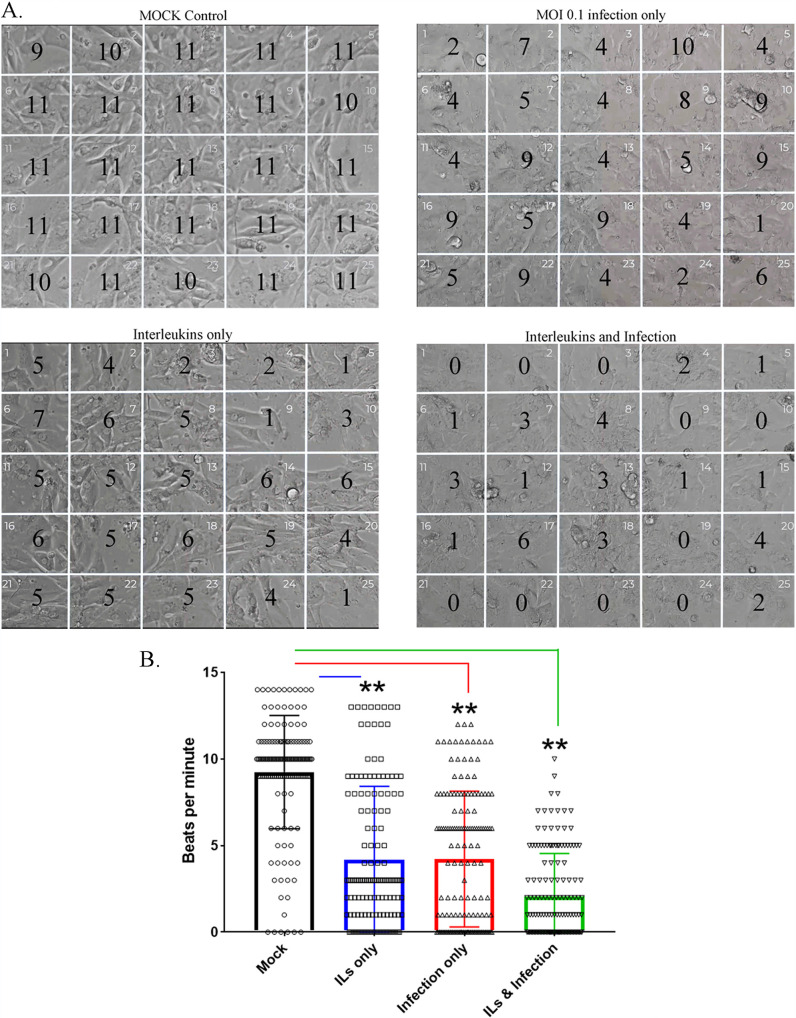
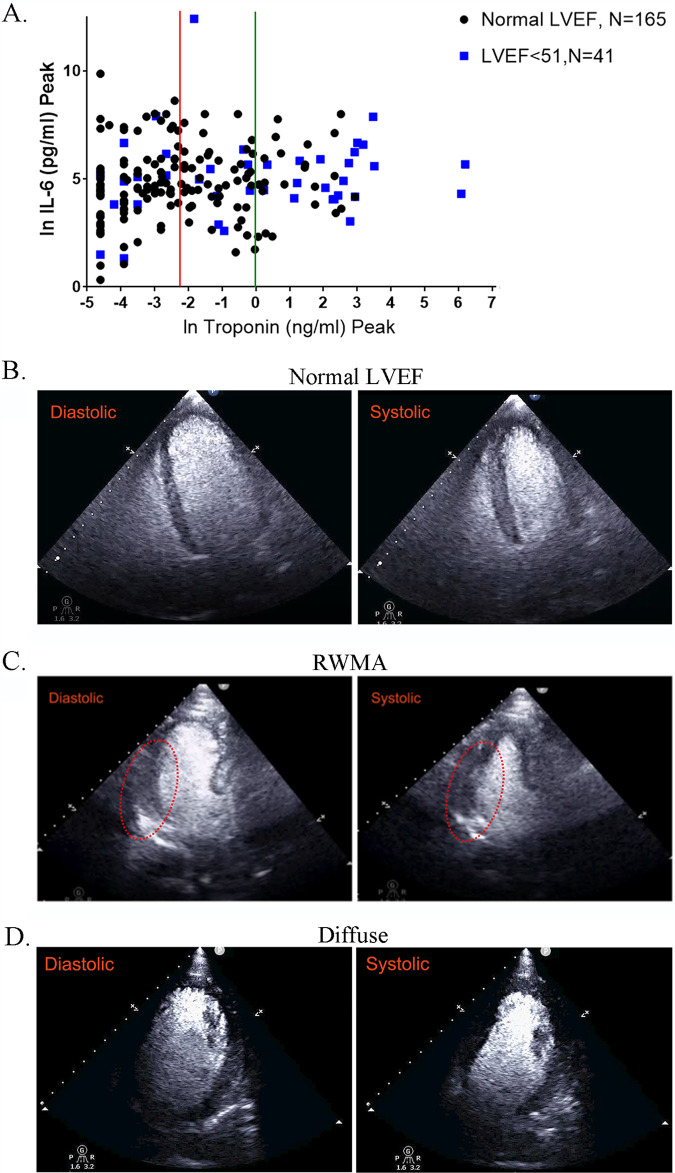
COVID-19 affects multiple organs. Clinical data from the Mount Sinai Health System show that substantial numbers of COVID-19 patients without prior heart disease develop cardiac dysfunction. How COVID-19 patients develop cardiac disease is not known. We integrated cell biological and physiological analyses of human cardiomyocytes differentiated from human induced pluripotent stem cells (hiPSCs) infected with severe acute respiratory syndrome coronavirus 2 (SARS-CoV-2) in the presence of interleukins (ILs) with clinical findings related to laboratory values in COVID-19 patients to identify plausible mechanisms of cardiac disease in COVID-19 patients. We infected hiPSC-derived cardiomyocytes from healthy human subjects with SARS-CoV-2 in the absence and presence of IL-6 and IL-1β. Infection resulted in increased numbers of multinucleated cells. Interleukin treatment and infection resulted in disorganization of myofibrils, extracellular release of troponin I, and reduced and erratic beating. Infection resulted in decreased expression of mRNA encoding key proteins of the cardiomyocyte contractile apparatus. Although interleukins did not increase the extent of infection, they increased the contractile dysfunction associated with viral infection of cardiomyocytes, resulting in cessation of beating. Clinical data from hospitalized patients from the Mount Sinai Health System show that a significant portion of COVID-19 patients without history of heart disease have elevated troponin and interleukin levels. A substantial subset of these patients showed reduced left ventricular function by echocardiography. Our laboratory observations, combined with the clinical data, indicate that direct effects on cardiomyocytes by interleukins and SARS-CoV-2 infection might underlie heart disease in COVID-19 patients. IMPORTANCE SARS-CoV-2 infects multiple organs, including the heart. Analyses of hospitalized patients show that a substantial number without prior indication of heart disease or comorbidities show significant injury to heart tissue, assessed by increased levels of troponin in blood. We studied the cell biological and physiological effects of virus infection of healthy human iPSC-derived cardiomyocytes in culture. Virus infection with interleukins disorganizes myofibrils, increases cell size and the numbers of multinucleated cells, and suppresses the expression of proteins of the contractile apparatus. Viral infection of cardiomyocytes in culture triggers release of troponin similar to elevation in levels of COVID-19 patients with heart disease. Viral infection in the presence of interleukins slows down and desynchronizes the beating of cardiomyocytes in culture. The cell-level physiological changes are similar to decreases in left ventricular ejection seen in imaging of patients' hearts. These observations suggest that direct injury to heart tissue by virus can be one underlying cause of heart disease in COVID-19.

Keywords: COVID-19; IL-10; IL-1β; IL-6; NL63; SARS-CoV-2; cardiac disease; cardiomyocytes; computational biology; machine learning.


Figures

FIG 1
FIG 1
COVID-19 patients without history of cardiac disease have elevated troponin I levels and other clinical characteristics associated with cardiac dysfunction. Shown are clinical data from COVID-19-positive patients (with encounter data, labs, and vital signs; n = 7,738) downloaded from the Mount Sinai Data Warehouse on 15 July 2020. (A) Flowchart for COVID-19 patients for whom troponin I measurements were available (n = 4,228). These patients were further divided into patients with and without prior cardiac disease. Patients having one or more of the three comorbidities or a history of (i) coronary artery disease, (ii) atrial fibrillation, or (iii) heart failure were binned as “with prior cardiac disease.” Each category was further divided into subgroups with respect to troponin levels using standard clinical cutoffs. A total of 32.2% (1,020/3,163) of COVID-19 patients without a history of heart disease have clinically significant elevated levels (>0.09 ng/mL) of troponin I. Patients without prior cardiac disease were classified with respect to kidney function using eGFR values of <30 (B) or ≥30 (C) and binned for comorbidities (hypertension [HTN], obesity, or diabetes) in the three cohorts with different troponin I levels.
FIG 2
FIG 2
Predictive machine learning models to identify clinical features that predict elevated levels of troponin I. (A) We developed predictive machine learning models to identify clinical features that predict elevated levels of troponin I. The workflow for model development is shown in panel A. After preprocessing, data for patients with COVID-19 with troponin I data (n = 4,228) were randomly divided in an 80:20 ratio into a prediction model development data set (n = 3,382) and an independent retrospective validation data set (test data set; n = 846). For prediction model training and selection, the development data set was further randomly split into a 75% training data set (n = 2,536) and a 25% holdout data set (n = 846). We ran an imputation model on the training set to obtain an optimum missing value imputation cutoff, which is 35% for this model (Fig. S1). We used a recursive feature elimination method to obtain the optimum number of features to reach a plateau (Fig. S2). We tested two classification algorithms, and the XGBoost (eXtreme Gradient Boosting) classification algorithm performed better than logistic regression (Fig. S3). The final predictive model was validated on the test data set (n = 846). (B) Evaluation results for the test set are shown in terms of the ROC curves obtained, as well as their AUC scores, with the 95% confidence interval in parentheses. (C) The top 15 predictive features identified using the recursive feature elimination method for XGBoost classification algorithms across the three independent sets of 100 runs used to select the most discriminative features and train the corresponding candidate prediction models. The values in parentheses indicate the number of times the feature was selected as top ranked in the development data set.
FIG 3
FIG 3
Characterization of hiPSC-derived ventricular cardiomyocytes infected by SARS-CoV-2. hiPSC cells reprogrammed from skin fibroblasts of healthy subjects were differentiated into beating ventricular cardiomyocytes (CMs) and after culture for 30 days were used in these experiments. (A) Expression of ACE 2 protein. By immunoblotting, the expression of ACE2 was identified in cardiomyocytes. For negative controls, we used A549 cells, which had no detectable levels of ACE2. Vero E6 cells are positive controls for ACE2 expression, as confirmed using R&D antibody AF933. Three different human iPSC-derived cardiomyocytes were tested: two were from the Coriell Institute for Medical Research (Actin2 EGFR D60 atrial and ventricular [Ventri.]), and one was from the LINCS Institute (MSN-02-04S). (B) Immunostaining of CMs for ACE2 (green) and troponin T (cyan). Although all cells express ACE2, we find only some cells express ACE2 on the plasma membrane, as indicated by the arrows (top panel). The CMs express troponin T (cyan), which is seen as ordered myofibrils (middle panel). The image is a z-stack of 8 slices that was made into a maximum-intensity projection. Overlay of the two stains is shown in the bottom panel. The scale bar in the composite image is 50 μm. (C and D) The top panels show mock-infected cardiomyocytes express ACE2 and troponin T. Nuclei are stained by Hoechst stain. The level 2 panels show that CMs treated with 30 ng/ml each of IL-6 and IL-1β express ACE2, the cells appear larger, and the troponin T appears more disorganized. The level 3 panels show CMs can be infected with SARS-CoV-2 at an MOI of 0.1, as detected by positive immunostaining for viral NP (red). All infected cells were positive for ACE2, with some cells having notable amounts of troponin T disruption. The level 4 panels show that cells infected with SARS-CoV-2 in the presence of ILs also show increase in cell diameter and disruption in troponin T organization. The scale bar in the composite image is 50 μm. Panel C shows CM line MSN31-01S. Panel D shows CM line MSN08-06S in a repeat of the experiment shown in panel C, and the cells shown are the CMs beating in Movie S1 at https://iyengarlab.org.
FIG 4
FIG 4
IL-6 and IL-1β can increase cell diameter but do not affect infectivity of SARS-CoV-2. (A) The changes in cell diameter with IL treatment and/or infection were measured using ImageJ. Cell diameters for two different CM lines were measured and plotted. We observe a statistically significant increase in cell size with infection but a larger increase in cell diameter with ILs only or ILs and infection with SARS-CoV-2. Statistical significance was determined by one-way ANOVA with Bonferroni multiple-comparison test: *, P < 0.05; **, P < 0.01. (B) We counted the numbers of cells stained by NP protein antibody as a measure of infectivity. Each point is representative of one well of a 96-well plate with 10,000 CM cells. The bar graph is the average of four different CM lines measuring viral NP protein-positive cells over the total number of cells. Counting was done in an automated fashion using the IN Cell Analyzer. ILs do not increase the percentage of CM cells infected by SARS-CoV-2. (C) To confirm that CMs were being productively infected and shedding SARS-CoV-2 into the culture medium, we collected supernatants from 3 different CM lines 48 and 72 h postinfection, with or without ILs, and performed a TCID50 plaque assay. We observed that the CM lines were infected, and the level of infection, as assessed by virus release into culture medium, did not increase with the addition of IL-6 and IL-1β.
FIG 5
FIG 5
SARS-CoV-2 infection increases the percentage of multinucleated cells. Cells of CM line MSN-31-01S were treated with ILs and/or infected with SARS-CoV-2 at an MOI of 0.1 for 48 h. Shown is immunostaining of CMs for ACE2 (green), NP (red), and nuclear stain (blue). Mock-infected cells express ACE2 and predominantly have a single nucleus, but some double nuclei are detected. ILs did not alter the count of nuclei in these CM cells. Infection with SARS-CoV-2 at an MOI of 0.1 for 48 h does diminish the amount of ACE2 staining, and several cells are detected with 3 nuclei, as noted by the white arrows. Cells exposed to ILs and infection have an increase in the number of nuclei, where 3 to 5 nuclei are pointed out by the white arrows. The graph is the average number of nuclei counted between 3 independent experiments. Statistical significance was determined by unpaired t test, and a result was significant at P < 0.05 (*) comparing control to IL treatment and SARS-CoV-2 infection for 2 and 3 nuclei per cell. The scale bar in each image is 200 μm.
FIG 6
FIG 6
IL-10 does not increase cell diameter of CM cells, but it does increase the number of multinucleated cells. (A) We tested three different CM lines; results from CM line MSN31-01S are shown. We treated the cells with 30 ng/mL IL-10 and then infected them with SARS-CoV-2 at an MOI of 0.1 for 48 h. Mock-infected cells express both troponin T (cyan) and ACE2 (green), and cells treated with IL-10 alone look similar to mock-infected cells. CM cells infected with SARS-CoV-2 have decreased detectable ACE2 and are infected, as detected by viral NP antibody staining in red. However, there is an increase in the number of multinucleated cells with infection only. Combining IL-10 and SARS-CoV-2 infection, we do not see a detectable change in cell size, but there is a consistent decrease in ACE2 expression, as well as a visible increase in multinucleated cells. (B) The number of multinucleated cells for each treatment is tabulated in the graph, and the numbers are the average from three different CM lines (MSN31-01S, MSN07-07S, and MSN12-04S). Statistical significance was determined by unpaired t test, and a result was significant at P < 0.05 (*) comparing control to IL-10 and SARS-CoV-2 infection for 3 nuclei per cell.
FIG 7
FIG 7
NL63, a seasonal coronavirus that can infect human cells, cannot infect cardiomyocyte cells. (A) We tested three different CM lines; results from CM line 12-4 are shown. CM cells do express ACE2 (green) and troponin T (cyan), as shown by the mock-infected cells. (B) CM cells can be infected with SARS-CoV-2 (red; viral NP antibody), as shown by the decrease in viral NP antibody and ACE2. (C1 and C2). In duplicate, we show NL63 infection at an MOI of 0.1 for 48 h. These cells express ACE2 but have no detectable infection when we look for dsRNA with an antibody (red). (D) The dsRNA antibody is working, as with SARS-CoV-2 infection, we see that this CM line is infected by dsRNA detection (red), and ACE2 levels are decreased in these cells. We also observe an increase in multinucleated cells (blue). (E) To confirm the lack of infection of NL63 in CM lines, we confirmed that the NL63 virus was active by infecting LLC-MK2 cells (E2), a cell type that expresses ACE2 and is known to be infected by coronaviruses. LLC-MK2 cells do express ACE2 (“Mock” in panel E1), and when we infect them with NL63 at an MOI of 0.1 (E2), ACE2 is diminished, and we detect dsRNA (red) by antibody staining. The scale bar is 50 μm.
FIG 8
FIG 8
SARS-CoV-2 disrupts the contractile mechanism of CM lines tested, as determined by RT-qPCR. (A) Relative mRNA expression in human iPSC-derived cardiomyocytes obtained from three healthy subjects as determined via RT-qPCR. High levels of COVID-19 mRNA expression were detected in iPSC-derived CMs infected with COVID-19 virus only and with COVID-19 virus plus ILs, but not detectable in cells mock infected or treated with ILs only, confirming viral infections. Cardiac contractile genes, including those coding for troponin T (TNNT2), myosin light chain 4 (MYL4), and cardiac actin (ACTC1), showed a 90% ± 5% reduction in their expression in iPSC-derived CMs infected with COVID-19 virus only and with COVID-19 virus plus ILs compared to mock infected. These levels of contractile gene expression showed a 25% ± 10% reduction when iPSC-derived CMs were treated with IL only. These findings correlated with iPSC-derived CMs’ contractility. Statistical significance was determined by one-way ANOVA with Bonferroni multiple-comparison test: *, P < 0.05; **, P < 0.01; ***, P < 0.001. (B) Three different CM lines were treated with ILs and/or infected with SARS-CoV-2 at an MOI of 0.1 for 72 h. The supernatants were collected and used for the measurement of levels of troponin I released into the medium. We found cells treated with ILs or infected with SARS-CoV-2 did not significantly release troponin I into the medium. However, infection in the presence of ILs significantly increased release of troponin into the culture medium. Comparing IL treatment or infection only to the combination of ILs with infection, we see there was significant increase in troponin release when we combined ILs with infection. Statistical significance was determined by one-way ANOVA with Bonferroni multiple-comparison test: *, P < 0.05; **, P < 0.01.
FIG 9
FIG 9
Effect of SARS-CoV-2 infection on beating of ventricular cardiomyocytes in cultures. (A) Three different CM lines were recorded for their beating in culture with ILs and/or infection in a biosafety level 3 facility. These CM lines were cultured for 45 to 60 days. Onto the movies that we recorded, we juxtaposed a 5-by-5 grid to count the number of beats per min for each cell line at 48 h postinfection. The number in each of the 25 grids (beats per minute) is the average from two experiments for one representative CM line for each condition. We observed that infection alone can slow down the beating, as could IL treatment. The strongest attenuation of beating was observed with SARS-CoV-2 infection in the presence of ILs. These images are from CM line MSN08-06S. Movie S1 (https://iyengarlab.org/) shows the beating of the CMs under various conditions. (B) Summaries of the counts of the beating in three different 3 CM lines are shown. Beat measurement in each area of the grid is represented as an open dot, and the mean and standard error of the mean (SEM) are shown. Asterisks indicate significance at P < 0.001 by ANOVA with Bonferroni multiple-comparison test. Though all conditions significantly attenuated beating, the most robust effect was from combining ILs with infection with SARS-CoV-2.
FIG 10
FIG 10
Effect of SARS-CoV-2 infection on cardiac output in COVID-19 patients. (A) COVID-19 patients without prior cardiac disease were divided into two groups: patients with normal LVEF (n = 165) and those with a decreased LVEF of <51 (n = 41). We plotted the peak troponin I level (ng/mL) using a natural log scale (ln) and peak IL-6 (pg/mL). The red line indicates where troponin levels are at 0.1 ng/mL (ln = −2.3) and the green line indicates levels at 1 ng/mL (ln = 0). For the group with LVEF of <51, 20 out of 41 (50%) have troponin levels of >1 ng/mL, while the number with normal LVEF is 22/165 (13.3%). In another group of patients with LVEF of <51, 6/41 (14.6%) have troponin I levels greater than 20 ng/mL (ln = 3); none of the patients with normal LVEF have a troponin I level above 20 ng/mL. For troponin I, the difference is very significant by t test (P < 0.0001), when comparing the group with normal LVEF to the group with LVEF of <51. (B to D) Echocardiogram clips showing diastolic and systolic states. (B) “Normal” demonstrates an apical 4-chamber view (after administration of an ultrasonic enhancing agent) from a transthoracic echocardiogram obtained from a COVID-19 patient (see Movie S2 at https://iyengarlab.org). The findings are consistent with preserved left ventricular ejection fraction and no regional wall motion abnormalities (diastolic and systolic frames). The end-diastolic and end-systolic volumes are 104 mL and 35 mL, respectively, with a left ventricular ejection fraction of 66%. (C) Regional wall motion abnormality (RWMA) demonstrates an apical 3-chamber view (after administration of an ultrasonic enhancing agent) from a transthoracic echocardiogram obtained from a COVID-19 patient (see Movie S3 at https://iyengarlab.org). The findings are consistent with basal and mid infero-lateral wall hypokinesis, despite preserved left ventricular ejection fraction (diastolic and systolic frames). The RWMA is highlighted by the red oval. The end-diastolic and end-systolic volumes are 102 mL and 50 mL, respectively, with a left ventricular ejection fraction of 51%. (D) “Diffuse” demonstrates an apical 4-chamber view (after administration of an ultrasonic enhancing agent) from a transthoracic echocardiogram obtained from a COVID-19 patient (see Movie S4 at https://iyengarlab.org). The findings are consistent with diffuse left ventricular wall hypokinesis and mildly decreased left ventricular ejection fraction. The end-diastolic and end-systolic volumes are 160 mL and 90 mL, respectively, with a left ventricular ejection fraction of 44%.

Update of

  • Physiology of cardiomyocyte injury in COVID-19.
    Siddiq MM, Chan AT, Miorin L, Yadaw AS, Beaumont KG, Kehrer T, White KM, Cupic A, Tolentino RE, Hu B, Stern AD, Tavassoly I, Hansen J, Martinez P, Dubois N, Schaniel C, Iyengar-Kapuganti R, Kukar N, Giustino G, Sud K, Nirenberg S, Kovatch P, Goldfarb J, Croft L, McLaughlin MA, Argulian E, Lerakis S, Narula J, García-Sastre A, Iyengar R. Siddiq MM, et al. medRxiv [Preprint]. 2020 Nov 16:2020.11.10.20229294. doi: 10.1101/2020.11.10.20229294. medRxiv. 2020. Update in: J Virol. 2022 Jan 26;96(2):e0106321. doi: 10.1128/JVI.01063-21. PMID: 33200140 Free PMC article. Updated. Preprint.

References

    1. New York Times. 2020. Coronavirus world map: tracking the global outbreak. https://www.nytimes.com/interactive/2020/world/coronavirus-maps.html.
    1. Stadler K, Masignani V, Eickmann M, Becker S, Abrignani S, Klenk HD, Rappuoli R. 2003. SARS—beginning to understand a new virus. Nat Rev Microbiol 1:209–218. 10.1038/nrmicro775. - DOI - PMC - PubMed
    1. Mackay IM, Arden KE. 2015. MERS coronavirus: diagnostics, epidemiology and transmission. Virol J 12:222. 10.1186/s12985-015-0439-5. - DOI - PMC - PubMed
    1. Zheng YY, Ma YT, Zhang JY, Xie X. 2020. COVID-19 and the cardiovascular system. Nat Rev Cardiol 17:259–260. 10.1038/s41569-020-0360-5. - DOI - PMC - PubMed
    1. Shi S, Qin M, Shen B, Cai Y, Liu T, Yang F, Gong W, Liu X, Liang J, Zhao Q, Huang H, Yang B, Huang C. 2020. Association of cardiac injury with mortality in hospitalized patients with COVID-19 in Wuhan, China. JAMA Cardiol 5:802–810. 10.1001/jamacardio.2020.0950. - DOI - PMC - PubMed

Publication types

MeSH terms