. 2022;14(3):243-256.
doi: 10.1159/000519305. Epub 2021 Oct 20.

The Gene Signature of Activated M-CSF-Primed Human Monocyte-Derived Macrophages Is IL-10-Dependent

Affiliations

The Gene Signature of Activated M-CSF-Primed Human Monocyte-Derived Macrophages Is IL-10-Dependent

Víctor D Cuevas et al. J Innate Immun. 2022.

Abstract

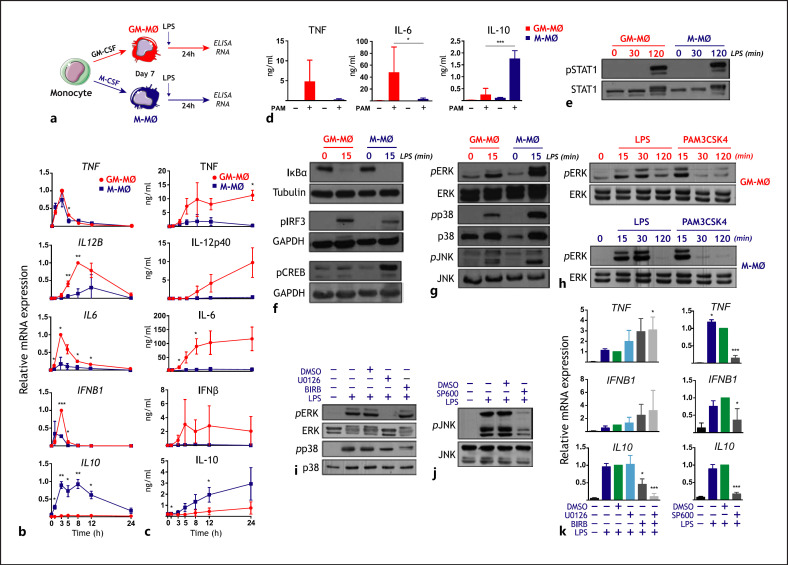
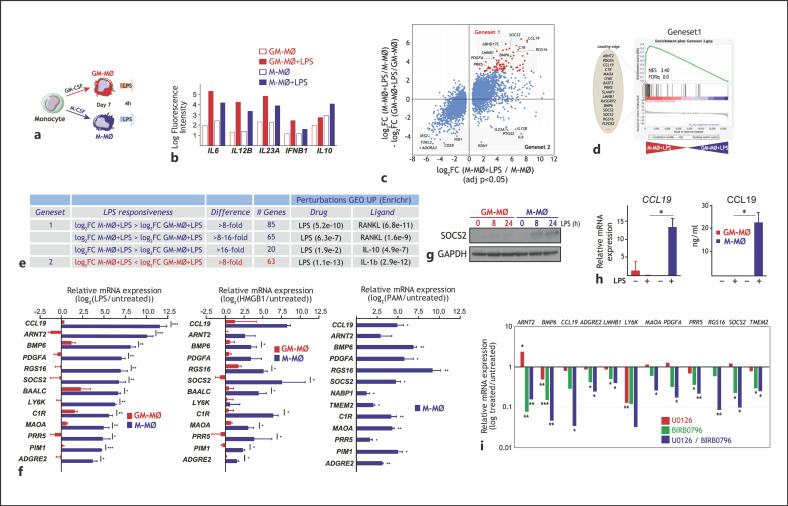
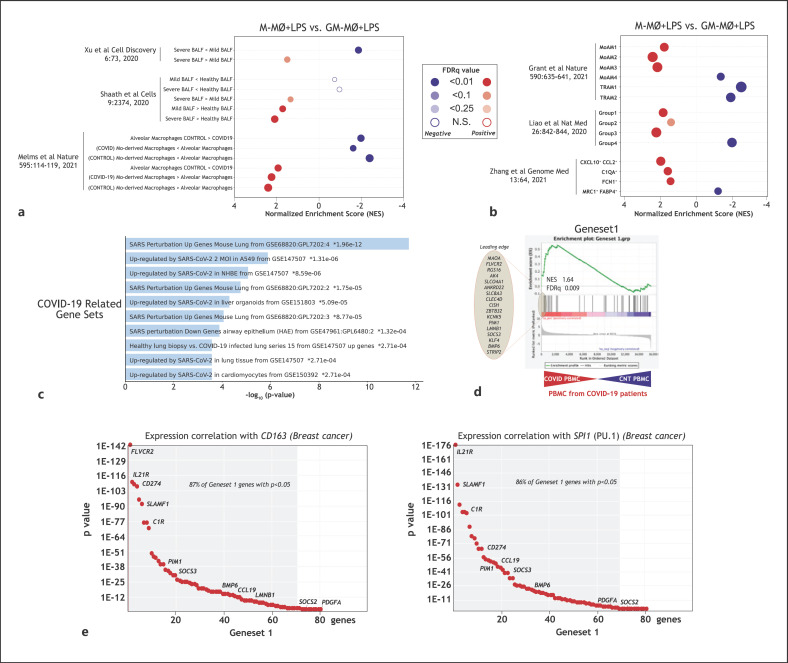
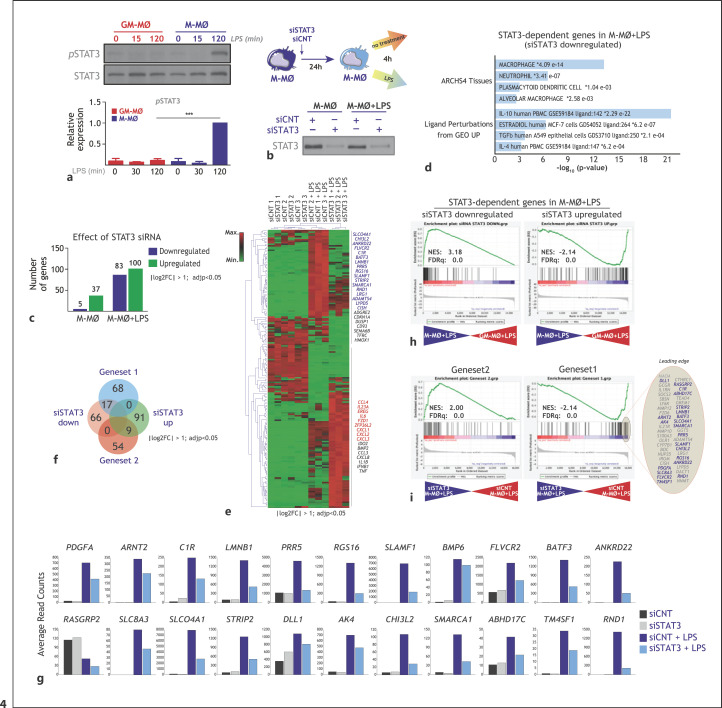
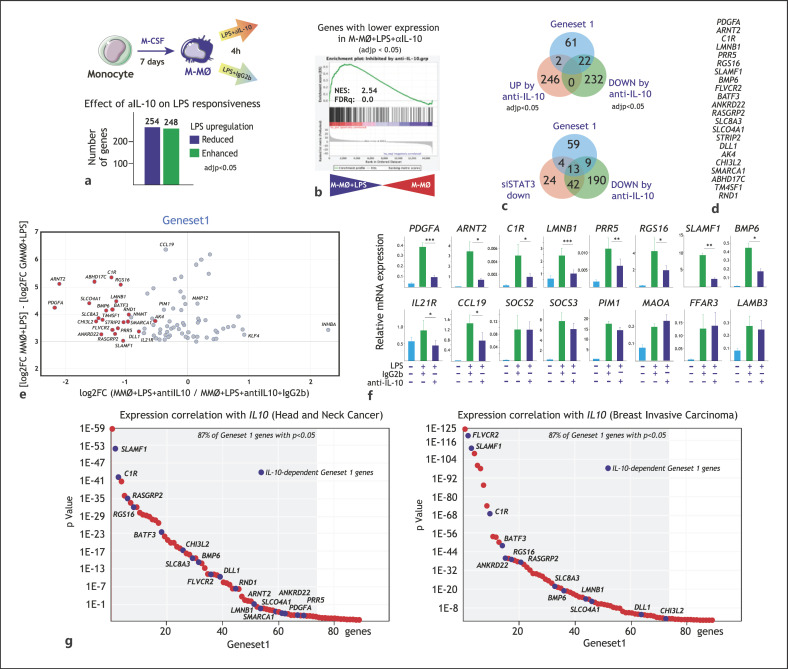
During inflammatory responses, monocytes are recruited into inflamed tissues, where they become monocyte-derived macrophages and acquire pro-inflammatory and tissue-damaging effects in response to the surrounding environment. In fact, monocyte-derived macrophage subsets are major pathogenic cells in inflammatory pathologies. Strikingly, the transcriptome of pathogenic monocyte-derived macrophage subsets resembles the gene profile of macrophage colony-stimulating factor (M-CSF)-primed monocyte-derived human macrophages (M-MØ). As M-MØ display a characteristic cytokine profile after activation (IL10high TNFlow IL23low IL6low), we sought to determine the transcriptional signature of M-MØ upon exposure to pathogenic stimuli. Activation of M-MØ led to the acquisition of a distinctive transcriptional profile characterized by the induction of a group of genes (Gene set 1) highly expressed by pathogenic monocyte-derived macrophages in COVID-19 and whose presence in tumor-associated macrophages (TAM) correlates with the expression of macrophage-specific markers (CD163, SPI1) and IL10. Indeed, Gene set 1 expression was primarily dependent on ERK/p38 and STAT3 activation, and transcriptional analysis and neutralization experiments revealed that IL-10 is not only required for the expression of a subset of genes within Gene set 1 but also significantly contributes to the idiosyncratic gene signature of activated M-MØ. Our results indicate that activation of M-CSF-dependent monocyte-derived macrophages induces a distinctive gene expression profile, which is partially dependent on IL-10, and identifies a gene set potentially helpful for macrophage-centered therapeutic strategies.

Keywords: Inflammation; Interleukin-10; Macrophage; Macrophage polarization.


Conflict of interest statement

The authors have no conflicts of interest to declare.

Figures

Fig. 1
Fig. 1
Cytokine profile and intracellular signaling of activated M-MØ and GM-MØ. a Experimental design. b, c Kinetics of LPS-induced cytokine mRNA (b) and protein (c) expression of M-MØ and GM-MØ. Results are expressed relative to the maximal level of cytokine mRNA (b) and the concentration of the indicated cytokines (c) in GM-MØ (TNF, IL-12p40, IL-6, IFNβ) or M-MØ (IL-10). Shown are the means and SD of 3 independent experiments (n = 3; *, p < 0.05; **, p < 0.005). d PAM3CSK4 (PAM)-induced cytokine production of M-MØ and GM-MØ. Shown are the means and SD of 6 independent experiments (n = 6; *, p < 0.05; ***, p < 0.0005). e, f M-MØ and GM-MØ were treated with LPS, and cell lysates were obtained at the indicated time points and assayed for the expression of phosphorylated and total STAT1 (e), IκBα, phosphorylated CREB, and phosphorylated IRF3 (f) by Western blot using specific antibodies. Protein loading was normalized using a monoclonal antibody against GAPDH or α-tubulin. g, h M-MØ and GM-MØ were treated with LPS or PAM3CSK4, and cell lysates obtained at the indicated time points were assayed for the expression of phosphorylated and total ERK1/2 (g, h), p38MAPK (g), and JNK (g) by Western blot using specific antibodies. i, j Total and phosphorylated ERK, p38MAPK, and JNK levels in untreated and LPS-treated M-MØ in the absence (−) or presence of the MEK inhibitor U0126 (U0) (i), the p38MAPK inhibitor BIRB0796 (BIRB) (i), the JNK inhibitor SP600125 (SP600) (j), or DMSO as a vehicle control. k LPS-induced cytokine mRNA levels in M-MØ in the absence (−) or presence of U0126 (U0), BIRB0796 (BIRB), SP600125 (SP600), or DMSO as a vehicle control. Results are expressed relative to the level of each cytokine mRNA after LPS + DMSO treatment. Shown are the means and SD of 4 independent experiments (n = 4; *, p < 0.05; **, p < 0.005; ***, p < 0.0005). LPS, lipopolysaccharide; M-MØ, monocyte-derived human macrophages.
Fig. 2
Fig. 2
Identification of genes differentially regulated by LPS in M-MØ and GM-MØ. a Experimental design. b Normalized fluorescence intensity of the indicated cytokine mRNA in untreated and LPS-treated M-MØ and GM-MØ. c Scatter plot of microarray results, showing the LPS-induced gene expression changes in M-MØ (log2 M-MØ + LPS/M-MØ, adj p < 0.05, x-axis) plotted against the difference in the LPS-induced gene expression changes in M-MØ and GM-MØ (log2FC [M-MØ + LPS/M-MØ] − log2FC [GM-MØ + LPS/GM-MØ]) (y-axis). The relative position of some informative genes is indicated. d GSEA on the ranked list of genes obtained from the comparison of the transcriptome of M-MØ + LPS versus GM-MØ + LPS using Gene set 1 genes. The identity of the genes within the leading edge is shown. e Identification of the gene sets including genes with the highest differential LPS responsiveness in M-MØ (Gene set 1) and GM-MØ (Gene set 2). The number of genes in each gene set and associated gene ontology terms (Enrichr) are indicated. f Expression of selected members of Gene set 1 in untreated and LPS-treated M-MØ and GM-MØ (left panel), untreated and HMGB1-treated M-MØ and GM-MØ (middle panel), and untreated and PAM3CSK4-treated M-MØ (right panel), as determined by qRT-PCR on 4 independent samples. Results are indicated as the mRNA levels of each gene in activated cells relative to the level of the same mRNA in untreated cells (n = 3–4; *, p < 0.05; **, p < 0.005; ***, p < 0.0005). g SOCS2 protein levels in GM-MØ and M-MØ stimulated with LPS for the indicated times, as determined by Western blot. Shown is 1 representative experiment (n = 2). hCCL19 mRNA and CCL19 protein levels in untreated (−) and LPS-treated M-MØ and GM-MØ. Shown are the means and SD of 5 independent experiments (n = 5; *, p < 0.05). i Expression of the indicated Gene set 1 genes in M-MØ stimulated with LPS (4 h) in the presence of U0126, BIRB0796, or BIRB0796 and U0126. Results indicate the expression of each gene relative to its expression in LPS-stimulated M-MØ. Shown are the means and SD of 3–4 independent experiments (n = 3–4; *, p < 0.05; **, p < 0.01; ***, p < 0.005). LPS, lipopolysaccharide; GSEA, gene set enrichment analysis; M-MØ, monocyte-derived human macrophages.
Fig. 3
Fig. 3
In vivo co-expression of Gene set 1. a, b Summary of GSEA on the ranked list of genes from the comparison of the transcriptome of M-MØ + LPS and GM-MØ + LPS using previously defined gene sets for (a) COVID-19 BALF macrophages [54, 55, 56] or (b) COVID-19 pathogenic monocyte-derived macrophage subsets [10, 11, 16]. c Gene ontology of Gene set 1 on the “COVID-19-related gene sets” database using Enrichr. d GSEA on the ranked list of the comparison of the transcriptome of PBMC from COVID-19 patients versus control PBMC [57], using Gene set 1 genes. The identity of the genes within the leading edge is shown. e Correlation of the expression on Gene set 1 genes with the expression of CD163 or SPI1 in breast carcinoma, as calculated using TIMER (http://timer.cistrome.org), with indication of the percentage of Gene set 1 genes whose positive correlation with the indicated gene is p < 0.05. LPS, lipopolysaccharide; GSEA, gene set enrichment analysis; BALF, bronchoalveolar lavage; PBMC, peripheral blood mononuclear cells; M-MØ, monocyte-derived human macrophages.
Fig. 4
Fig. 4
Contribution of STAT3 to the acquisition of Gene set 1 expression. (a) M-MØ and GM-MØ were treated with LPS, and cell lysates obtained at the indicated time points and assayed for the expression of phosphorylated and total STAT3 by Western blot using specific antibodies. (Lower panel) Densitometric analysis of the experiment shown above. b Experimental design for the RNAseq analysis on M-MØ transfected with a control (siCNT) or a STAT3-specific siRNA (siSTAT3) before exposure to LPS for 4 h (GSE180897) (lower panel) STAT3 protein expression in M-MØ transfected with control siRNA (siCNT) or a STAT3-specific siRNA (siSTAT3), and either before (untreated) or after LPS stimulation (n = 3). c Number of genes whose expression is significantly (log2FC > [1]; adjusted p < 0.05) enhanced or reduced in either M-MØ or M-MØ exposed to LPS. d Gene ontology of the 83 STAT3-dependent genes in M-MØ + LPS on the “ARCHS4 Tissues” and “Ligand Perturbations from GEO UP” databases using Enrichr. e Heatmap of the expression of genes significantly (log2FC >1; adjp <0.05) modulated by STAT3-specific siRNA in 3 independent samples of untreated or LPS-treated M-MØ, as determined by RNAseq and using Genesis (https://genome.tugraz.at/genesisclient/genesisclient_description.shtml). Selected genes for each cluster are indicated, highlighting those within Gene set 1 (blue) or Gene set 2 (red). f Venn diagram comparing the genes in Gene set 1 or Gene set 2 with the genes whose expression in M-MØ + LPS is significantly (log2FC >1; adjp <0.05) modulated by STAT3-specific siRNA. g Expression of the indicated Gene set 1 genes in M-MØ transfected with control siRNA (siCNT) or a STAT3-specific siRNA (siSTAT3) either before or after stimulation with LPS (4 h) (GSE180897). h GSEA (http://software.broadinstitute.org/gsea/index.jsp) of the ranked comparison of the transcriptomes of M-MØ + LPS versus M-MØ + LPS, using the genes whose expression in M-MØ + LPS is significantly (log2FC >1; adjp <0.05) modulated (upregulated or downregulated) by STAT3-specific siRNA. NES and FDRq are indicated in each case. The identity of the genes within the leading edge is shown. i GSEA (http://software.broadinstitute.org/gsea/index.jsp) of the ranked comparison of the transcriptomes of siSTAT3-M-MØ + LPS versus siCNT-M-MØ + LPS, using Gene set 1 or Gene set 2. NES and FDRq are indicated in each case. The identity of the genes within the leading edge is shown for Gene set 1, with indication of IL-10-dependent genes indicated in Fig. 5 (blue). LPS, lipopolysaccharide; FDRq, false discovery rate q value; NES, normalized enrichment score; GSEA, gene set enrichment analysis; M-MØ, monocyte-derived human macrophages.
Fig. 5
Fig. 5
Contribution of IL-10 to the acquisition of Gene set 1 expression. a Experimental design for the RNAseq analysis on M-MØ exposed to LPS in the presence of a blocking anti-IL-10 antibody (anti-IL-10) or an isotype-matched antibody (IgG) (GSE181250). (Lower panel) Number of genes whose LPS-regulated expression is significantly (log2FC> [1]; adjusted p < 0.05) enhanced or reduced in M-MØ exposed to LPS in the presence of a blocking anti-IL-10 antibody (anti-IL-10). b GSEA (http://software.broadinstitute.org/gsea/index.jsp) of the statistics-ranked list of genes obtained from the M-MØ + LPS versus untreated M-MØ limma analysis, using the genes whose LPS-inducibility is significantly reduced by anti-IL-10 as data set. Normalized Enrichment Score (NES) and FDRq are indicated in each case. c (Upper panel) Venn diagram comparing the genes in Gene set 1 with the genes whose LPS regulation is significantly affected by a blocking anti-IL-10 antibody. (Lower panel) Venn diagram comparing the genes in Gene set 1 with the genes whose LPS regulation is downregulated by either STAT3 knockdown or a blocking anti-IL-10 antibody. d List of IL-10-dependent genes in Gene set 1. e Scatter plot on the genes with the highest M-MØ-specific LPS-upregulation, showing their LPS-induced gene expression change (log2FC MMO + LPS − log2FC GMMO + LPS, y-axis) plotted against their respective susceptibility to the presence of a blocking anti-IL-10 antibody (log2FC (anti-IL10/IgG2b), x-axis). The position of some informative genes is indicated. f Expression of the indicated Gene set 1 genes in LPS-stimulated M-MØ in the presence of a blocking anti-IL-10 antibody (anti-IL-10) or an isotype-matched antibody (IgG). Results indicate the expression of each gene relative to its expression in nonstimulated M-MØ. Shown are the means and SD of 3 independent experiments (n = 6; *, p < 0.05; ***, p < 0.005). g Correlation of the expression on Gene set 1 genes with the expression of IL10 in breast carcinoma (right panel) and head and neck cancer (left panel), as calculated using TIMER (http://timer.cistrome.org), with indication of the percentage of Gene set 1 genes whose positive correlation with the indicated gene is p < 0.05. LPS, lipopolysaccharide; FDRq, false discovery rate q value; GSEA, gene set enrichment analysis; M-MØ, monocyte-derived human macrophages.

References

    1. Hoeffel G, Ginhoux F. Fetal monocytes and the origins of tissue-resident macrophages. Cell Immunol. 2018;330:5–15. - PubMed
    1. Liao X, Shen Y, Zhang R, Sugi K, Vasudevan NT, Alaiti MA, et al. Distinct roles of resident and nonresident macrophages in nonischemic cardiomyopathy. Proc Natl Acad Sci USA. 2018;115((20)):E4661–9. - PMC - PubMed
    1. Puranik AS, Leaf IA, Jensen MA, Hedayat AF, Saad A, Kim KW, et al. Kidney-resident macrophages promote a proangiogenic environment in the normal and chronically ischemic mouse kidney. Sci Rep. 2018;8((1)):13948. - PMC - PubMed
    1. Misharin AV, Morales-Nebreda L, Reyfman PA, Cuda CM, Walter JM, McQuattie-Pimentel AC, et al. Monocyte-derived alveolar macrophages drive lung fibrosis and persist in the lung over the life span. J Exp Med. 2017;214((8)):2387–404. - PMC - PubMed
    1. Zaslona Z, Przybranowski S, Wilke C, van Rooijen N, Teitz-Tennenbaum S, Osterholzer JJ, et al. Resident alveolar macrophages suppress, whereas recruited monocytes promote, allergic lung inflammation in murine models of asthma. J Immunol. 2014;193((8)):4245–53. - PMC - PubMed

Publication types

MeSH terms

Substances