. 2021 Dec;600(7889):530-535.
doi: 10.1038/s41586-021-04117-7. Epub 2021 Oct 20.

Hybrid immunity improves B cells and antibodies against SARS-CoV-2 variants

Affiliations

Hybrid immunity improves B cells and antibodies against SARS-CoV-2 variants

Emanuele Andreano et al. Nature. 2021 Dec.

Abstract

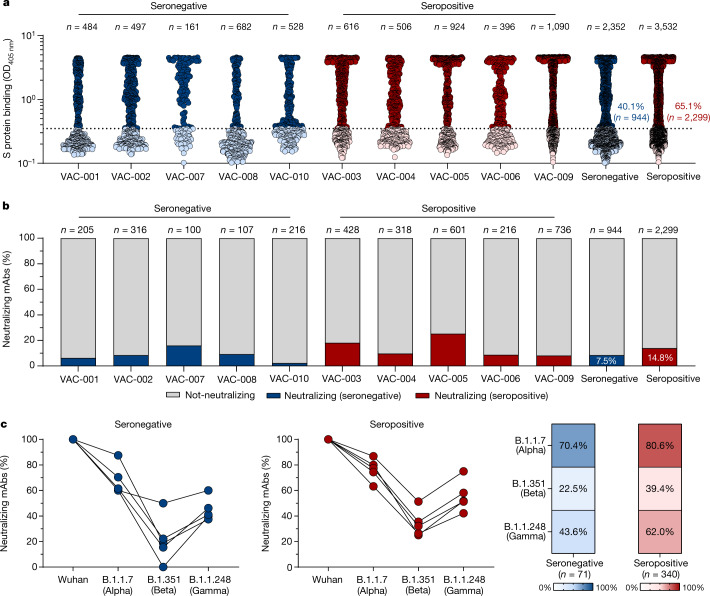
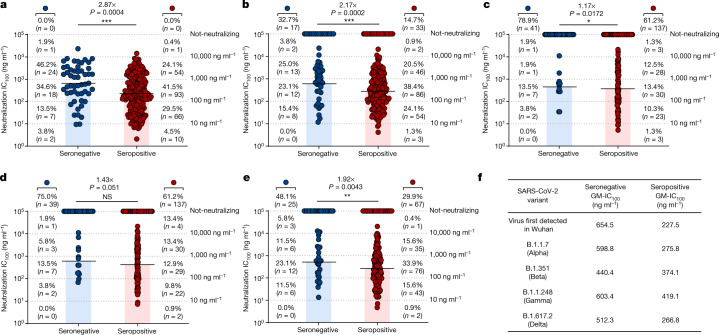
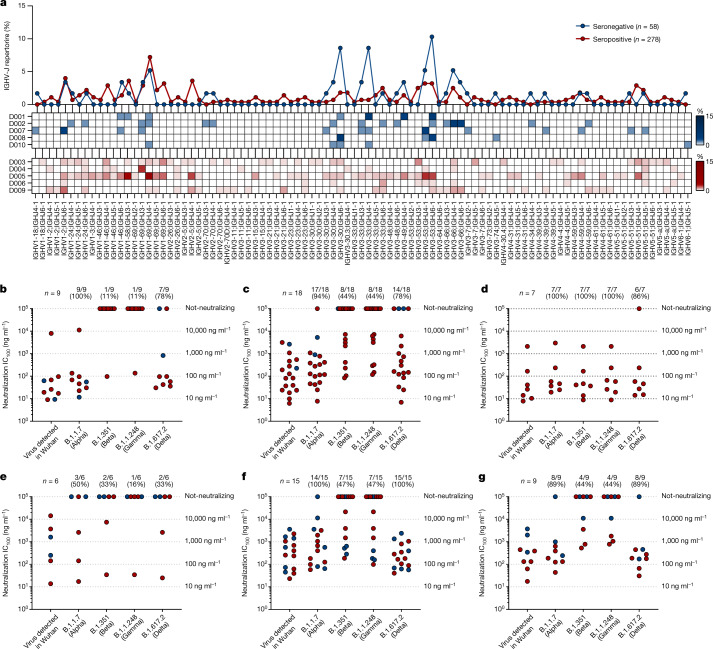
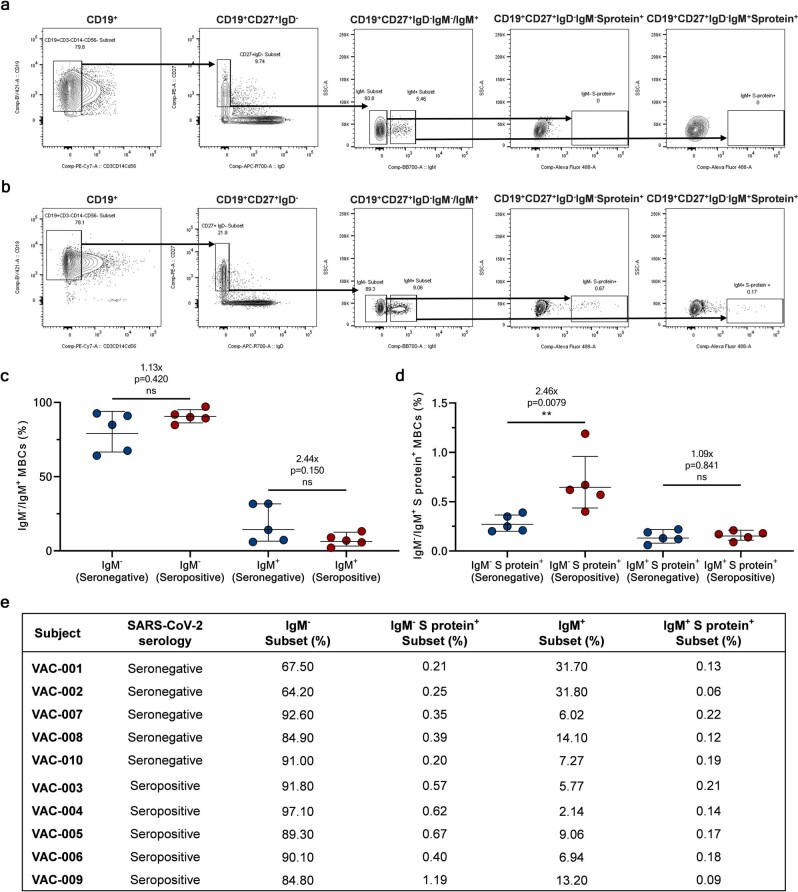
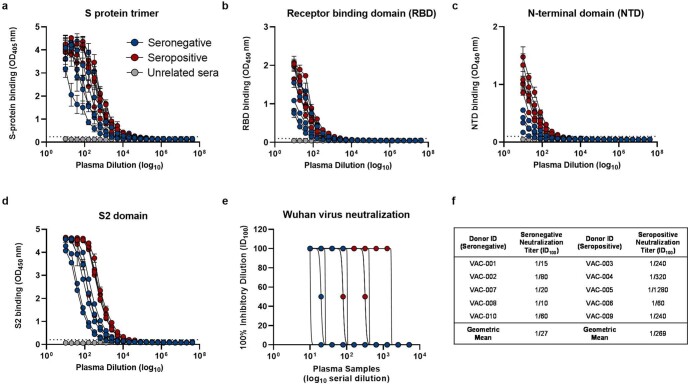
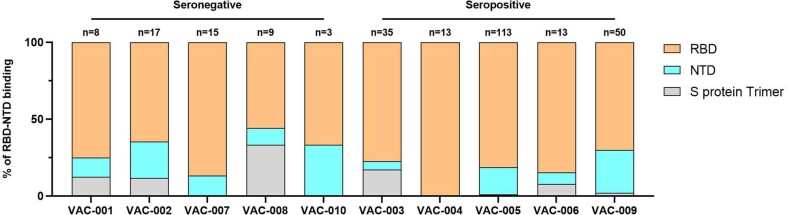
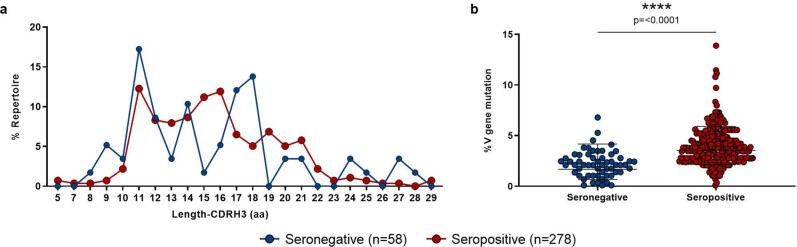
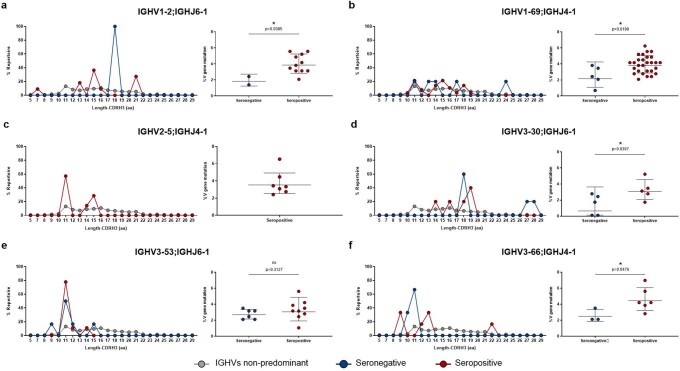
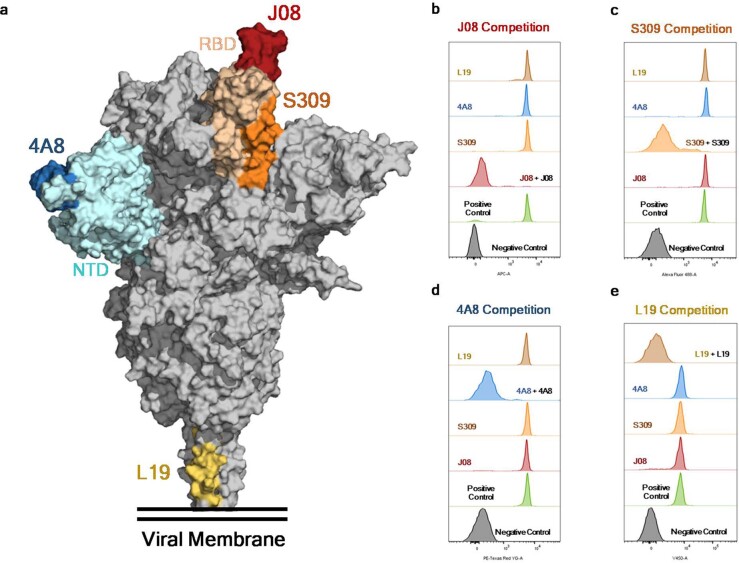
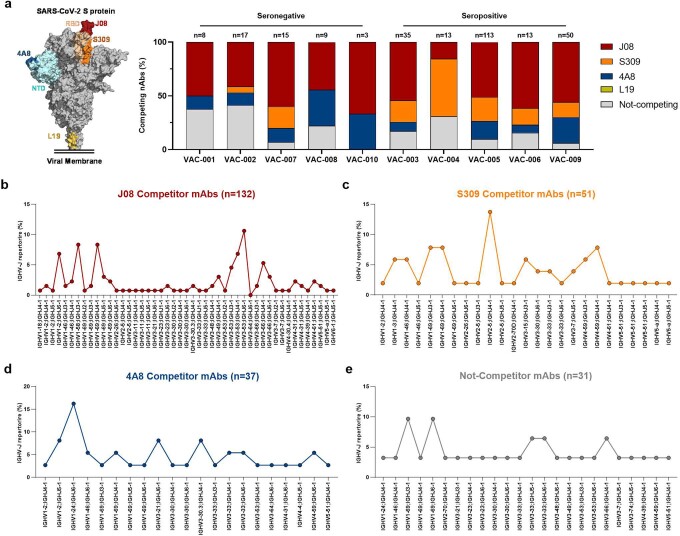
The emergence of SARS-CoV-2 variants is jeopardizing the effectiveness of current vaccines and limiting the application of monoclonal antibody-based therapy for COVID-19 (refs. 1,2). Here we analysed the memory B cells of five naive and five convalescent people vaccinated with the BNT162b2 mRNA vaccine to investigate the nature of the B cell and antibody response at the single-cell level. Almost 6,000 cells were sorted, over 3,000 cells produced monoclonal antibodies against the spike protein and more than 400 cells neutralized the original SARS-CoV-2 virus first identified in Wuhan, China. The B.1.351 (Beta) and B.1.1.248 (Gamma) variants escaped almost 70% of these antibodies, while a much smaller portion was impacted by the B.1.1.7 (Alpha) and B.1.617.2 (Delta) variants. The overall loss of neutralization was always significantly higher in the antibodies from naive people. In part, this was due to the IGHV2-5;IGHJ4-1 germline, which was found only in people who were convalescent and generated potent and broadly neutralizing antibodies. Our data suggest that people who are seropositive following infection or primary vaccination will produce antibodies with increased potency and breadth and will be able to better control emerging SARS-CoV-2 variants.


Conflict of interest statement

R.R. is an employee of the GSK group of companies. E.A., I.P., N.M., P.P., E.P., C.D.S., C.S. and R.R. are listed as inventors of full-length human mAbs described in Italian patent applications no. 102020000015754 filed on 30 June 2020, 102020000018955 filed on 3 August 2020 and 102020000029969 filed on 4 December 2020, and the international patent system number PCT/IB2021/055755 filed on 28 June 2021. All patents were submitted by Fondazione Toscana Life Sciences, Siena, Italy. The remaining authors declare no competing interests.

Figures

Fig. 1
Fig. 1. Identification of cross-neutralizing SARS-CoV-2 S protein-specific nAbs.
a, The graph shows supernatants that were tested for binding to the SARS-CoV-2 S protein antigen first detected in Wuhan, China. The threshold of positivity was set as two times the value of the blank (dotted line). The dark blue and dark red dots represent mAbs that bind to the S protein for vaccinees who were seronegative and seropositive, respectively. The light blue and light red dots represent mAbs that do not bind to the S protein for vaccinees who were seronegative and seropositive, respectively. OD, optical density. b, The bar graph shows the percentage of not-neutralizing antibodies (grey), nAbs from individuals who were seronegative (dark blue) and nAbs for individuals who were seropositive (dark red). The total number (n) of antibodies tested per individual is shown on the top of each bar in a, b. c, The graphs show the fold-change percentage of nAbs in individuals who were seronegative (left) and seropositive (right) against the Alpha, Beta and Gamma VoCs compared with the original SARS-CoV-2 virus detected in Wuhan. The heat maps show the overall percentage of the SARS-CoV-2 nAbs detected in Wuhan that are able to neutralize the tested VoCs. Source data
Fig. 2
Fig. 2. Potency and breadth of neutralization of nAbs against SARS-CoV-2 and VoCs.
ae, Scatter dot charts show the neutralization potency, reported as IC100 (ng ml−1), of nAbs tested against the original SARS-CoV-2 virus first detected in Wuhan (a) and the B.1.1.7 (b), B.1.351 (c), B.1.1.248 (d) and B.1.617.2 (e) VoCs. The number and percentage of nAbs from individuals who were seronegative versus seropositive, fold change, neutralization IC100 geometric mean (black lines, blue and red bars) and statistical significance are denoted on each graph. A non-parametric Mann–Whitney t-test was used to evaluate statistical significances between groups. Two-tailed P value significances are shown as *P < 0.05, **P < 0.01, ***P < 0.001. NS, not significant. f, The table shows the IC100 geometric mean (GM) of all nAbs pulled together from each group against all SARS-CoV-2 viruses tested. Technical duplicates were performed for each experiment. Source data
Fig. 3
Fig. 3. Repertoire analyses and functional characterization of predominant gene-derived nAbs.
a, The graph shows the IGHV-J rearrangement frequencies between vaccinees who were seronegative and seropositive (top), and the frequency within seronegative (middle) and seropositive (bottom) participants. bg, The graphs show the neutralization potency (IC100) of predominant gene-derived nAbs from the IGHV1-2;IGHJ6-1 (b), IGHV1-69;IGHJ4-1 (c), IGHV2-5;IGHJ4-1 (d), IGHV3-30;IGHJ6-1 (e), IGHV3-53;IGHJ6-1 (f) and IGHV3-66;IGHJ4-1 (g) families, against the original SARS-CoV-2 virus first detected in Wuhan and the B.1.1.7, B.1.351, B.1.1.248 and B.1.617.2 VoCs. Source data
Extended Data Fig. 1
Extended Data Fig. 1. Single cell sorting and memory B cell frequencies.
a, b, The gating strategy shows from left to right: CD19+ B cells; CD19+CD27+IgD-; CD19+CD27+IgD-IgM-/IgM+; CD19+CD27+IgD-IgM-Sprotein+; CD19+CD27+IgD-IgM+Sprotein+ for a healthy donor (used as negative control for S protein staining) and a vaccinated subject. c, The graph shows the frequency of CD19+CD27+IgD-IgM- and IgM+ in seronegative (n=5) and seropositive donors (n=5). d, The graph shows the frequency of CD19+CD27+IgD-IgM- and IgM+ able to bind the SARS-CoV-2 S protein trimer (S protein+) in seronegative (n=5) and seropositive (n=5) donors. Geometric mean and standard deviation are denoted on the graphs. A nonparametric Mann–Whitney t test was used to evaluate statistical significances between groups. Two-tailed p-value significances are shown as *p < 0.05, **p < 0.01, ***p < 0.001, and ****p < 0.0001. e, The table summarizes the frequencies of the cell population above described for all subjects enrolled in our study. Source data
Extended Data Fig. 2
Extended Data Fig. 2. Plasma response of COVID-19 vaccinees.
ad, Graphs show the ability of plasma samples from seronegative and seropositive vaccinees to bind the S protein trimer, RBD, NTD and S2 domain. Mean and standard deviation are denoted on each graph. Technical triplicates were performed for each experiment. e, The graph shows the neutralizing activity of plasma samples against the original Wuhan SARS-CoV-2 virus. Technical duplicates were performed for each experiment. f, The table summarizes the 100% inhibitory dilution (ID100) of each COVID-19 vaccinee and the geometric mean for seronegative and seropositive donors. Source data
Extended Data Fig. 3
Extended Data Fig. 3. RBD and NTD binding distribution of nAbs.
The graph shows the percentage of antibodies that bind specifically the RBD (light orange) or the NTD (cyan) or that did not bind single domains but recognized exclusively the S protein in its trimetric conformation (gray). The number (n) of tested nAbs per donor is reported on top of each bar. Technical duplicates were performed for each experiment. Source data
Extended Data Fig. 4
Extended Data Fig. 4. Heavy chain CDR3 length and somatic hypermutation levels in seronegative and seropositive vaccinees.
a, The graph shows the heavy chain CDR3 length represented in amino acids (aa). b, The graph shows the overall somatic hypermutation level of nAbs isolated from seronegative and seropositive vaccinees. Geometric mean and standard deviation are denoted on the graphs. A nonparametric Mann–Whitney t test was used to evaluate statistical significances between groups. Two-tailed p-value significances are shown as *p < 0.05, **p < 0.01, ***p < 0.001, and ****p < 0.0001. Source data
Extended Data Fig. 5
Extended Data Fig. 5. Heavy chain CDR3 length and somatic hypermutation levels of predominant gene derived nAbs.
af, Graphs show the amino acidic heavy chain CDR3 length (left panel) and the somatic hypermutation level (right panel) of nAbs derived from the IGHV1-2;IGHJ6-1 (n = 13), IGHV1-69;IGHJ4-1 (n = 33), IGHV2-5;IGHJ4-1 (n = 7), IGHV3-30;IGHJ6-1 (n = 10), IGHV3-53;IGHJ6-1 (n = 15) and IGHV3-66;IGHJ4-1 (n = 9) gene families. Geometric mean and standard deviation are denoted on the graphs. A nonparametric Mann–Whitney t test was used to evaluate statistical significances between groups. Two-tailed p-value significances are shown as *p < 0.05, **p < 0.01, ***p < 0.001, and ****p < 0.0001. Source data
Extended Data Fig. 6
Extended Data Fig. 6. Epitope binning assay.
a, Schematic representation of the epitopes recognized by J08 (dark red), S309 (orange), 4A8 (dark blue) and L19 (gold), mAbs on the S protein surface. be, Representative cytometer peaks per each of the four mAbs used for the competition assay. Positive (beads conjugated with only primary labeled antibody) and negative (un-conjugated beads) controls are shown as green and gray peaks, respectively. Source data
Extended Data Fig. 7
Extended Data Fig. 7. Epitope binning and genetic characterization of competing nAbs.
a, The bar graph shows the percentage (%) of nAbs competing with J08 (dark red), S309 (orange), 4A8 (dark blue) and L19 (gold), or antibodies that did not compete with any of the previous mAbs (gray). A schematic representation of J08, S309, 4A8 and L19 epitopes on the S protein surface is shown on the left side of the panel. be, Graphs show the IGHV-J rearrangement percentage for nAbs that competed against J08, S309, 4A8, or that did not compete with any of these mAbs. The total number (n) of competing nAbs per group is shown on top of each graph. Source data

References

    1. Krause PR, et al. SARS-CoV-2 variants and vaccines. N. Engl. J. Med. 2021;385:179–186. doi: 10.1056/NEJMsr2105280. - DOI - PMC - PubMed
    1. Starr TN, et al. Prospective mapping of viral mutations that escape antibodies used to treat COVID-19. Science. 2021;371:850–854. doi: 10.1126/science.abf9302. - DOI - PMC - PubMed
    1. Wajnberg A, et al. Robust neutralizing antibodies to SARS-CoV-2 infection persist for months. Science. 2020;370:1227–1230. doi: 10.1126/science.abd7728. - DOI - PMC - PubMed
    1. Xiaojie S, Yu L, Lei Y, Guang Y, Min Q. Neutralizing antibodies targeting SARS-CoV-2 spike protein. Stem Cell Res. 2021;50:102125. doi: 10.1016/j.scr.2020.102125. - DOI - PMC - PubMed
    1. Andreano E, et al. Extremely potent human monoclonal antibodies from COVID-19 convalescent patients. Cell. 2021;184:1821–1835.e16. doi: 10.1016/j.cell.2021.02.035. - DOI - PMC - PubMed

Publication types

MeSH terms

Supplementary concepts