. 2022 Jun 1;107(6):1410-1426.
doi: 10.3324/haematol.2021.279276.

Apoptosis reprogramming triggered by splicing inhibitors sensitizes multiple myeloma cells to Venetoclax treatment

Affiliations

Apoptosis reprogramming triggered by splicing inhibitors sensitizes multiple myeloma cells to Venetoclax treatment

Debora Soncini et al. Haematologica. .

Abstract

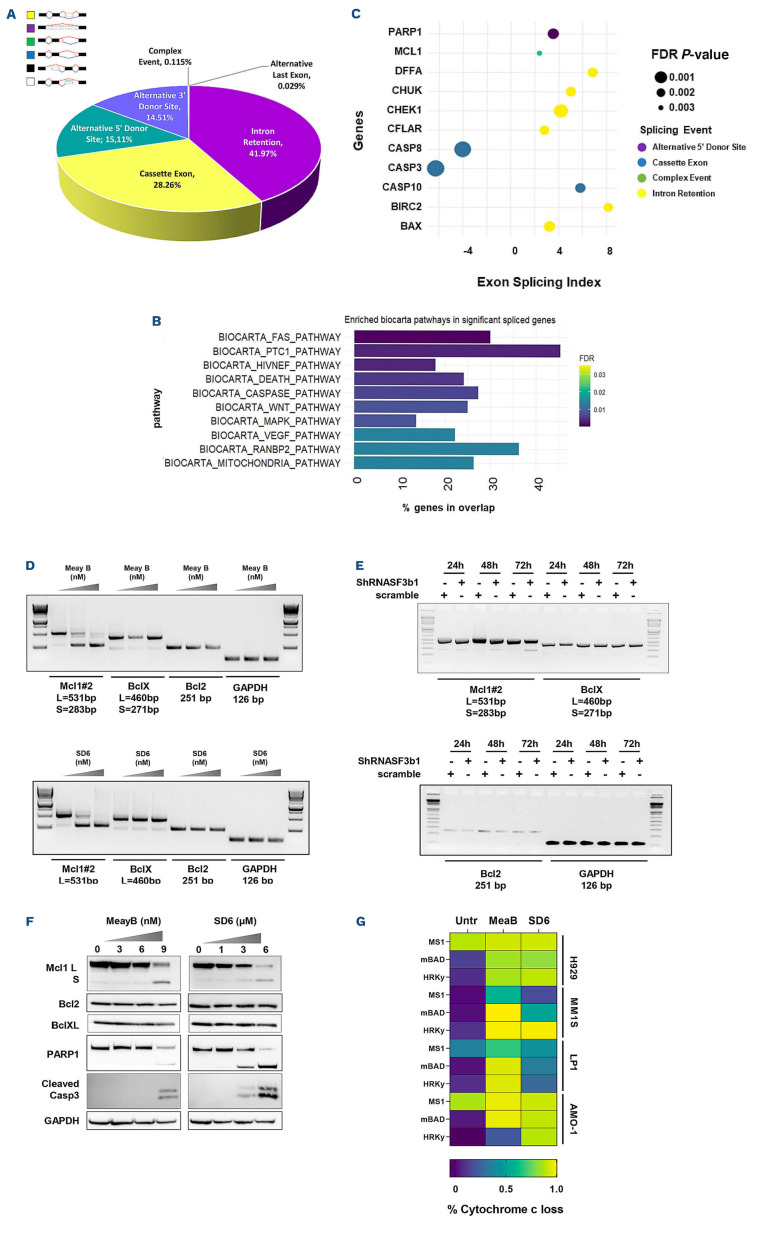
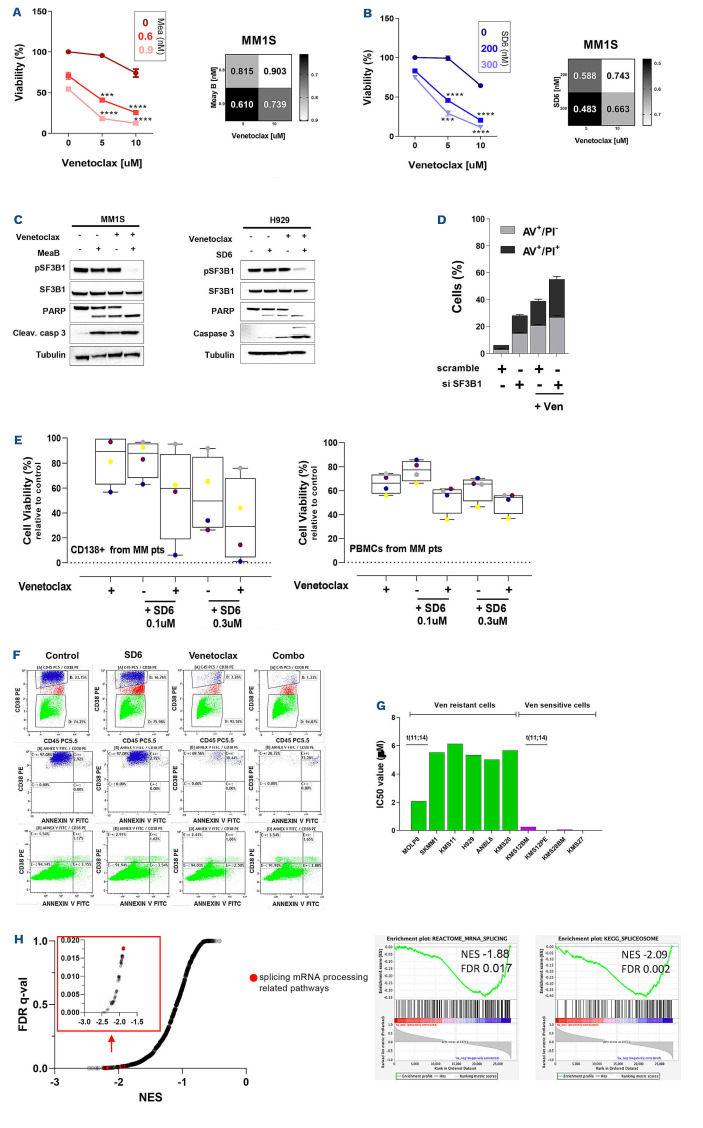
Identification of novel vulnerabilities in the context of therapeutic resistance is emerging as a key challenge for cancer treatment. Recent studies have detected pervasive aberrant splicing in cancer cells, supporting its targeting for novel therapeutic strategies. Here, we evaluated the expression of several spliceosome machinery components in multiple myeloma (MM) cells and the impact of splicing modulation on tumor cell growth and viability. A comprehensive gene expression analysis confirmed the reported deregulation of spliceosome machinery components in MM cells, compared to normal plasma cells from healthy donors, with its pharmacological and genetic modulation resulting in impaired growth and survival of MM cell lines and patient-derived malignant plasma cells. Consistent with this, transcriptomic analysis revealed deregulation of BCL2 family members, including decrease of anti-apoptotic long form of myeloid cell leukemia-1 (MCL1) expression, as crucial for "priming" MM cells for Venetoclax activity in vitro and in vivo, irrespective of t(11;14) status. Overall, our data provide a rationale for supporting the clinical use of splicing modulators as a strategy to reprogram apoptotic dependencies and make all MM patients more vulnerable to BCL2 inhibitors.


Figures

Figure 1.
Figure 1.
Splicing machinery is markedly deregulated in multiple myeloma. A) Heat map showing expression levels (row z-score) of indicated genes among plasma cells derived from patients with multiple myeloma (MM) (n=7) and peripheral blood mononuclear cells (PBMC) from healthy individuals (n=2). The color scale spans the relative gene expression changes standardized on the variance. B) Heatmap of 774 MM patients included in CoMMpass study ordered in 3 groups according to z-score calculated on 124 genes of KEGG spliceosome gene set, as annotated in MSigDB. C) Kaplan–Meier survival curves of high z-score (red) and low z-score (blue) MM patients of CoMMpass cohort (642 patients analyzed) on progression-free survival (PFS) and overall survival (OS) data. Log-rank test P-value and number of samples at risk in each group across time are reported. D) Forest plot based on Cox univariate analysis for OS. Squares represent hazard ratios; bars represent 95% confidence intervals. E) Protein lysates from a panel of MM cell lines (human multiple myeloma cell line [HMCL]) and primary MM patients or healthy donors (HD) were analyzed for SF3B1 expression by western blotting. GAPDH was used as loading control. One representative experiment is shown. F) Representative images of SF3B1 and CD138 immunocytochemistry stain in bone marrow (BM) from MM patients (n=5). Conventional Giemsa staining is also shown. Original magnification × 200, scale bar, 100 mm.
Figure 2.
Figure 2.
Spliceosome core-element SF3B1 targeting results in anti-multiple myeloma activity. A) Percentage of indicated splicing categories across RNA sequencing data derived from CoMMpass study according to SF3B1 expression levels (top vs. bottom quartile). B) Immunofluorescence staining for SC-35 in scramble and short hairpin (sh) SF3B1-sh RNA H929 multiple myeloma (MM) cells. SF3B1 silencing was validated by western blot as shown in the panel below. SC-35 staining of nuclear speckles is shown: mean fluorescence intensity (MFI) per cell/nucleus of the specific signal was quantified by counting at least 50 nuclei per condition as reported in the histogram below (**P=0.0042, two-sided Student t-test). Scale bar, 10 µm. C) MTS assay of MM1S (top) and H929 (bottom) lentivirally transduced with shSF3B1 (#1,#3 and #4) or sh scramble. Cell viability was measured at indicated time point after transduction. Western blot analyses were performed at day 3, confirming decreased SF3B1 protein levels and apoptotic cell death features (PARP1 and caspase 3 cleavage). Data are representative of at least 3 independent experiments. D) Cell viability curves compare a panel of 14 MM cell lines’ sensitivity to Meaymicin B (nM) for 48 h (n=3 technical replicates; mean +/- standard deviation [SD]) E) Evaluation of PARP, caspase 3, MCL1 and GAPDH by western blot on indicated MM cell lines treated with increasing doses of MeaymicinB for 24 hours. F) Treatment of primary bone marrow aspirate samples from MM patients (n=5) at various doses of MeaymicinB (0.1-30 nM) for 48 hours shows significant cytotoxicity of CD138+ tumor cells (n=3 technical replicates; mean +/- SD). G) Ex vivo evaluation of Meaymicin B in total bone marrow cells from one representative MM patient. After red cell lysis, cells were stained with Annexin V, DAPI and CD38 monoclonal antibody to identify viable as well as apoptotic myeloma (CD38 positive/CD45 negative) and normal (CD38 negative/CD45 negative) cells.
Figure 3.
Figure 3.
Spliceosome deregulation affects genome stability of multiple myeloma cells irrespective of Myc status. A) Detection of gH2AX and Q-nuclear was measured by confocal microscopy in H929 cells expressing short hairpin RNA (shRNA) (clone #3 and #4) targeting SF3B1 or control. Each panel includes representative foci-containing cells graph, over 3 experiments. (**P=0.004, ***P<0.001; two-sided Student t-test). B) H929 cells were engineered to express an anti-SF3B1 shRNA (3 clones). Next, SF3B1, RAD51 and gH2AX protein levels were detected by immunoblotting. C) Detection of gH2AX and Q-nuclear by confocal microscopy of H929 cells ex-cultured with or without increased dosed of Meayamycin B (1-3 mM) for 24 hours. Each panel includes representative foci-containing cells graph, over 3 experiments (*P=0.01, ****P<0.0001; two-sided Student t-test). (A and C) scale bar, 50 mm. D) Western blot analysis of DNA damage response markers (RAD51 and gH2AX) after Meaymicin B treatment over a range of doses (upper panel) and timing (3nM) (lower panel) in H929 cells. E) Relative expression of Myc protein plotted vs. Meaymicin B cytotoxicity half maximal inhibitory concentration (IC50) values. The Pearson correlation coefficient (r) and the P-value, calculated using GraphPad Prism Version 5 analysis software, are indicated; F) immunoblot for cMyc, SF3B1 and gH2AX protein levels in isogenic U266 cells (pLV empty) or cMyc overexpressing (pLV cMyc) cells; G) these cells were treated with growing doses of Meayamycin B for 48 hours. Cell viability was measured with MTS assay and presented as a percentage of control. H) Cell viability analysis of pLV empty (pLV cMyc) U266 cells transduced with short hairpin RNA (shRNA) clones containing the target sequence of SF3B1 (clone#1) or scrambled control. (**P=0.004; two-sided Student t-test).
Figure 4.
Figure 4.
BCL2 family member deregulation outlines splicing modulators activity on multiple myeloma cells. A) Pie chart showing the proportion of significant splice changes derived from ClariomD data of multiple myeloma (MM) cell lines treated with Meayamycin B compared with dimethyl sulfoxide (DMSO)-treated controls. Yellow slice indicates significant intron cassette exon events; purple slice indicates significant intron retention events; gray indicate all other complex categories of splice events. B) The top 10 pathways included in BioCarta gene sets enriched by fgsea R package among the 1,000 most significant mis-spliced genes in Meayamycin B-treated cells. C) Bubble plot shows the enrichment scores, P-values and the types of aberrant splicing event in the top mis-spliced genes of apoptosis pathway after Meayamycin B treatment compared with control cells. D and E) Reverse transcription polymerase chain reaction (RT-PCR) analyses of H929 cells after 6-hour treatment with growing doses of Meayamycin B (3-6 nM) and Sudemycin D6 (1-3µM) (D) or different time points after lentiviral transduction with scramble control or SF3B1 specific shRNAs clone#1 (E), to assess levels of MCL1 (L, long and S, short isoforms), BCLxL and BCL2. GAPDH is used as internal control. The length of the main amplified isoforms is indicated as base pairs (bp). F) Western blot analysis of MCL1, BCL2, BCLxL, PARP and cleaved caspase3 protein expression upon treatment with Meayamycin B and SD6 in H929 cells. GAPDH was used as loading control. G) Heatmap of percentage Cytochrome c loss, as quantified by flow cytometry on indicated MM cell lines after 6-hour treatment with different chemicals as compared with DMSO-treated controls (purple, lowest value; yellow, highest value). After each treatment, MM cells were exposed to BH3 mimetic peptides (MS1 10 uM, mBAD and HRKy 100 uM for all cell lines except for MM1S where 50 µM mBAD and HRKy were used) for 45 minutes at room temperature and subsequently stained for fluorescence activated cell sorting analysis.
Figure 5.
Figure 5.
Splicing modulators sensitize multiple myeloma cells to Venetoclax by deregulating BCL2 family-members. Cell viability curves of multiple myeloma (MM) cells treated with combination therapies using Meayamycin B (A) or Sudemycin D6 (B) and Venetoclax. CI synergy score (calculated with CalcuSyn software) for each set of drugs combination is indicated. Data are presented as mean ± standard deviation (SD) (n=3). (***P≤0.001, ****P≤ 0.0001; unpaired t-test). C) Immunoblots for phospho-SF3B1, SF3B1, PARP, caspase 3, and GAPDH on MM cell lines following each stimulus (indicated in figure) at 24 hours. D) Apoptotic cell death assessed with flow cytometry analysis after Annexin V/propidium iodide (PI) staining of AMO-1 cells SF3B1-silenced (nucleofected with specific small interfering RNA (siRNA) or control cells (siRNA scramble) treated with Venetoclax (7.5 µM) for 48 hours. Displayed are data represented as mean +/- SD in all (n=3). E) CD138+ cells (left) and peripheral blood mononuclear cells (PBMC) (right) collected from MM patients were treated with indicated doses of SD6, Venetoclax (0.5 µM) and their combination for 48 hours. Cell viability was measured by CTG assay. Cells deriving from the same patient are represented with same color in each graph. F) Flow plots of 1 representative MM patient sample. Corresponding sensitivity of MM-gated cells (CD38+/CD45-) and bone marrow stromal cells (BMSC) (CD38-/CD45-) to Venetoclax, SD6and cotreatment are shown. G) Indicated human multiple myeloma cell line (HMCL) (n=10) were treated with different doses of Venetoclax (Ven) for 24 hours and cell survival was assessed by CTG. Half maximal inhibitory concentration (IC50) analysis was performed with GraphPad software. n=3 independent experiments. H) Gene set enrichment analysis (GSEA) normalized enriched scores (NES) and false-discovery rate (FDR) q-values for top enriched pathways, according to Reactome gene set, among de-regulated genes of Venetoclax resistant vs. sensitive cell lines; red square indicates the most significant region with splicing-related pathways accumulation (left); examples of GSEA-derived enrichment plots for genes involved in the splicing machinery (right).
Figure 6.
Figure 6.
Splicing inhibitors synergize with Venetoclax in vivo in multiple myeloma xenograf murine models A) MM1S cells (4,5×10⁶ cells/mouse) were implanted in both flanks of female NOD/SCID J mice (8 weeks of age). Tumor-bearing mice were randomized and treated with vehicle (n=10); Venetoclax (100 mg/kg; n=10) administered by oral gavage once a day for 15 days; SD6 (12 mg/kg; n=10) intratumorally once a day for 10 days and their combination (n=10). A significant delay in tumor growth in combination-treated mice was noted compared to vehicle-treated control mice (***P≤0.001). Data are mean tumor volume ± standard error of the mean (SEM). B) At the end of the experiment, mice were sacrificed, and tumor masses were imaged and weighed. (n.s.: not significant, *P≤0.05, **P≤0.01). C) Kaplan-Meier analysis showing significant survival benefit for mice treated with the combo, compared with single-agent treatment SD6 (P=0.0169, Log-rank Mantel-Cox test). D) Histogram pots show caspase 3-positive cells and mitosis observed in 10 observations in tumors harvested from mice treated with indicated stimuli. (*P≤0.05, **P≤0.01). E) Immunohistochemical analysis for hematoxylin and eosin (H&E) and cleaved caspase 3 in xenografts tumors harvested from mice treated with control, SD6, Venetoclax or co-treatment. Tumor sections from treated and untreated mice stained with H&E were also analyzed for apoptotic bodies formation by using higher magnification. Red arrows indicate apoptotic bodies in each panel. Scale bar, 50 µm. F) MM1S xenograft-bearing, 8-week-old female NOD/SCID J mice were treated with vehicle (n=6); E7107 (2.5 mg/kg; n=9) intravenous once a day for 5 days; Venetoclax (100 mg/kg; n=8) oral administration once a day for 5 days and their combination (n=11). A significant delay in tumor growth in co-treated mice was noted compared to E7107-treated control mice (*P=0.0455). Bars indicate mean ± SEM. G) Kaplan-Meier survival plot showing significant increase in survival of mice receiving the combination of E7107 plus Venetoclax compared to E7107 single agent-treated mice (combo vs. E7107 P=0.0295). n indicates the number of tumors per treatment group. Data were analyzed by two-tailed Student’s t-test (A, B, D, F) or by Log-rank Mantel-Cox test (C,G).

References

    1. Palumbo A, Anderson K. Multiple myeloma. N Engl J Med. 2011;364(11):1046-1060. - PubMed
    1. Kumar SK, Rajkumar V, Kyle RA, et al. . Multiple myeloma. Nat Rev Dis Prim. 2017;3(1):17046. - PubMed
    1. Leung-Hagesteijn C, Erdmann N, Cheung G, et al. . Xbp1s-Negative tumor B cells and pre-plasmablasts mediate therapeutic proteasome inhibitor resistance in multiple myeloma. Cancer Cell. 2013;24(3):289-304. - PMC - PubMed
    1. Cea M, Cagnetta A, Adamia S, et al. . Evidence for a role of the histone deacetylase SIRT6 in DNA damage response of multiple myeloma cells. Blood. 2016;127(9):1138-1150. - PMC - PubMed
    1. Soncini D, Minetto P, Martinuzzi C, et al. . Amino acid depletion triggered by ʟ-asparaginase sensitizes MM cells to carfilzomib by inducing mitochondria ROS-mediated cell death. Blood Adv. 2020;4(18):4312-4326. - PMC - PubMed

Publication types

MeSH terms

Substances