. 2021 Oct 20;21(1):477.
doi: 10.1186/s12870-021-03257-2.

Association among starch storage, metabolism, related genes and growth of Moso bamboo (Phyllostachys heterocycla) shoots

Affiliations

Association among starch storage, metabolism, related genes and growth of Moso bamboo (Phyllostachys heterocycla) shoots

Jiajia Zhang et al. BMC Plant Biol. .

Abstract

Background: Both underground rhizomes/buds and above-ground Moso bamboo (Phyllostachys heterocycla) shoots/culms/branches are connected together into a close inter-connecting system in which nutrients are transported and shared among each organ. However, the starch storage and utilization mechanisms during bamboo shoot growth remain unclear. This study aimed to reveal in which organs starch was stored, how carbohydrates were transformed among each organ, and how the expression of key genes was regulated during bamboo shoot growth and developmental stages which should lay a foundation for developing new theoretical techniques for bamboo cultivation.

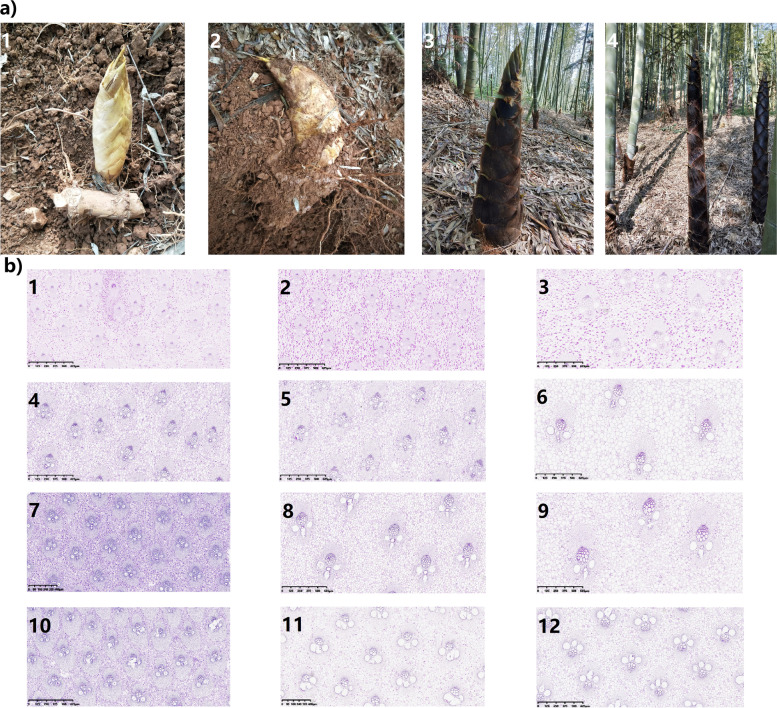
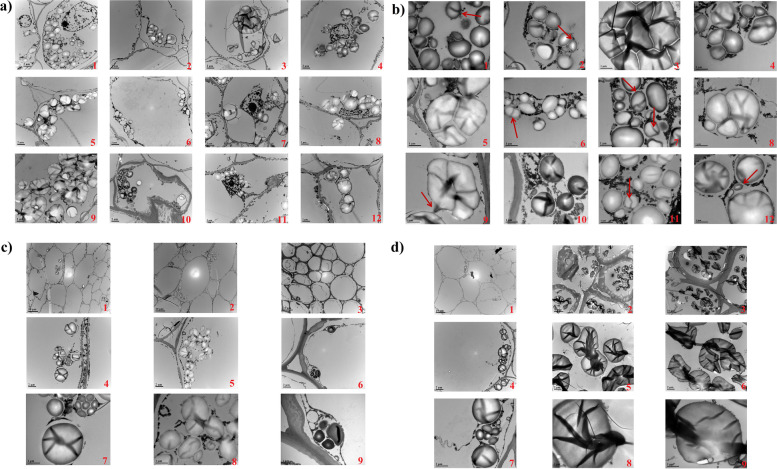
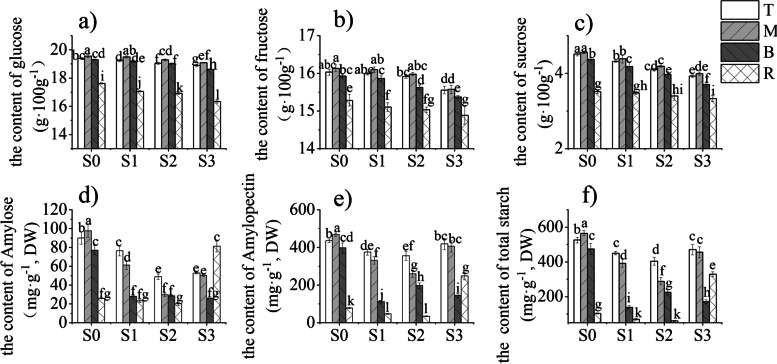
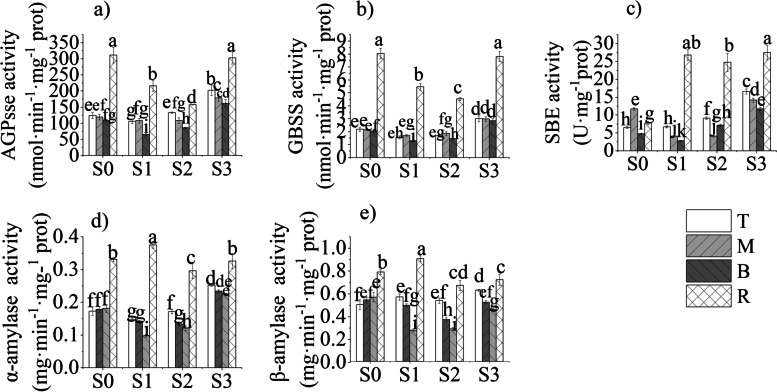
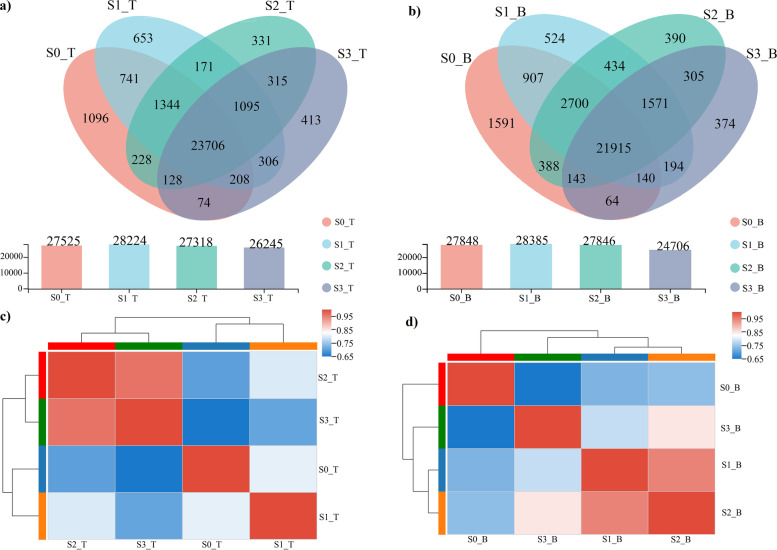
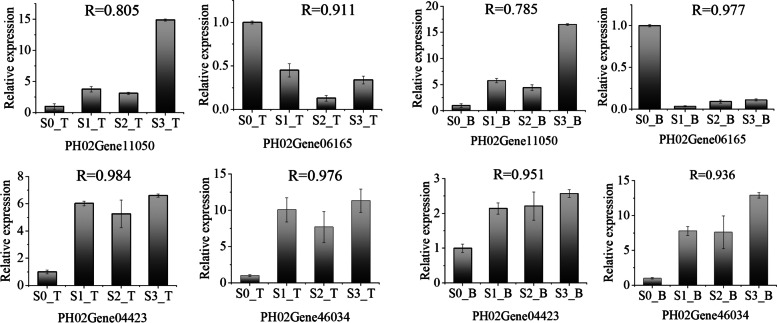
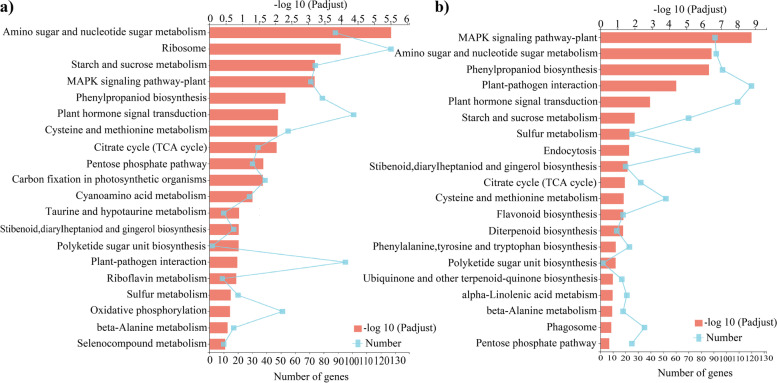
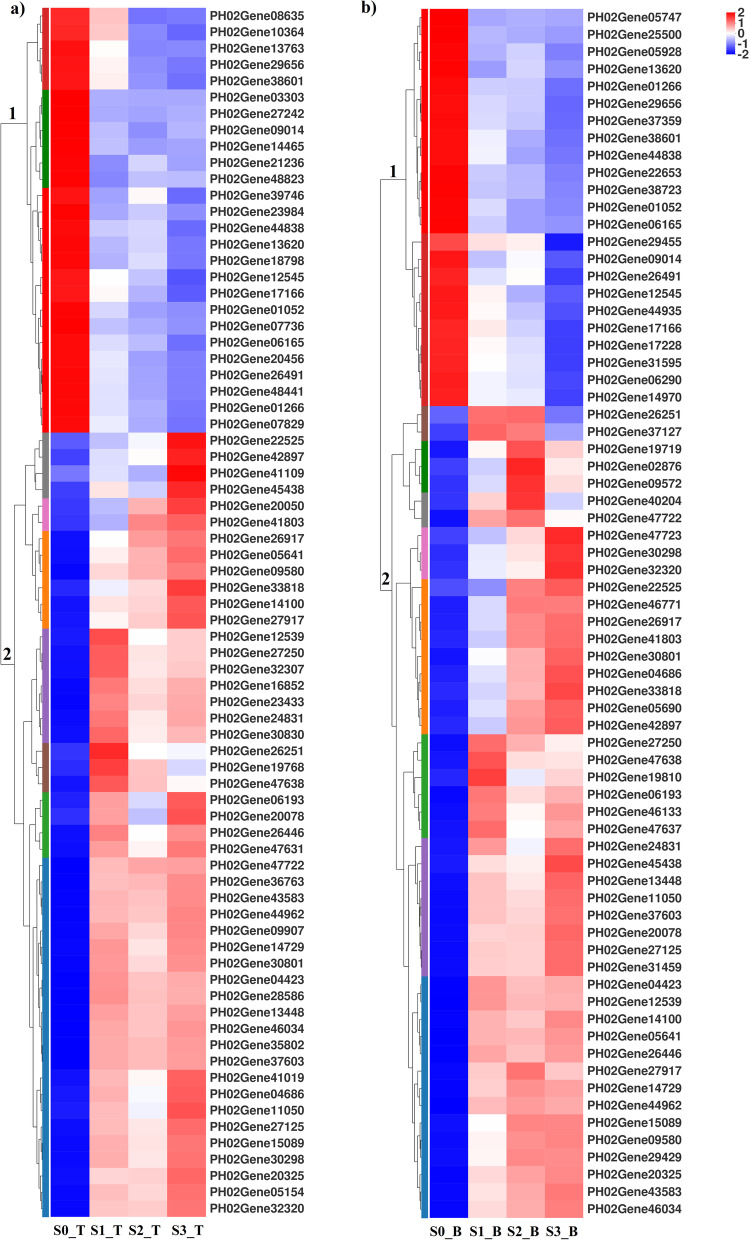
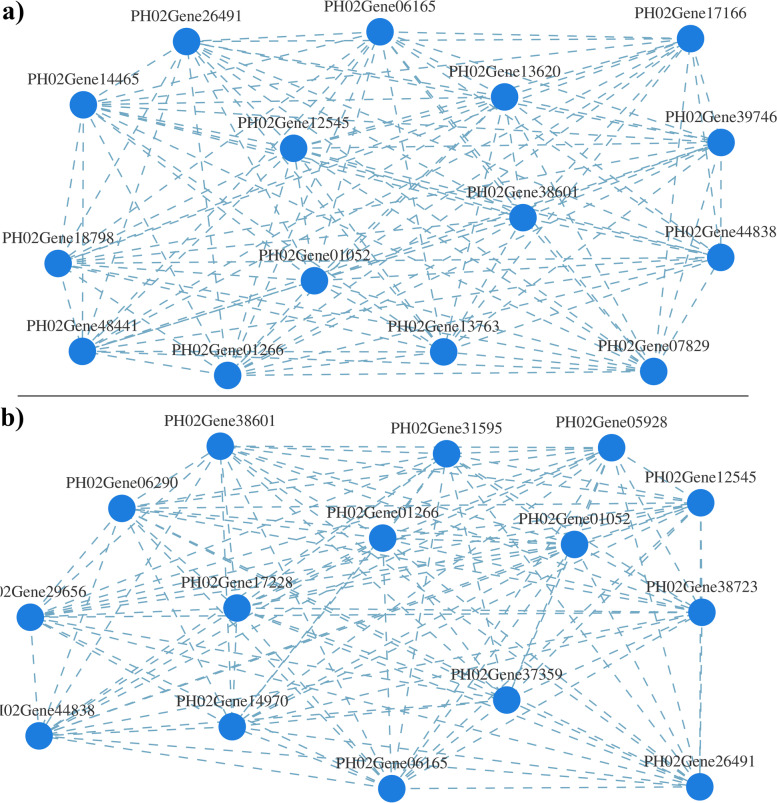
Results: Based on changes of the NSC content, starch metabolism-related enzyme activity and gene expression from S0 to S3, we observed that starch grains were mainly elliptical in shape and proliferated through budding and constriction. Content of both soluble sugar and starch in bamboo shoot peaked at S0, in which the former decreased gradually, and the latter initially decreased and then increased as shoots grew. Starch synthesis-related enzymes (AGPase, GBSS and SBE) and starch hydrolase (α-amylase and β-amylase) activities exhibited the same dynamic change patterns as those of the starch content. From S0 to S3, the activity of starch synthesis-related enzyme and starch amylase in bamboo rhizome was significantly higher than that in bamboo shoot, while the NSC content in rhizomes was obviously lower than that in bamboo shoots. It was revealed by the comparative transcriptome analysis that the expression of starch synthesis-related enzyme-encoding genes were increased at S0, but reduced thereafter, with almost the same dynamic change tendency as the starch content and metabolism-related enzymes, especially during S0 and S1. It was revealed by the gene interaction analysis that AGPase and SBE were core genes for the starch and sucrose metabolism pathway.

Conclusions: Bamboo shoots were the main organ in which starch was stored, while bamboo rhizome should be mainly functioned as a carbohydrate transportation channel and the second carbohydrate sink. Starch metabolism-related genes were expressed at the transcriptional level during underground growth, but at the post-transcriptional level during above-ground growth. It may be possible to enhance edible bamboo shoot quality for an alternative starch source through genetic engineering.

Keywords: AGPase; Growth; Moso bamboo shoots; Rhizomes; SBE; Starch; Starch metabolism-related genes.


Conflict of interest statement

The authors declare that they have no competing interests.

Figures

Fig. 1
Fig. 1
Tissue structure of bamboo shoots at different growth and developmental stages. a Four growth and developmental stages of Moso bamboo shoots (1, S0; 2, S1; 3, S3; 4, S4). b Tissue structure of bamboo shoots stained with PAS (× 4). 1, 4, 7, 10: the top (T) of bamboo shoots of S0, S1, S2, and S3, respectively. 2, 5, 8, 11: the middle (M) bamboo shoots of S0, S1, S2, and S3, respectively. 3, 6, 9, 12: the base (B) of bamboo shoots of S0, S1, S2, and S3, respectively
Fig. 2
Fig. 2
Microstructure analysis of starch in bamboo shoots at different growth and developmental stages. a Distribution of starch granules in the bamboo shoots via TEM (× 8000). The numbering in the upper left corner was the same as that in Fig. 1b. b Starch grain structure of bamboo shoots via TEM (× 25,000). the corresponds to the enlarged version, with arrows pointing to amyloplast proliferation. c Starch distribution of new buds on bamboo rhizomes via TEM. 1, 2, 3: new buds (× 2000) of one-year, two-year- and four-year-old rhizomes, respectively. 4, 5, 6: new buds of one-, two- and four-year-old rhizomes, respectively (× 8000). 7, 8, 9: new buds of one-, two- and four-year-old rhizomes, respectively (× 25,000). d Starch distribution of bamboo rhizomes via TEM. 1, 2, 3: One-r, two- and four-year-old bamboo rhizomes, respectively (× 2000). 4, 5, 6: One-, two- and four-year-old bamboo rhizomes, respectively (× 8000). 7, 8, 9: One-, two- and four-year-old bamboo rhizomes, respectively (× 25,000)
Fig. 3
Fig. 3
The contents of NSCs in different parts of Moso bamboo shoots at four growth and developmental stages. The different letters in each graph indicate significant differences at p < 0.05
Fig. 4
Fig. 4
Dynamic changes in starch metabolism enzymes in Moso bamboo shoots and their connected rhizomes. a AGPase activity. b GBSS activity, c SBE activity. d α-Amylase activity. e β-Amylase activity. The different letters in each graph indicate significant differences at p < 0.05
Fig. 5
Fig. 5
Overview of gene expression in Moso bamboo shoots at four growth and developmental stages. a Venn diagram of gene expression at the top of bamboo shoots at four growth and developmental stages. b Venn diagram of gene expression in the base of bamboo shoots at four growth and developmental stages. c Correlation heatmap of the top part of bamboo shoots at four growth and developmental stages. d Correlation heatmap of bamboo shoot basal parts at four growth and developmental stages. Each oval area of different colours in the Venn diagram represents the genes screened based on the expression level at the respective growth stage, and the data show the numbers of shared and specific genes at the different growth and developmental stages. The sum of all the numbers inside the oval represents the total number of genes at the respective growth stage. The numbers in intersecting regions show the number of shared genes at those stages. In the heatmaps, the right and lower sides represent bamboo shoots at different growth and developmental stages, while the left and upper sides represent sample clusters. The blocks of different colours indicate the correlations between any two growth and developmental stages
Fig. 6
Fig. 6
Verification of DEGs via qRT-PCR. The relative amount of mRNA (y-axis) is the ratio normalized to the amount of ACT (Actin) mRNA. The bamboo shoot growth and developmental stages are on shown on the x-axis. R indicates the correlation coefficient of the expression between the RNA-seq and qRT-PCR data (p < 0.05). The expression of each gene in S0 was set at 1.0
Fig. 7
Fig. 7
KEGG enrichment analysis of genes during Moso bamboo shoot growth and development a KEGG enrichment analysis of genes expressed in the top part of bamboo shoots. b KEGG enrichment analysis of genes expressed in the basal part of bamboo shoots. The vertical axis represents the KEGG pathways. The upper horizontal axis represents the number of genes aligned to a pathway, corresponding to the different points on the broken line. The lower horizontal axis represents the enrichment significance, corresponding to the lengths of the column. The lower the FDR is and the higher the -log10 (padjust) value is, the more significant the enrichment of the KEGG pathway
Fig. 8
Fig. 8
Expression of genes encoding starch and sucrose metabolism pathway in bamboo shoots at four growth and developmental stages. a Expression of genes involved in starch and sucrose metabolism pathway in the top part of bamboo shoots. b Expression of genes involved in starch and sucrose metabolism pathway in the basal part of bamboo shoots. Each column in the diagram represents a growth stage, and each row refers to a gene. The colours in the diagram show the expression values of each gene at every stage after the standardized process. The red colour indicates relatively high expression of the gene at that stage, while the blue colour indicates relatively low expression. The digits below the upper-right colour bar refer to the detailed variation tendency of expressed genes. On the left is the tree diagram of gene clusters and the block diagram of sub-clusters. On the right is the gene names. The closer two gene branches are, the more similar their expression levels
Fig. 9
Fig. 9
Gene co-expression network analysis. a Gene co-expression network analysis of the top part of bamboo shoots. b Gene co-expression network analysis of the basal part of bamboo shoots. Each node in the diagram represents a gene. Usually, the higher the node connectivity is (many nodes were connected to it), the more important the node

References

    1. Ramirez JA, Posada JM, Handa IT, Hoch G, Vohland M, Messier C, et al. Near-infrared spectroscopy (NIRS) predicts non-structural carbohydrate concentrations in different tissue types of a broad range of tree species. Methods Ecol Evol. 2015;6(9):1018–1025. doi: 10.1111/2041-210X.12391. - DOI
    1. Dobbelstein E, Fink D, Öner-Sieben S, Czempik L, Lohaus G. Seasonal changes of sucrose transporter expression and sugar partitioning in common European tree species. Tree Physiol. 2019;39(2):284–299. doi: 10.1093/treephys/tpy120. - DOI - PubMed
    1. Scofield GN, Ruuska SA, Aoki N, Lewis DC, Tabe LM, Jenkins CLD. Starch storage in the stems of wheat plants: localization and temporal changes. Ann Bot-London. 2009;103(6):859–868. doi: 10.1093/aob/mcp010. - DOI - PMC - PubMed
    1. Saripalli G, Gupta PK. AGPase: its role in crop productivity with emphasis on heat tolerance in cereals. Theor Appl Genet. 2015;128(10):1893–1916. doi: 10.1007/s00122-015-2565-2. - DOI - PubMed
    1. Lu H, Hu Y, Wang C, Liu W, Ma G, Han Q, et al. Effects of high temperature and drought stress on the expression of gene encoding enzymes and the activity of key enzymes involved in starch biosynthesis in wheat grains. Front Plant Sci. 2019;10:1414. - PMC - PubMed

MeSH terms

LinkOut - more resources