. 2021 Oct 26;118(43):e2110934118.
doi: 10.1073/pnas.2110934118.

Optogenetic stimulation of glutamatergic neurons in the cuneiform nucleus controls locomotion in a mouse model of Parkinson's disease

Affiliations

Optogenetic stimulation of glutamatergic neurons in the cuneiform nucleus controls locomotion in a mouse model of Parkinson's disease

Maxime Fougère et al. Proc Natl Acad Sci U S A. .

Abstract

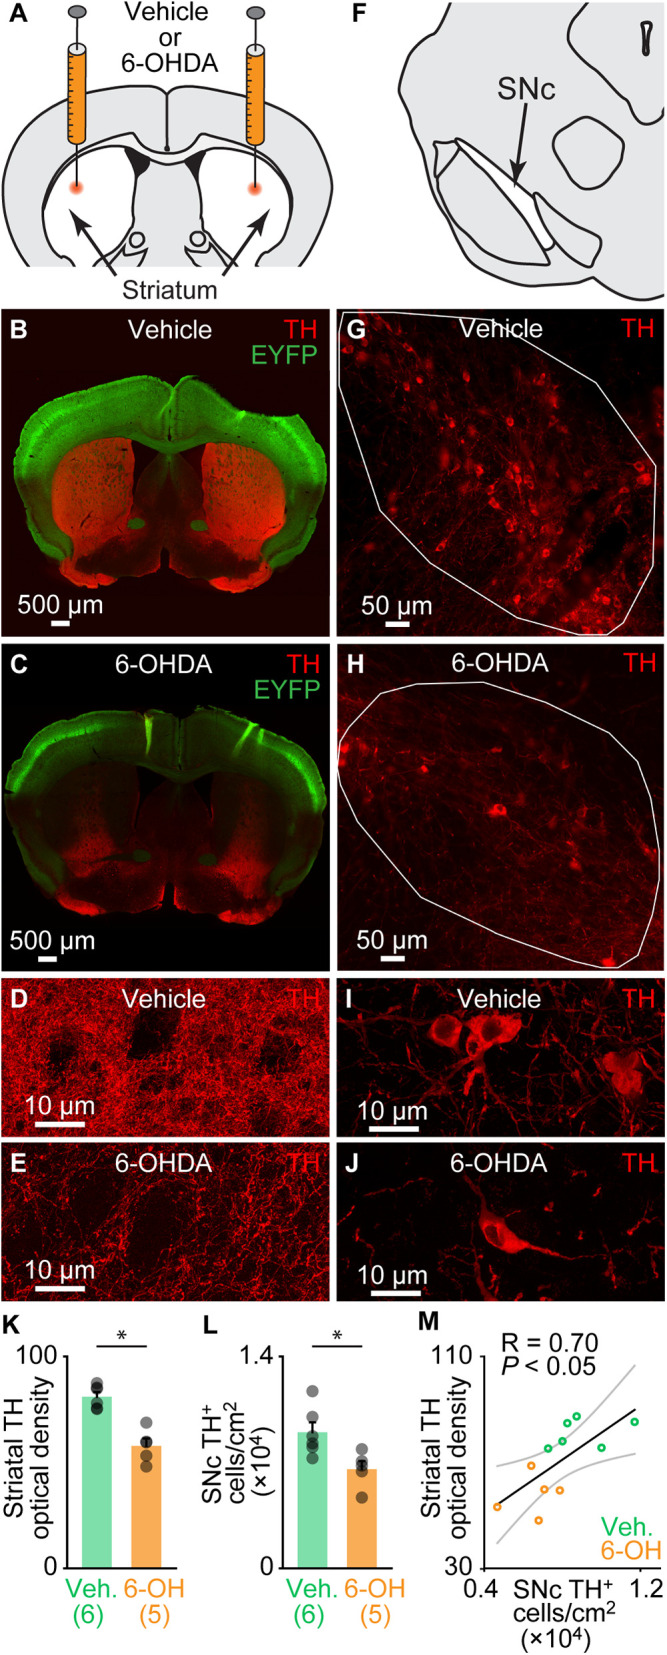
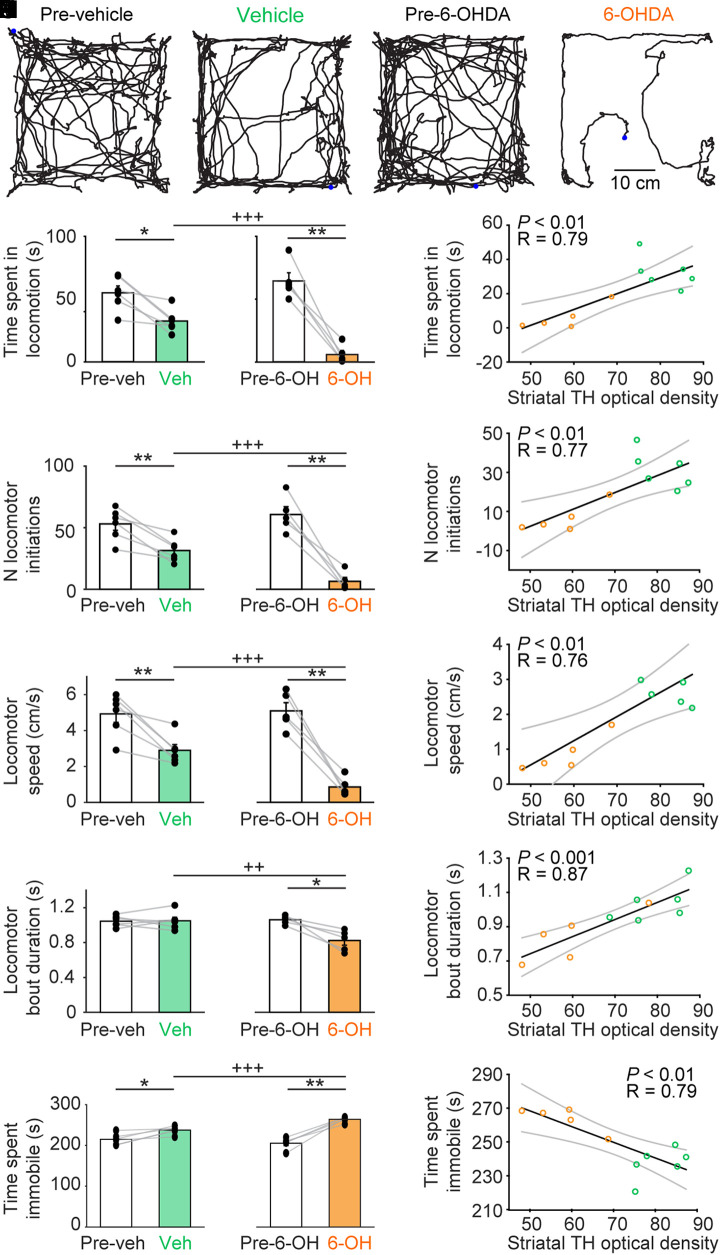
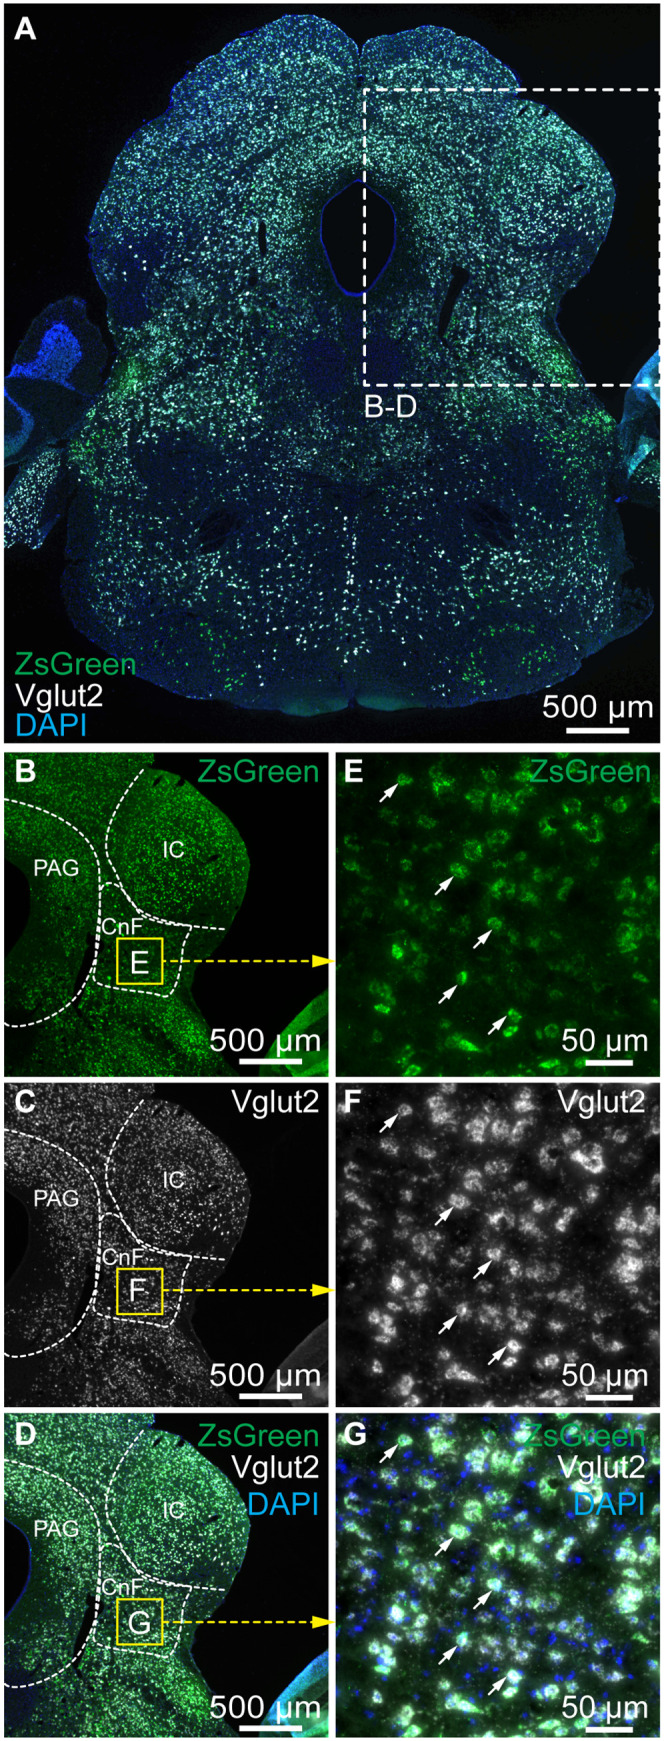
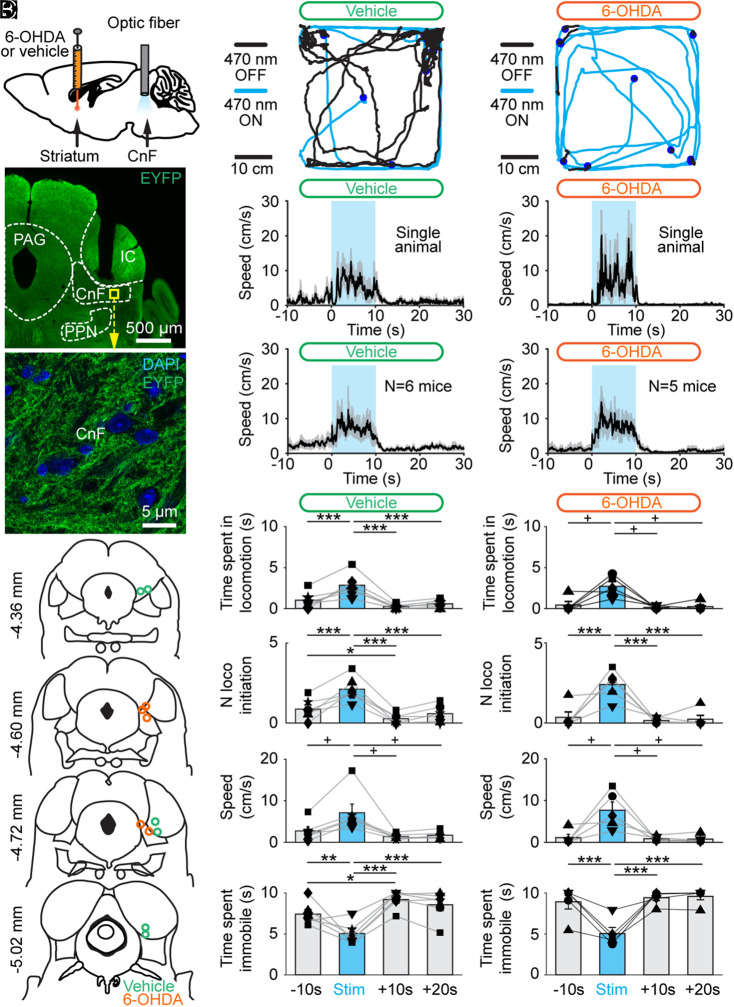
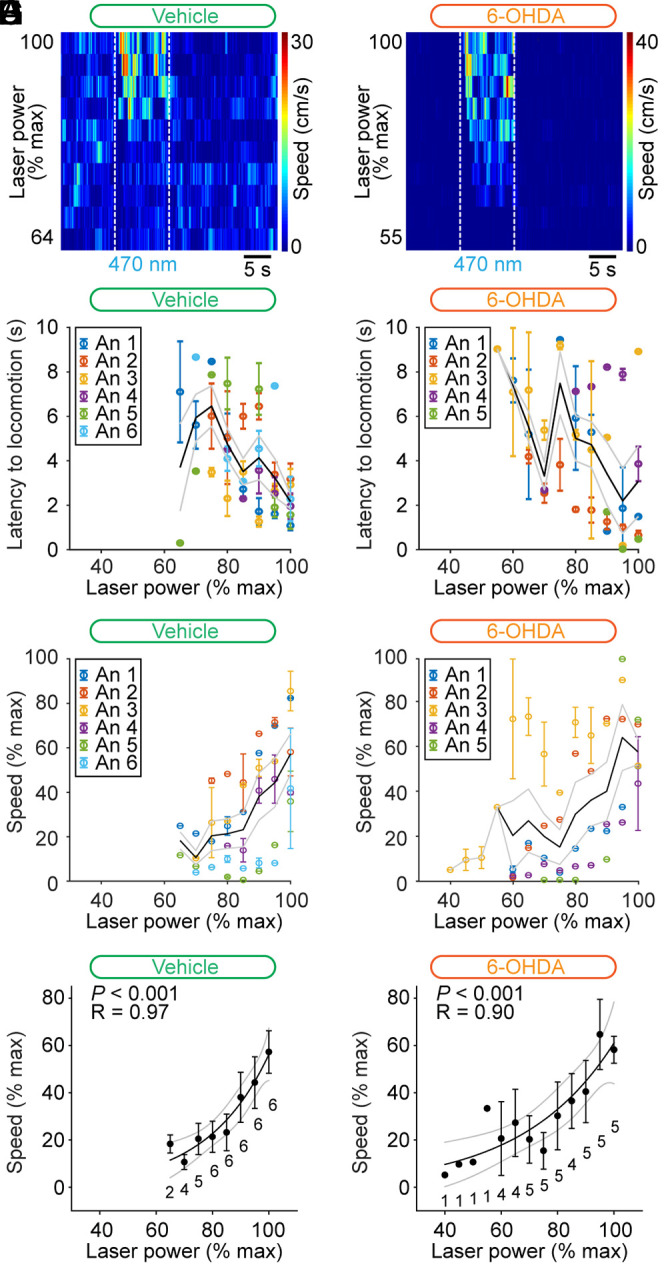
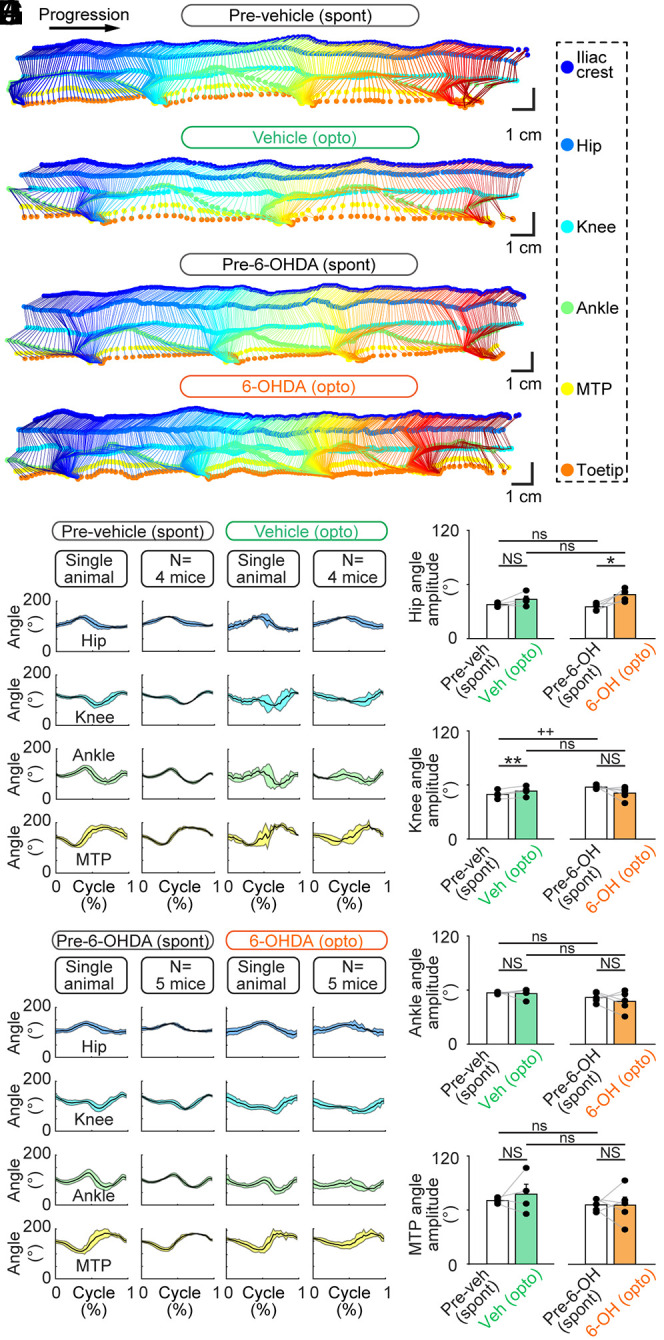
In Parkinson's disease (PD), the loss of midbrain dopaminergic cells results in severe locomotor deficits, such as gait freezing and akinesia. Growing evidence indicates that these deficits can be attributed to the decreased activity in the mesencephalic locomotor region (MLR), a brainstem region controlling locomotion. Clinicians are exploring the deep brain stimulation of the MLR as a treatment option to improve locomotor function. The results are variable, from modest to promising. However, within the MLR, clinicians have targeted the pedunculopontine nucleus exclusively, while leaving the cuneiform nucleus unexplored. To our knowledge, the effects of cuneiform nucleus stimulation have never been determined in parkinsonian conditions in any animal model. Here, we addressed this issue in a mouse model of PD, based on the bilateral striatal injection of 6-hydroxydopamine, which damaged the nigrostriatal pathway and decreased locomotor activity. We show that selective optogenetic stimulation of glutamatergic neurons in the cuneiform nucleus in mice expressing channelrhodopsin in a Cre-dependent manner in Vglut2-positive neurons (Vglut2-ChR2-EYFP mice) increased the number of locomotor initiations, increased the time spent in locomotion, and controlled locomotor speed. Using deep learning-based movement analysis, we found that the limb kinematics of optogenetic-evoked locomotion in pathological conditions were largely similar to those recorded in intact animals. Our work identifies the glutamatergic neurons of the cuneiform nucleus as a potentially clinically relevant target to improve locomotor activity in parkinsonian conditions. Our study should open avenues to develop the targeted stimulation of these neurons using deep brain stimulation, pharmacotherapy, or optogenetics.

Keywords: Parkinson’s disease; Vglut2; cuneiform nucleus; locomotion; optogenetics.


Conflict of interest statement

The authors declare no competing interest.

Figures

Fig. 1.
Fig. 1.
Bilateral striatal injection of 6-OHDA disrupts the nigrostriatal pathway. (A) Schematic illustration of the injection of 6-OHDA in the striatum (5 mg/mL, 1 μL per side; see Materials and Methods). (B and C) Comparison of striatal innervation by TH-positive fibers in a Vglut2-ChR2-EYFP mouse 3 d after bilateral striatal injections of vehicle (see Materials and Methods) (B) and in another one 3 d after bilateral striatal 6-OHDA injections (C). (D and E) Magnification showing TH immunofluorescence in the striatum of an animal injected with vehicle (D) or with 6-OHDA (E). (F) Schematic illustration of the location of TH-positive neurons in the SNc. (G and H) Comparison of the presence of the TH-positive cells in the SNc (delineated by the solid white lines), in a mouse injected in the striatum with vehicle (G) and another injected with 6-OHDA (H). (I and J) Magnification showing TH immunofluorescence in the SNc of an animal injected with vehicle (I) or with 6-OHDA (J). (K) Bar chart illustrating the optical density of TH immunofluorescence in the striatum of mice injected with vehicle (Veh) versus mice injected with 6-OHDA (6-OH). The number of animals used is indicated between brackets. *P < 0.05, t test. (L) Bar chart illustrating the average bilateral number of TH-positive cells per surface unit in the SNc (two slices counted per mouse; see Materials and Methods). *P < 0.05, t test. (M) Relationship between the number of TH-positive cells per surface unit and the striatal TH optical density in the pooled dataset (n = 11, including six mice injected with vehicle, green circles, and five injected with 6-OHDA, orange circles). *P < 0.05, linear fit. The coefficient of correlation (R), its significance (P), and the CIs (gray) are illustrated.
Fig. 2.
Fig. 2.
Bilateral striatal injection of 6-OHDA reduces locomotor activity in the open-field arena. (AD) Locomotor activity recorded from above in the open-field arena during a single trial of 4.5 min before and after bilateral striatal injection of vehicle (A and B) or 6-OHDA (C and D). The blue point illustrates the animal’s position at the beginning of the trial. (EI) Comparison of locomotor parameters in the open-field arena in six animals injected in the striatum with vehicle (Veh) and five animals injected with 6-OHDA (6-OH) (seven trials recorded per animal). (E) Time spent in locomotion (i.e., total time duration during which locomotor speed is higher than 3 cm/s for at least 0.5 s). (F) Number (N) of locomotor initiations (i.e., number of times when speed is higher than 3 cm/s for at least 0.5 s). (G) Locomotor speed in centimeters per second. (H) Locomotor bout duration (i.e., time duration during which locomotor speed is higher than 3 cm/s for at least 0.5 s). (I) Time spent immobile, with immobility defined as total time without locomotion. (JN) Linear relationships between the striatal optical density of TH immunofluorescence and the locomotor parameters described in EI. For each fit, the coefficient of correlation (R), its significance (P), and the CIs (gray) are illustrated. Mice injected with vehicle appear as green circles; those injected with 6-OHDA as orange circles. *P < 0.05, **P < 0.01, paired tests; ++P < 0.01, +++P < 0.001, t tests.
Fig. 3.
Fig. 3.
ZsGreen-positive cells in the cuneiform nucleus express the vesicular glutamatergic transporter 2 (Vglut2) mRNA in Vglut2-ZsGreen mice. (A) Coronal brainstem slices from a Vglut2-ZsGreen mouse at the level of the cuneiform nucleus, showing the mRNAs of ZsGreen (green), Vglut2 (white) revealed by RNAscope experiments, and a coloration of the nuclear marker DAPI (blue). (BD) Magnification of the slice in A, showing the location of the two markers in the cuneiform nucleus. (EG) Magnification of the yellow squares in B–D, showing many examples of cells coexpressing Vglut2 and ZsGreen mRNAs (white arrows) in the cuneiform nucleus. CnF, cuneiform nucleus; IC, inferior colliculus; PAG, periaqueductal gray.
Fig. 4.
Fig. 4.
Optogenetic stimulation of the CnF increases locomotor activity in Vglut2-ChR2-EYFP mice lesioned with 6-OHDA. (A) Vglut2-ChR2-EYFP mice were either injected in the striatum with vehicle or 6-OHDA (see Materials and Methods) and implanted ∼500 μm above the right CnF with an optic fiber. After 3 d, the effects of optogenetic stimulation of the CnF were tested in the open-field arena. (B) Photomicrograph showing the position of the optic fiber right above the CnF. (C) Magnification of the yellow square in B, showing the expression of ChR2-EYFP at the level of the CnF. IC, inferior colliculus; PAG, periaqueductal gray; PPN, pedunculopontine nucleus. (D) Location of the optic fibers after the histology of mice injected in the striatum with vehicle (green circles) or 6-OHDA (orange circles). (E and F) Raw data showing the effects of CnF optogenetic stimulation with a 470-nm laser in a mouse injected in the striatum with vehicle (E) (10 s train, 20 Hz, 10 ms pulses, and 5% of laser power), or with a 470-nm laser in a mouse injected in the striatum with 6-OHDA (F) (10% of laser power). (G and I) Locomotor speed (mean ± SEM) before, during, and after a 10-s optogenetic stimulation (onset at t = 0 s) with a 470-nm laser in a single animal (G) (5% of laser power) or in a pool of six animals injected in the striatum with vehicle (I) (10 stimulations per animal and 5 to 20% of laser power). (H and J) Locomotor speed (mean ± SEM) before, during, and after a 10-s optogenetic stimulation (onset at t = 0 s) with a 470-nm laser in a single animal (H) (10% of laser power) or in a pool of five animals injected in the striatum with 6-OHDA (J) (10 stimulations per animal and 5 to 20% of laser power). (K–R) Evolution of locomotor parameters before (−10 to 0 s), during (0 to 10 s), and after (10 to 20 s and 20 to 30 s) optogenetic stimulation of the CnF with a 470-nm laser in six animals injected in the striatum with vehicle (K, M, O, and Q) and in five animals injected with 6-OHDA (L, N, P, and R). *P < 0.05, **P < 0.01, ***P < 0.001, Student–Newman–Keuls test after a one-way ANOVA for repeated measures (P < 0.001 in K, M, N, Q, and R). +P < 0.05, Student–Newman–Keuls test after a Friedman repeated measures ANOVA on ranks (P < 0.05 in L and P; P < 0.01 in O).
Fig. 5.
Fig. 5.
Control of speed by glutamatergic neurons of the CnF in Vglut2-ChR2-EYFP mice lesioned with 6-OHDA. (A and B) Color plots illustrating increases in locomotor speed in the open-field arena during optogenetic stimulation of the CnF in an animal injected in the striatum with vehicle (A) (3.2 to 5.0% of laser power) or with 6-OHDA (B) (5.5 to 10.0% of laser power). (C and D) Latency to locomotor initiation as a function of laser power (vehicle: 3.2 to 15.5% of laser power and 6-OHDA: 4.5 to 20.0% of laser power). Each dot represents the latency (mean ± SEM) measured during one to three trials. Laser power was normalized as a function of its maximal value per animal (% max) with a bin size of 5%. The average latency (solid black line) and the SEM (gray solid lines) are illustrated. The data from each animal (An) are illustrated with a different color. (E and F) Locomotor speed (0.3 to 23.5 cm/s in E and 0.2 to 30.9 cm/s in F) as a function of laser power (vehicle: 3.2 to 15.5% of laser power and 6-OHDA: 3.8 to 20.0% of laser power). Each dot represents the speed (mean ± SEM) measured during one to three trials. Speed and laser power were normalized as a function of their % max with a bin size of 5%. The average speed (solid black line) and the SEM (gray solid lines) are illustrated. The data from each animal are illustrated with a different color. (G and H) Relationships between locomotor speed (mean ± SEM and bin width 5%) and laser power in the same animals shown in E and F. For each bin, the number of animals is indicated below the data point. The data followed a sigmoidal function, both in the six animals injected in the striatum with vehicle (G) (solid black line, R = 0.97, and P < 0.001) and in the five animals injected with 6-OHDA (H) (solid black line, R = 0.90, and P < 0.001). For each fit, the coefficient of correlation (R), its significance (P), and the CIs (gray) are illustrated.
Fig. 6.
Fig. 6.
Hindlimb kinematics evoked by optogenetic stimulation of the CnF in Vglut2-ChR2-EYFP mice lesioned with 6-OHDA. (AD) The movements of six hindlimb joints were tracked from the side at 300 fps in a linear corridor during spontaneous locomotion (spont) before the striatal injection of vehicle (A) or 6-OHDA (C), and during optogenetic-evoked locomotion (opto) after vehicle injection (B) (6.4% of laser power) or 6-OHDA (D) (30% of laser power). (E and F) The joint angles at the hip, knee, ankle, and MTP joint levels were calculated frame by frame. The cycle was defined as the time duration between two consecutive touchdowns of the MTP. A speed threshold of 9 cm/s was used to define the transitions between swing and stance phases. For single-animal data, joint angles (mean ± SD) were plotted for a normalized locomotor cycle during spontaneous locomotion before vehicle (E) (31 steps) or before 6-OHDA injection (F) (30 steps) and during optogenetic-evoked locomotion after striatal vehicle injection (E) (8 steps and 6.4% of laser power) or after striatal 6-OHDA injection (F) (32 steps and 10% of laser power). For the pooled data, joint angles (mean ± SD) were plotted for a normalized locomotor cycle during spontaneous locomotion before vehicle injection (E) (31 to 39 steps per animal) or before 6-OHDA injection (F) (28 to 34 steps per animal) and during optogenetic-evoked locomotion after vehicle injection (E) (3 to 19 steps per animal and 5.2 to 20.0% of laser power) and during optogenetic-evoked locomotion after 6-OHDA injection (F) (3 to 32 steps per animal and 5 to 30% of laser power). (GJ) Comparison of the amplitude of the hip (G), knee (H), ankle (I), and MTP (J) angles during spontaneous locomotion before vehicle (Veh) or 6-OHDA (6-OH) injection and during optogenetic-evoked locomotion after vehicle or 6-OHDA injection (vehicle, n = 6 mice and 6-OHDA, n = 5 mice). NS: not significant, P > 0.05, *P < 0.05, **P < 0.01, paired t tests; ns: not significant, P > 0.05, ++P < 0.01, t test, or Mann–Whitney rank sum test.

References

    1. Bloem B. R., Hausdorff J. M., Visser J. E., Giladi N., Falls and freezing of gait in Parkinson’s disease: A review of two interconnected, episodic phenomena. Mov. Disord. 19, 871–884 (2004). - PubMed
    1. Hirsch E. C., Graybiel A. M., Duyckaerts C., Javoy-Agid F., Neuronal loss in the pedunculopontine tegmental nucleus in Parkinson disease and in progressive supranuclear palsy. Proc. Natl. Acad. Sci. U.S.A. 84, 5976–5980 (1987). - PMC - PubMed
    1. Zweig R. M., et al. ., Loss of pedunculopontine neurons in progressive supranuclear palsy. Ann. Neurol. 22, 18–25 (1987). - PubMed
    1. Jellinger K., The pedunculopontine nucleus in Parkinson’s disease, progressive supranuclear palsy and Alzheimer’s disease. J. Neurol. Neurosurg. Psychiatry 51, 540–543 (1988). - PMC - PubMed
    1. Rinne J. O., Ma S. Y., Lee M. S., Collan Y., Röyttä M., Loss of cholinergic neurons in the pedunculopontine nucleus in Parkinson’s disease is related to disability of the patients. Parkinsonism Relat. Disord. 14, 553–557 (2008). - PubMed

Publication types

Grants and funding

LinkOut - more resources