. 2021 Oct 26;118(43):e2113929118.
doi: 10.1073/pnas.2113929118.

The translatome of neuronal cell bodies, dendrites, and axons

Affiliations

The translatome of neuronal cell bodies, dendrites, and axons

Caspar Glock et al. Proc Natl Acad Sci U S A. .

Abstract

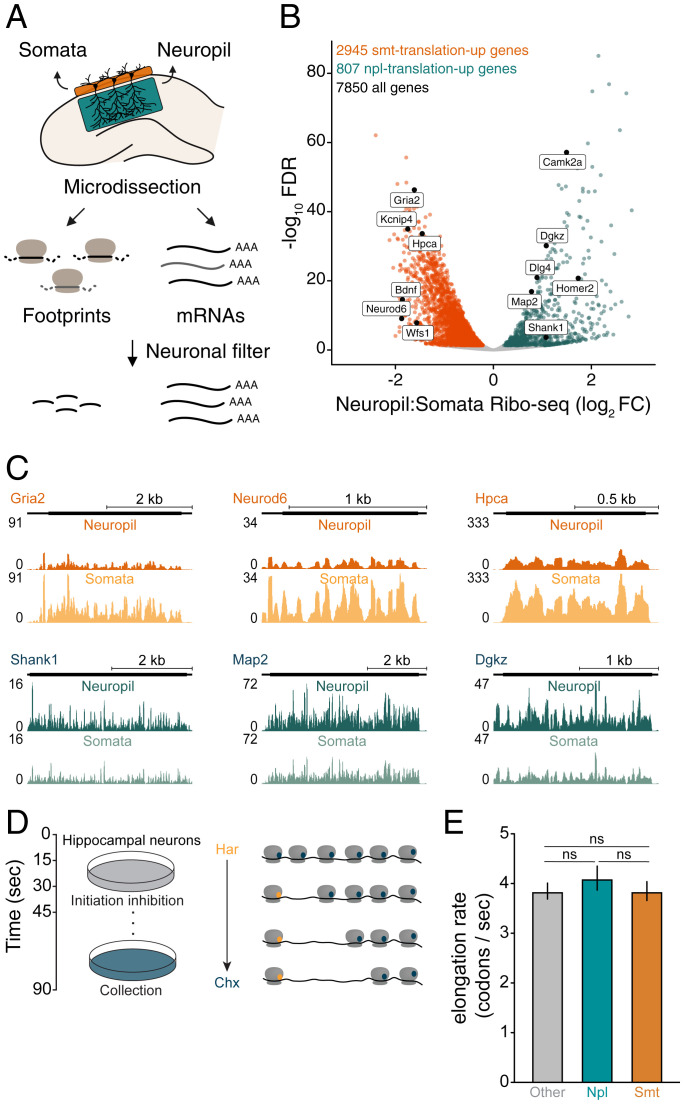
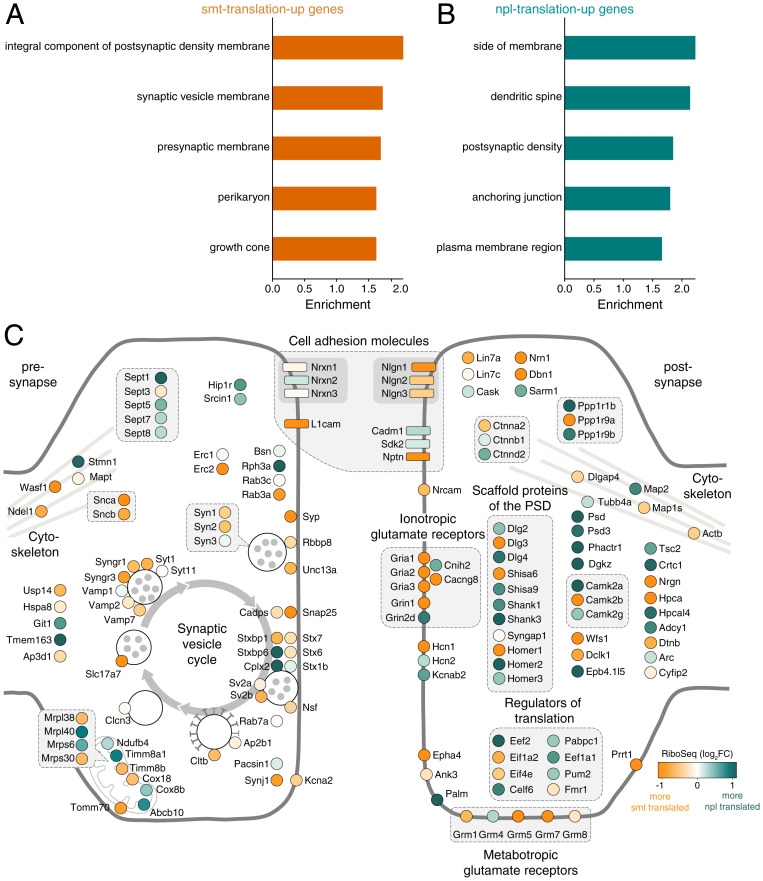
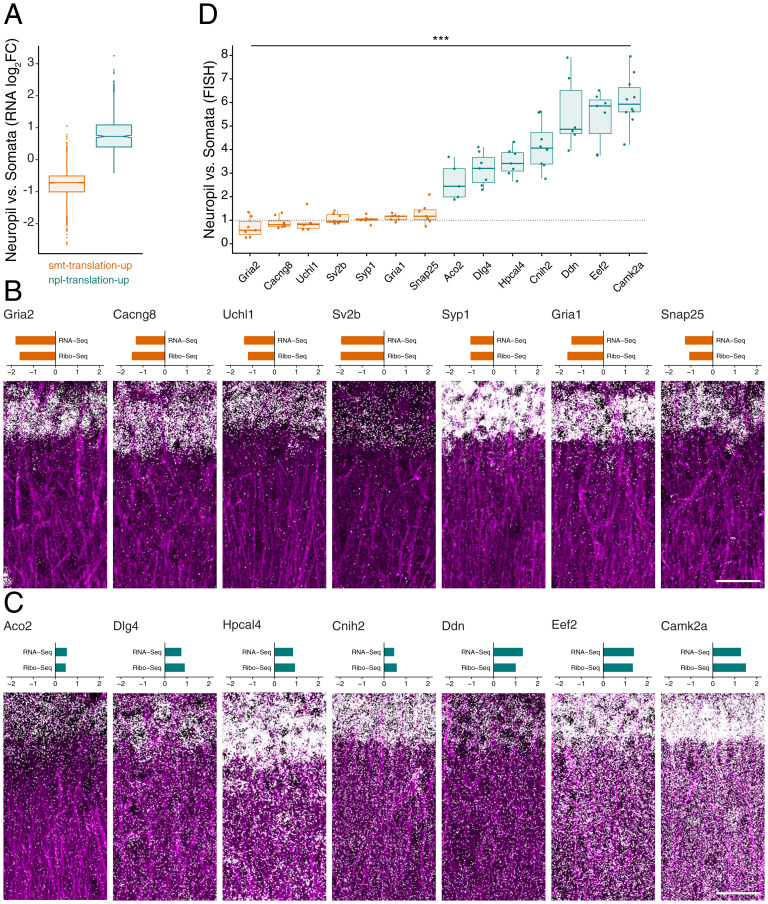
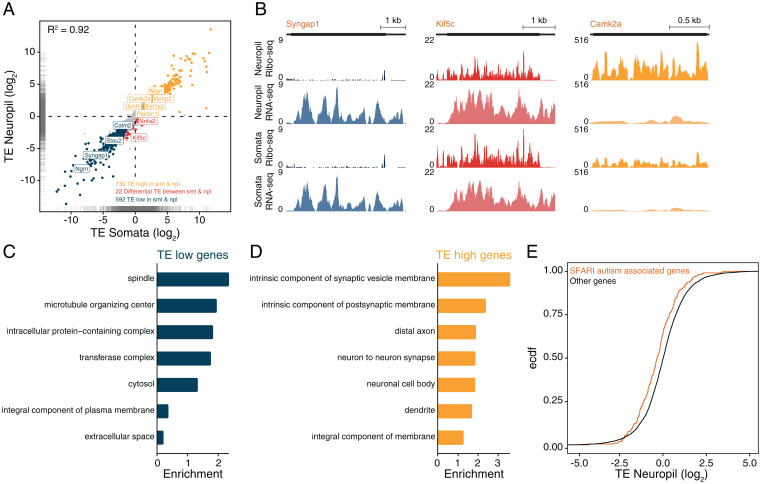
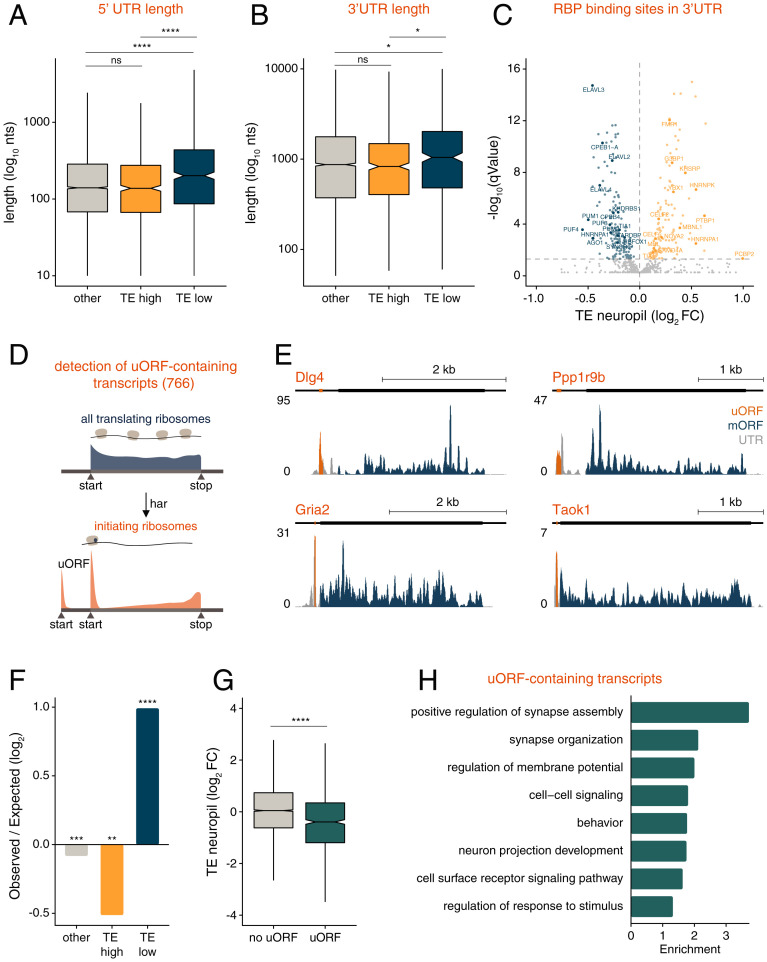
To form synaptic connections and store information, neurons continuously remodel their proteomes. The impressive length of dendrites and axons imposes logistical challenges to maintain synaptic proteins at locations remote from the transcription source (the nucleus). The discovery of thousands of messenger RNAs (mRNAs) near synapses suggested that neurons overcome distance and gain autonomy by producing proteins locally. It is not generally known, however, if, how, and when localized mRNAs are translated into protein. To investigate the translational landscape in neuronal subregions, we performed simultaneous RNA sequencing (RNA-seq) and ribosome sequencing (Ribo-seq) from microdissected rodent brain slices to identify and quantify the transcriptome and translatome in cell bodies (somata) as well as dendrites and axons (neuropil). Thousands of transcripts were differentially translated between somatic and synaptic regions, with many scaffold and signaling molecules displaying increased translation levels in the neuropil. Most translational changes between compartments could be accounted for by differences in RNA abundance. Pervasive translational regulation was observed in both somata and neuropil influenced by specific mRNA features (e.g., untranslated region [UTR] length, RNA-binding protein [RBP] motifs, and upstream open reading frames [uORFs]). For over 800 mRNAs, the dominant source of translation was the neuropil. We constructed a searchable and interactive database for exploring mRNA transcripts and their translation levels in the somata and neuropil [MPI Brain Research, The mRNA translation landscape in the synaptic neuropil. https://public.brain.mpg.de/dashapps/localseq/ Accessed 5 October 2021]. Overall, our findings emphasize the substantial contribution of local translation to maintaining synaptic protein levels and indicate that on-site translational control is an important mechanism to control synaptic strength.

Keywords: RNA localization; dendrites; local protein synthesis; translatome.


Conflict of interest statement

The authors declare no competing interest.

Figures

Fig. 1.
Fig. 1.
Many transcripts display differential translation between the somata and neuropil. (A) Experimental workflow. Microdissection of the CA1 region of the rat hippocampus. RNA-seq and Ribo-seq were conducted simultaneously for the somata (enriched in pyramidal neuron cell bodies) and the neuropil (enriched in dendrites and axons) layers. A neuronal filter was applied to enrich for excitatory neuron transcripts in downstream analyses. (B) Volcano plot comparing the translational level of 7,850 transcripts between compartments (neuropil:somata Ribo-seq ratio [log2FC]). FDR < 0.05 using DESeq2 (Experimental Procedures). Colored dots highlight the transcripts significantly more translated in the somata (somata [smt]-translation-up, n = 2,945, orange) or neuropil (neuropil [npl]-translation-up, n = 807, teal). (C) Coverage tracks representing the average neuropil (Top) or somata (Bottom) ribosome footprint coverage for candidate smt-translation-up (Gria2, Neurod6, and Hpca) and npl-translation-up (Shank1, Map2, and Dgkz) transcripts. The y axis indicates the number of normalized reads. (D) Schematic depicting in vivo ribosome run-off following harringtonine incubation of rat hippocampal cultures. (E) Elongation rates for smt-translation-up (orange), npl-translation-up (teal), and other (gray) transcripts inferred from the slope of the linear fit shown in SI Appendix, Fig. S4 are plotted with their SE (n = 3). P = 0.5738, One-way ANOVA. Har, harringtonine; Chx, cycloheximide; ns, not significant.
Fig. 2.
Fig. 2.
Functional segregation of transcripts differentially translated between the somata and neuropil. (A and B) GO terms representing the top five highest significantly enriched (FDR < 0.05) protein function groups for somata-translation-up (A) and neuropil-translation-up (B) transcripts. (C) Scheme depicting proteins of glutamatergic synapses. Ribo-seq neuropil:somata ratios (log2FC) are color coded from orange (more somata-translated) to teal (more neuropil-translated). Interacting proteins are displayed in closer proximity. Proteins with similar functions are grouped together and the synaptic vesicle cycle is indicated by arrows.
Fig. 3.
Fig. 3.
Differential translation of neuropil- and somata-translation-up genes is accompanied by between-compartment changes in RNA levels. (A) Box plot representing the neuropil:somata RNA-seq ratio (log2FC) for somata (smt)-translation-up (orange) and neuropil (npl)-translation-up (teal) genes (DESeq2; Experimental Procedures). (B and C) (Top) Neuropil:somata RNA-and Ribo-seq ratios (log2FC) for candidate smt-translation-up genes (Gria2, Cacng8, Uchl1, Sv2b, Syp1, Gria1, and Snap25) (B) and npl-translation-up genes (Aco2, Dlg4, Hpcal4, Cnih2, Ddn, Eef2, and Camk2a) (C). (Bottom) FISH signal in the CA1 region of rat hippocampal slices using probes against smt- (B) and npl-translation-up (C) candidate genes. The dendrites were immunostained with an anti-MAP2 antibody (purple). (Scale bar, 50 μm.) (D) Neuropil:somata ratio of mRNA puncta relative to the mean neuropil:somata ratio of the smt-translation-up genes (***P < 2.2e-16, Mann–Whitney U Test between all smt-translation-up and all npl-translation-up genes).
Fig. 4.
Fig. 4.
Most transcripts exhibit similar translational efficiency in the somata and neuropil. (A) Correlation of the translational efficiencies (TE; log2Ribo-Seq/RNA-seq) in the neuropil and somata (R2 = 0.92, P < 2.2e-16). Highlighted are genes with significantly higher (TEhigh, yellow) or lower (TElow, blue) TE than log2 1.5 (FDR < 0.05, DESeq2) in both somata and neuropil. Genes with significantly differential TE between somata and neuropil are shown in red. DESeq2 with FDR <0.05. Marginal rug (gray) represents the distribution of the TE values in the somata (x axis) and neuropil (y axis). (B) Coverage tracks representing the average ribosome footprint or RNA coverage for candidate genes (Syngap1, Kif5c, and Camk2a) in the neuropil and somata. The y axis indicates reads per million (RPM). (C and D) GO terms representing significantly enriched (FDR < 0.05) protein function groups for TElow (C) and TEhigh (D) transcripts. (E) Empirical cumulative distribution frequency (Ecdf) of the TE (log2FC) of SFARI autism associated (yellow) and other (black) genes. P = 2.579e-05, Kolmogorov–Smirnov test.
Fig. 5.
Fig. 5.
Features of translationally regulated transcripts in the somata and neuropil. (A and B) Box plots of 5′ UTR (A) and 3′ UTR (B) length (log10 nucleotides (nts) for TEhigh (yellow), TElow (blue), and other (gray) genes. Bars indicate 1.5*IQR. *P < 0.05, ****P < 0.0001; one-way ANOVA test followed by pairwise t test with Benjamini–Hochberg P value adjustment. (C) Shown are RBP motifs within 3′ UTRs associated with significantly lower (blue) or higher (yellow) neuropil TE values (q values < 0.05; Wilcoxon rank sum test) (Experimental Procedures). (D) Detection of translated uORFs in hippocampal neurons. Translation initiation sites were mapped using the drug harringtonine (har), which accumulates ribosomes at start codons. A total of 766 uORF-containing neuronal transcripts were detected in the somata and neuropil. (E) Coverage tracks representing the average ribosome footprint reads along the UTRs (gray), detected uORFs (orange), or the main protein coding sequence (blue) of Dlg4, Gria2, Taok1, and Ppp1r9b in the neuropil. The y axis indicates reads per million (RPM). (F) Observed-to-expected ratio of TEhigh (teal), TElow (blue), and other (gray) transcripts containing uORFs. **P < 0.01, ***P < 0.001, ****P < 0.0001; hypergeometric test. (G) Neuropil TE (log2FC) measurements of transcripts containing translated uORFs (“uORF”) or not (“no uORF”). ****P < 0.0001; Welch two-sample t test. (H) GO terms representing the top eight significantly (FDR < 0.05) enriched protein function groups for uORF-containing transcripts in the neuropil.

Comment in

  • A deep dive into local mRNA translation in neurons.
    Oliveira MM, Klann E. Oliveira MM, et al. Proc Natl Acad Sci U S A. 2021 Nov 9;118(45):e2117116118. doi: 10.1073/pnas.2117116118. Proc Natl Acad Sci U S A. 2021. PMID: 34737235 Free PMC article. No abstract available.

References

    1. Holt C. E., Martin K. C., Schuman E. M., Local translation in neurons: Visualization and function. Nat. Struct. Mol. Biol. 26, 557–566 (2019). - PubMed
    1. Pielot R., et al., Synprot: A database for proteins of detergent-resistant synaptic protein preparations. Front. Synaptic Neurosci. 4, 1 10.3389/fnsyn.2012.00001. (2012). - DOI - PMC - PubMed
    1. Cajigas I. J., et al., The local transcriptome in the synaptic neuropil revealed by deep sequencing and high-resolution imaging. Neuron 74, 453–466 (2012). - PMC - PubMed
    1. Hafner A. S., Donlin-Asp P. G., Leitch B., Herzog E., Schuman E. M., Local protein synthesis is a ubiquitous feature of neuronal pre- and postsynaptic compartments. Science 364, eaau3644 (2019). - PubMed
    1. Poon M. M., Choi S. H., Jamieson C. A., Geschwind D. H., Martin K. C., Identification of process-localized mRNAs from cultured rodent hippocampal neurons. J. Neurosci. 26, 13390–13399 (2006). - PMC - PubMed

Publication types

LinkOut - more resources