. 2021 Oct 20;13(20):23588-23602.
doi: 10.18632/aging.203605. Epub 2021 Oct 20.

ALDH2 promotes uterine corpus endometrial carcinoma proliferation and construction of clinical survival prognostic model

Affiliations

ALDH2 promotes uterine corpus endometrial carcinoma proliferation and construction of clinical survival prognostic model

Yun-Qian Cui et al. Aging (Albany NY). .

Abstract

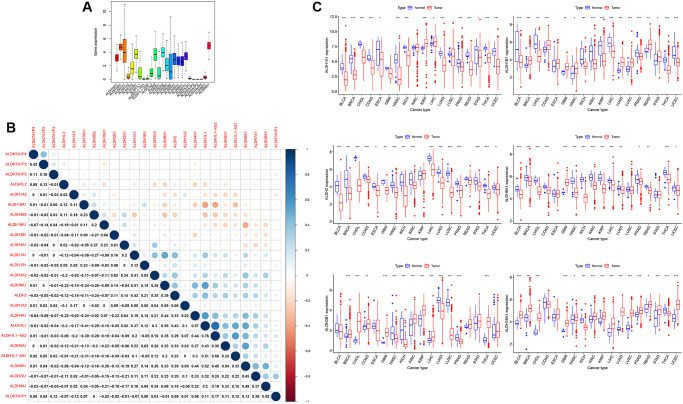
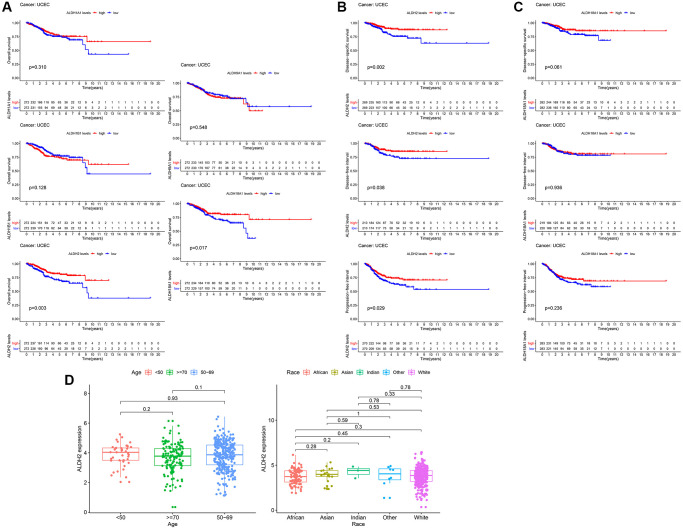
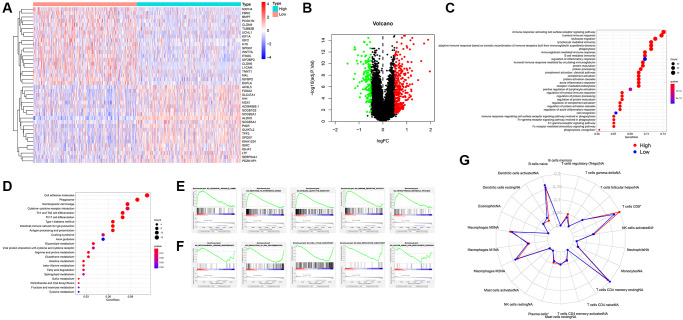
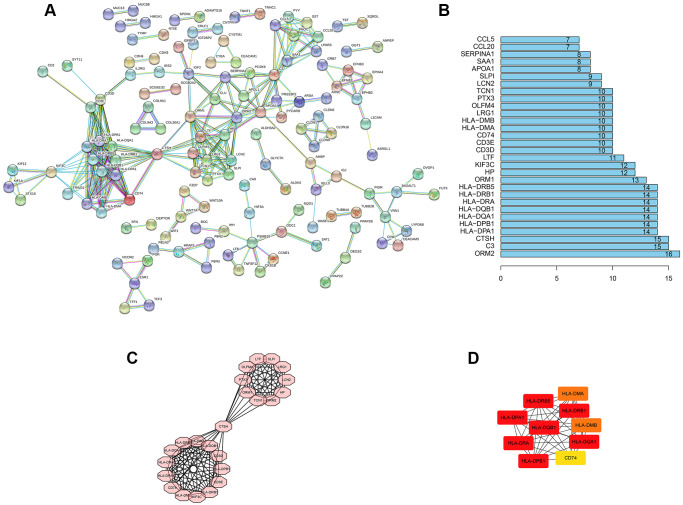
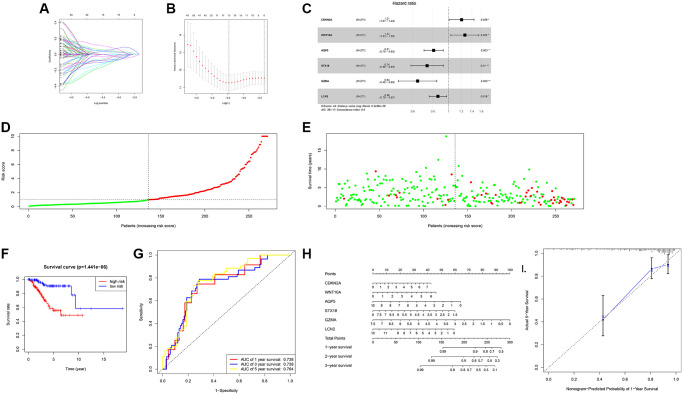
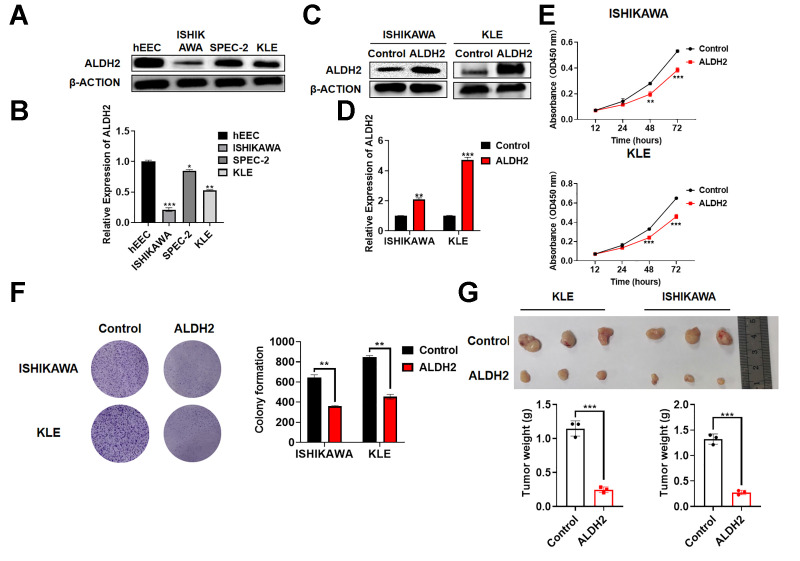
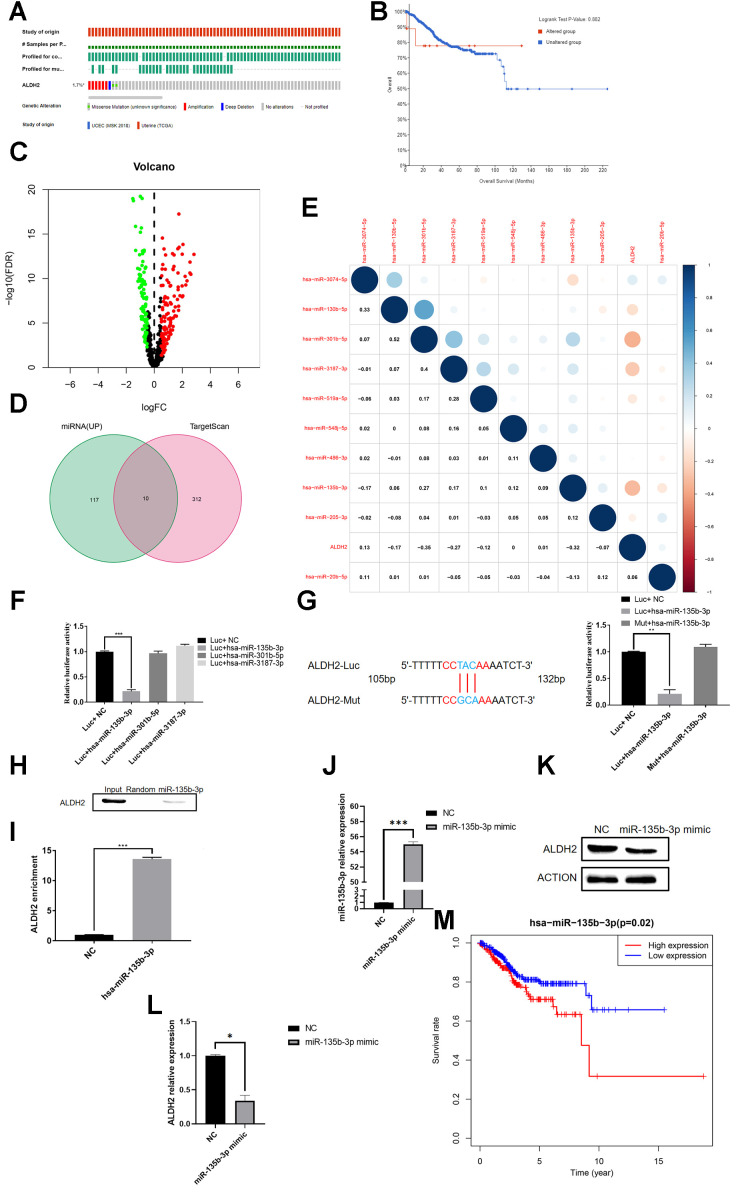
UCEC is one of the three common malignant tumors of the female reproductive tract. According to reports, the cure rate of early UCEC can reach 95%. Therefore, the development of prognostic markers will help UCEC patients to find the disease earlier and develop treatment earlier. The ALDH family was first discovered to be the essential gene of the ethanol metabolism pathway in the body. Recent studies have shown that ALDH can participate in the regulation of cancer. In our research, we explored the expression of the ALDH family in 33 cancers. It was found that ALDH2 was abnormally expressed in UCEC. Besides, in vivo and in vitro experiments were conducted to explore the effect of ALDH2 expression on the proliferation of UCEC cell lines. Meanwhile, the change of its expression is not due to gene mutations, but is regulated by miR-135-3p. At the same time, the impact of ALDH2 changes on the survival of UCEC patients is deeply discussed. Finally, a nomogram for predicting survival was constructed, with a C-index of 0.798 and AUC of 0.764. This study suggests that ALDH2 may play a crucial role in UCEC progression and has the potential as a prognostic biomarker of UCEC.

Keywords: ALDH2; bioinformatics; miR-135-3p; overall survival; risk score model; uterine corpus endometrial carcinoma.


Conflict of interest statement

CONFLICTS OF INTEREST: The authors declare no conflicts of interest related to this study.

Figures

Figure 1
Figure 1
The expression of ALDH family in all cancers of TCGA. (A) The expression level of patients of ALDH family in 33 types of cancer in TCGA. (B) The correlations among the expressions of the ALDH family. (C) The relative expression levels of ALDH1A1, ALDH1B1, ALDH2, ALDH9H1, ALDH3B1, and ALDH18A1 in the TCGA database compared with normal tissues. (The number of normal tissue samples less than 3 was hidden). *P < 0.05, ***P < 0.001.
Figure 2
Figure 2
The prognostic value of the ALDH family. (A) Kaplan–Meier survival curves by OS. (B) Kaplan–Meier survival curves by PFI, DSS, and DFI of ALDH2. (C) Kaplan–Meier survival curves by PFI, DSS, and DFI of ALDH18A1. (D) The relationship between clinicopathological characteristics and the expression of ALDH2.
Figure 3
Figure 3
Analysis of GO, KEGG, GSEA function enrichment. (A) Heatmap showing differential gene expression (FDR < 0.05) between low expression group and high expression group of ALDH2. (B) Volcano plot of all differential gene expression analysis. (C) GO enrichment analysis. (D) KEGG enrichment analysis. (E) GSEA enrichment analysis of high expression group of ALDH2. (F) GSEA enrichment analysis of low expression group of ALDH2. (G) Enrichment scores for 22 immune cell subpopulations based on deconvolution by CIBERSORT between low expression group and high expression group of ALDH2. *P < 0.05, ***P < 0.001.
Figure 4
Figure 4
PPI network construction. (A) PPI network of al DEGs. The individual nodes were hidden. The interaction relationship prediction threshold is > 0.900. (B) Top 30 genes with the highest number of nodes. (C) The core subnet of the PPI network by using the MCODE app. (D) The core gene of the PPI network by using the cytoHubba app.
Figure 5
Figure 5
The risk score model of UCEC construction. (A) DEGs were identified by the LASSO logistic regression model with non-zero coefficients. (B) The graph of the relationship between likelihood deviation and log (Lambda). The vertical dashed lines indicate the λ value and the maximum λ value with the smallest error. (C) Forest plot of the hazard ratio for OS of parameters. (D) Predicted risk of overall survival by the risk score model. (E) Scatter plot of UCEC death predicted by risk score model. (F) The survival curve of the high expression group and the low expression progenitor in the risk score model. (G) ROC curve of risk score model. (H) Predicts the OS of patients with the Nomogram. (I) Calibration curve of the nomogram in the training dataset.
Figure 6
Figure 6
Effect of ALDH2 overexpression on tumor progression in vitro and in vivo. (A) Expression of ALDH2 in the UCEC cells by Western Blot. (B) Expression of ALDH2 in the UCEC cells by qRT-PCR. (C) Overexpression efficiency of ALDH2 by Western Blot. (D) Overexpression efficiency of ALDH2 by qRT-PCR. (E) CCK-8 assays OD 450 nm. (F) Colony formation ability was determined using colony formation assays. (G) Tumor xenografts from nude mice subsequent assays. *P < 0.05, **P < 0.01, ***P < 0.001.
Figure 7
Figure 7
Hsa-miR-135b-3p binds to the 3′UTR of ALDH2. (A) Gene mutation distribution of UCEC patients detected in TCGA. (B) KM survival curve of the mutant group and non-mutation group. (C) The volcano plot of miRNAs in UCEC patients with TCGA: Red dots and green dots indicate differentially expressed miRNAs based on the fold change P < 0.05. (D) Venn diagram of up-regulated miRNA and predicted binding miRNA. (E) Correlation analysis between the expression of predicted bound miRNA and the expression of ALDH2. (F) Relative Luciferase activity was measured with a dual-luciferase reporter assay. (G) Dual-luciferase assay of the mutation group. (H) RNA pull-down analysis with ALDH2 antibody. (I) RIP assay was further verified for a direct association between hsa-miR-135-3p and ALDH2. (J) Overexpression efficiency of hsa-miR-135-3p mimic. (K) WB analysis the expression of ALDH2 with overexpression of hsa-miR-135-3p. (L) Relative expression of ALDH2 with overexpression of hsa-miR-135-3p by using Image J software. (M) Kaplan-Meier survival curve for patients with UCEC (According to the median value of aldh2 expression, it is divided into two groups of high and low expression). *P < 0.05, **P < 0.01, ***P < 0.001.

References

    1. Torre LA, Bray F, Siegel RL, Ferlay J, Lortet-Tieulent J, Jemal A. Global cancer statistics, 2012. CA Cancer J Clin. 2015; 65:87–108. 10.3322/caac.21262 - DOI - PubMed
    1. Bray F, Ferlay J, Soerjomataram I, Siegel RL, Torre LA, Jemal A. Global cancer statistics 2018: GLOBOCAN estimates of incidence and mortality worldwide for 36 cancers in 185 countries. CA Cancer J Clin. 2018; 68:394–424. 10.3322/caac.21492 - DOI - PubMed
    1. Siegel RL, Miller KD, Jemal A. Cancer statistics, 2015. CA Cancer J Clin. 2015; 65:5–29. 10.3322/caac.21254 - DOI - PubMed
    1. Willoughby BJ, Faulkner K, Stamp EC, Whitaker CJ. A descriptive study of the decline in cervical screening coverage rates in the North East and Yorkshire and the Humber regions of the UK from 1995 to 2005. J Public Health (Oxf). 2006; 28:355–60. 10.1093/pubmed/fdl062 - DOI - PubMed
    1. Quinn M, Babb P, Jones J, Allen E. Effect of screening on incidence of and mortality from cancer of cervix in England: evaluation based on routinely collected statistics. BMJ. 1999; 318:904–08. 10.1136/bmj.318.7188.904 - DOI - PMC - PubMed

Publication types

Substances