. 2021 Oct 20;12(1):6096.
doi: 10.1038/s41467-021-26356-y.

Energy systems in scenarios at net-zero CO2 emissions

Affiliations

Energy systems in scenarios at net-zero CO2 emissions

Julianne DeAngelo et al. Nat Commun. .

Abstract

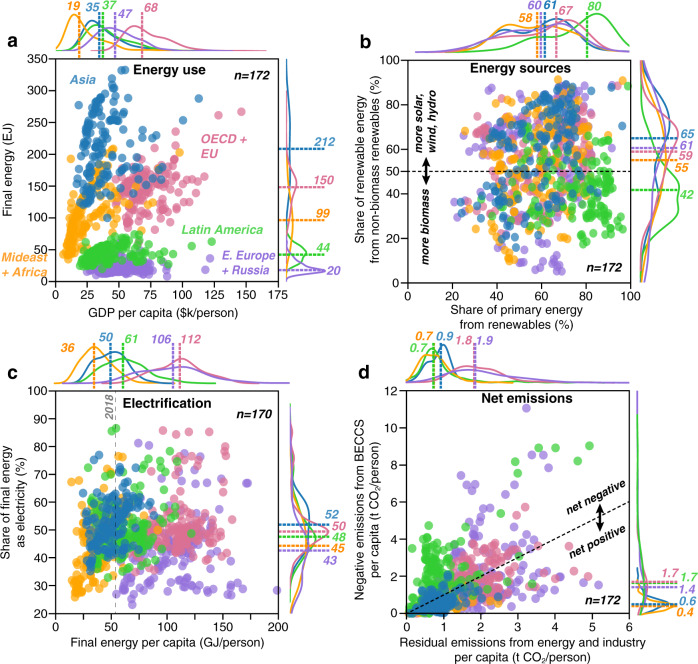
Achieving net-zero CO2 emissions has become the explicitgoal of many climate-energy policies around the world. Although many studies have assessed net-zero emissions pathways, the common features and tradeoffs of energy systems across global scenarios at the point of net-zero CO2 emissions have not yet been evaluated. Here, we examine the energy systems of 177 net-zero scenarios and discuss their long-term technological and regional characteristics in the context of current energy policies. We find that, on average, renewable energy sources account for 60% of primary energy at net-zero (compared to ∼14% today), with slightly less than half of that renewable energy derived from biomass. Meanwhile, electricity makes up approximately half of final energy consumed (compared to ∼20% today), highlighting the extent to which solid, liquid, and gaseous fuels remain prevalent in the scenarios even when emissions reach net-zero. Finally, residual emissions and offsetting negative emissions are not evenly distributed across world regions, which may have important implications for negotiations on burden-sharing, human development, and equity.


Conflict of interest statement

The authors declare no competing interests.

Figures

Fig. 1
Fig. 1. Energy system parameters in global net-zero CO2 emissions scenarios.
Scenarios that reach net-zero emissions show differences in energy use (a), emissions trajectory (b), energy sources (c), residual emissions (d), electrification (e), and policy (f), particularly with respect to warming levels (blue = <1.5 °C, green = <2.0 °C, orange = >2.0 °C). Points represent individual scenarios, with a frequency of scenarios shown along each axis for each warming level (colors corresponding to warming levels) and for all scenarios (black). Colored dashed lines and values indicate medians for warming groups, with colors corresponding to warming groups. Gray dashed lines indicate reference values for the year shown in gray.
Fig. 2
Fig. 2. Characteristics of regional energy systems and emissions when global emissions reach net-zero.
Scenarios that reach net-zero emissions globally (n = 172 scenarios with all regions) show regional differences in energy use (a), energy sources (b), electrification (c), and net emissions (d). Points represent individual scenarios, with a frequency of scenarios shown along each axis for each region (Asia = blue, Latin America = green, Middle East+Africa = orange, OECD + EU countries = pink, and Eastern Europe+Russia = purple). Colored dashed lines and values indicate medians for each region. Gray dashed lines indicate global reference values for the year shown in gray.
Fig. 3
Fig. 3. Residual and negative emissions when global emissions reach net-zero.
Residual and negative emissions in net-zero scenarios show global differences across different warming levels (a) and regions (b). In each case, the boxes show the range from 25th to 75th percentiles, whiskers show the 5th and 95th percentiles, and the lines and circles within the boxes denote the median and mean values, respectively.
Fig. 4
Fig. 4. Relative characteristics of scenarios in the global net-zero year.
Panels show parameter standard deviations for scenarios (rows) sorted by (a) electrification, (b) renewables share, (c) non-biomass renewables share, (d) energy conservation, (e) negative emissions from BECCS, and (f) net land-use emissions. “Electrification” is the share of final energy consumed as electricity. “Renewables” is the share of primary energy supplied by biomass, solar, wind, hydroelectricity, and geothermal. “Non-biomass ren.” is the share of renewable energy sources provided by sources other than biomass. “Energy conservation” here reflects the inverse of final energy per capita, such that warmer colors indicate higher levels of energy consumption. “Negative ems-BECCS” is the total amount of negative emissions from bioenergy with carbon capture and storage. “Net ems-land use” is the net amount of global CO2 emissions related to land use. Mean and standard deviation for parameters are shown below each column, and pairwise correlation coefficients (r) are shown in bold at the top of each column. Black r-values are statistically significant (p < 0.05), while red r-values are not.

References

    1. UNFCCC. Adoption of the Paris Agreement. (2015).
    1. Matthews HD, Caldeira K. Stabilizing climate requires near-zero emissions. Geophys. Res. Lett. 2008;35:L04705. doi: 10.1029/2007GL032388. - DOI
    1. Rogelj J, et al. Zero emission targets as long-term global goals for climate protection. Environ. Res. Lett. 2015;10:105007. doi: 10.1088/1748-9326/10/10/105007. - DOI
    1. Rogelj, J. et al. In Special Report on the impacts of global warming of 1.5 °C (Intergovernmental Panel on Climate Change, 2018).
    1. Sanderson, B. M., O’Neill, B. C. & Tebaldi, C. What would it take to achieve the Paris temperature targets? Geophysical Research Letters10.1002/2016GL069563 (2016).

Publication types