. 2021 Oct 20;12(1):6106.
doi: 10.1038/s41467-021-26328-2.

Bayesian log-normal deconvolution for enhanced in silico microdissection of bulk gene expression data

Affiliations

Bayesian log-normal deconvolution for enhanced in silico microdissection of bulk gene expression data

Bárbara Andrade Barbosa et al. Nat Commun. .

Abstract

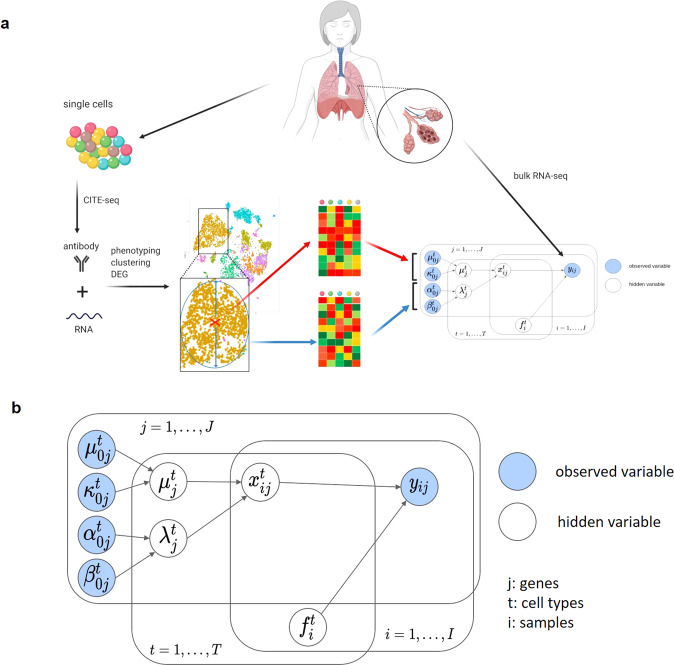
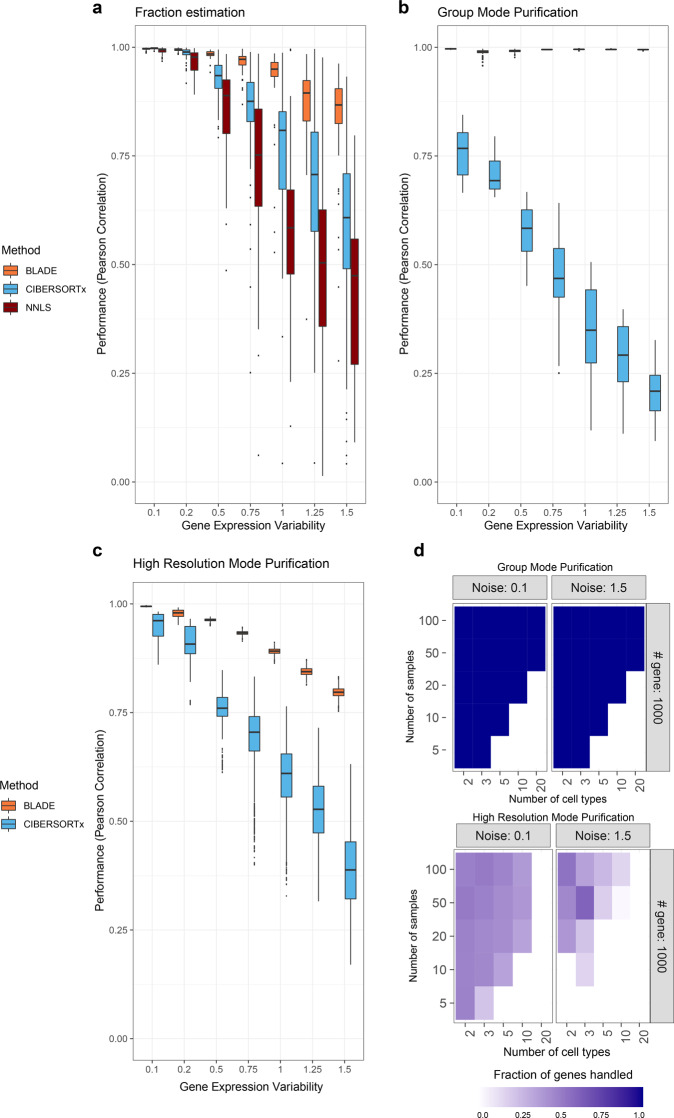
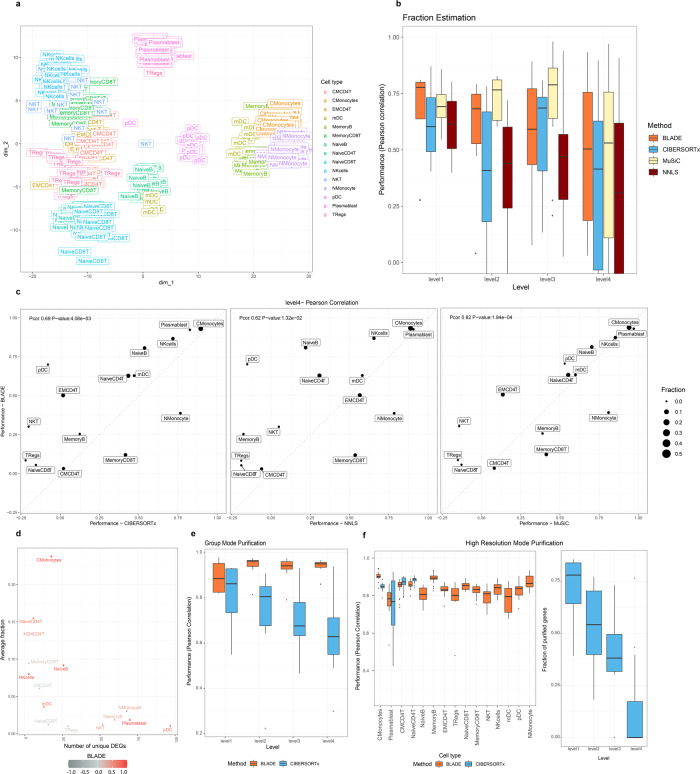
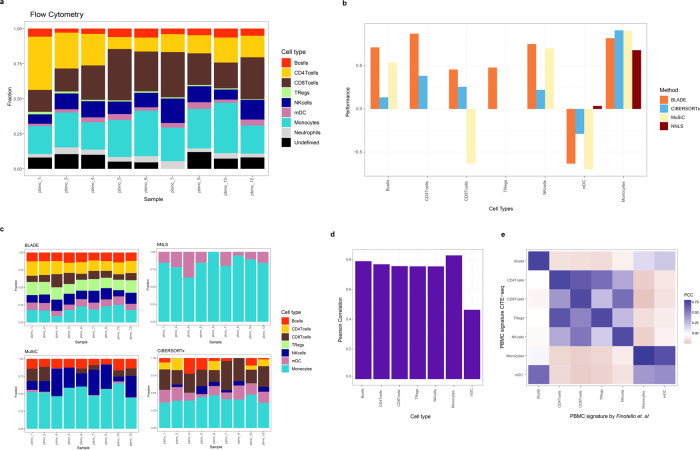
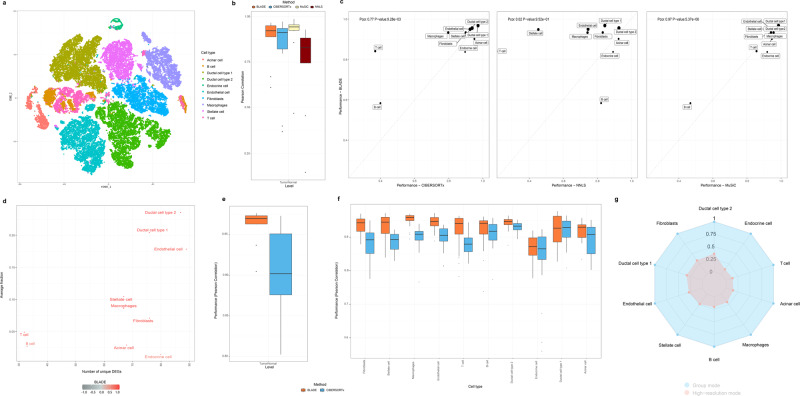
Deconvolution of bulk gene expression profiles into the cellular components is pivotal to portraying tissue's complex cellular make-up, such as the tumor microenvironment. However, the inherently variable nature of gene expression requires a comprehensive statistical model and reliable prior knowledge of individual cell types that can be obtained from single-cell RNA sequencing. We introduce BLADE (Bayesian Log-normAl Deconvolution), a unified Bayesian framework to estimate both cellular composition and gene expression profiles for each cell type. Unlike previous comprehensive statistical approaches, BLADE can handle > 20 types of cells due to the efficient variational inference. Throughout an intensive evaluation with > 700 simulated and real datasets, BLADE demonstrated enhanced robustness against gene expression variability and better completeness than conventional methods, in particular, to reconstruct gene expression profiles of each cell type. In summary, BLADE is a powerful tool to unravel heterogeneous cellular activity in complex biological systems from standard bulk gene expression data.


Conflict of interest statement

The authors declare no competing interests.

Figures

Fig. 1
Fig. 1. Overview of single-cell CITE-seq data from two PBMC samples.
a t-SNE plots show the similarities in Pearson correlation coefficients among gene expression profiles of individual cells in two single-cell PBMC RNA-seq data, respectively, on the left and right. Cell type* is denoted by color. b, c Comparison of gene expression variability measured in standard deviation (y-axis) per gene and cell type pair in log-scale (b) and linear-scale (c) for both datasets (x-axis). The genes were split by differentially expressed genes (DEGs; n = 2876 gene and cell type pairs; red) and non-differentially expressed genes (non-DEGs; n = 145,305 gene and cell type pairs; blue). The standard boxplot notation was used (lower/upper hinges—first/third quartiles; whiskers extend from the hinges to the largest/lowest values no further than 1.5 * inter-quartile ranges). d. Comparison of within-sample (x-axis) and between-sample variability (y-axis) in gene expression levels per cell type, split by DEGs (n = 2876) and non-DEGs (n = 145,305) per cell type. Standard deviation is measured for each gene and cell type first separately in two PBMC single-cell datasets followed by taking the average (x-axis), then also in merged PBMC data set (y-axis). Only the nine cell types commonly detected in two data sets were used in the analysis. *(CMCD4T: central memory CD4+ T cell; CMonocytes: classical monocytes; EMCD4T: effector memory CD4+ T cell; mDC: myeloid dendritic cell; MemoryB: memory B cell; MemoryCD8T: memory CD8+ T cell; NaiveB: naive B cell; NaiveCD4T: naive CD4+ T cell; NaiveCD8T: naive CD8+ T cell; NKcells: natural killer cell; NKT: natural killer T cell; Nmonocyte: non-classical monocyte; pDC: plasmacytoid dendritic cell; TRegs: regulatory T cell).
Fig. 2
Fig. 2. Comparison of normal, negative binomial, and log-normal distribution in fitting linear-scale gene expression data.
a A bar chart of average log-likelihood of the three types of distribution fitted to PBMC single-cell RNA-seq data. The genes were split by DEGs (red; n = 1723) and non-DEGs (blue; n = 1496). b Comparison of the distance of the estimated mode to the true mode (y-axis) per distribution type (x-axis). The standard boxplot notation was used (lower/upper hinges— first/third quartiles; whiskers extend from the hinges to the largest/lowest values no further than 1.5 * inter-quartile ranges). c Pairwise comparison of per-gene log-likelihood of log-normal distribution (y-axis) and that of normal (x-axis; top) and negative binomial distribution (x-axis; bottom). The genes were split into non-DEGs (left) and DEGs (right). d Density plots for raw-counts (red) and optimized log-normal (green), normal (blue), and negative binomial distribution (purple) for four example genes (gene name at the top) with low maximum log-likelihood for normal distribution. e, f Maximum log-likelihood values (e) and root mean squared error (root MSE: f) of each gene for log-normal (y-axis) and negative binomial (x-axis) convolutions of T = 8 cell types, applied to TCGA-MESO (left) and TCGA-SARC (right) data.
Fig. 3
Fig. 3. BLADE workflow.
a To construct a prior knowledge for BLADE, we used CITE-seq data that contains gene expression and cell surface marker profiles of each cell. Cells are then subject to phenotyping, clustering, and differential gene expression analysis. Then, for each cell type, we retrieved average expression profiles (red cross and top heat map) and standard deviation per gene as the variability (blue circle and bottom heatmap). This prior knowledge is then used in the hierarchical Bayesian model (bottom right) to deconvolute bulk transcriptome profiles. b A graphical model of BLADE represents random variables, observed and hidden variables, respectively, in blue and gray nodes, and their dependency associations (arrows). See the text for the details of the model.
Fig. 4
Fig. 4. Performance evaluation BLADE using simulation data with diverse settings.
a Performances (Pearson correlation coefficient; y-axis) of BLADE (orange), CIBERSORTx (blue), and NNLS (dark red) to predict the cellular fraction of a subset of simulation data with ten cell types, 1000 genes, and various variability levels (standard deviation of 0.1–1.5; x-axis; n = 50 per variability level; five independent data set with ten cell types each). The standard boxplot notation was used (lower/upper hinges—first/third quartiles; whiskers extend from the hinges to the largest/lowest values no further than 1.5 * inter-quartile ranges). b, c Performances (Pearson correlation coefficient; y-axis) of BLADE (orange) and CIBERSORTx (blue) to predict gene expression profiles per cell type for all samples jointly (group mode; b) and for each sample separately (high-resolution mode; c) using the same simulation data (n = 50 per variability level; five independent data set with ten cell types each). The standard boxplot notation was used. d Fractions of purified genes in the simulation data with two extreme levels of gene expression variability (left and right panels) by CIBERSORTx in group mode (top) and high-resolution mode (bottom). x- and y-axis represent the number of cell types and samples in the simulation data, respectively.
Fig. 5
Fig. 5. Performance evaluation of BLADE using simulated PBMC bulk RNA-seq data.
a A t-SNE plot represents the similarities in Pearson correlation coefficients among gene expression profiles of 15 cell types* (denoted by label) in 20 simulated bulk PBMC data. b Performances (Pearson correlation coefficient; y-axis) of BLADE (orange), CIBERSORTx (blue), NNLS (dark red), and MuSiC (light yellow) in predicting cellular fractions of the 20 simulated PBMC bulk RNA-seq data with diverse levels (n = 4, 7, 12, and 15 cell types, respectively, in levels 1–4; x-axis). The standard boxplot notation was used (lower/upper hinges —first/third quartiles; whiskers extend from the hinges to the largest/lowest values no further than 1.5 * inter-quartile ranges). c Comparison of performance in estimating the cellular fractions per cell type of BLADE (y-axis) with CIBERSORTx, NNLS, and MuSiC (x-axis) at level 4. The fraction of each cell type is indicated by the size of the point. Pearson correlation coefficient and two-tailed test P-values are indicated at the top left in each panel. d Performance of BLADE (indicated by color) and its association to the number of unique DEGs per cell type (x-axis) and the respective fraction in the simulated data (y-axis). e Performance in Pearson correlation coefficient of BLADE (orange), CIBERSORTx (blue) for group mode purification of four levels of PBMC simulation data (n = 4, 7, 12, and 15 cell types, respectively, in levels 1–4; x-axis). The standard boxplot notation was used. f Performance (Pearson correlation coefficient; y-axis) of BLADE (orange) and CIBERSORTx (blue) in estimating gene expression profiles per cell type (x-axis) and per sample in level 4 (n = 20 samples per cell type; left). Fraction of genes in silico purified in high-resolution mode by CIBERSORTx at all levels of PBMC simulation data (n = 20 samples with 4, 7, 12, and 15 cell types, respectively, in levels 1–4; x-axis; right). The standard boxplot notation was used. *(CMCD4T: central memory CD4+ T cell; CMonocytes: classical monocytes; EMCD4T: effector memory CD4+ T cell; mDC: myeloid dendritic cell; MemoryB: memory B cell; MemoryCD8T: memory CD8+ T cell; NaiveB: naive B cell; NaiveCD4T: naive CD4+ T cell; NaiveCD8T: naive CD8+ T cell; NKcells: natural killer cell; NKT: natural killer T cell; Nmonocyte: non-classical monocyte; pDC: plasmacytoid dendritic cell; TRegs: regulatory T cell).
Fig. 6
Fig. 6. Performance evaluation of BLADE using PBMC bulk RNA-seq data with incomplete prior knowledge.
a Cell types fractions (y-axis) determined by flow cytometry in nine samples (x-axis). All cell types* have a color associated as shown in the legend. b Performances of BLADE (orange), CIBERSORTx (blue), NNLS (dark red) and MuSiC (light yellow), measured by Pearson correlation (y-axis) of the estimated sample-specific cell type (x-axis) fractions with those determined by flow cytometry. c Estimated cell fractions (y-axis) per sample (x-axis) by BLADE (top-left), NNLS (top-right), MuSiC (bottom-left) and CIBERSORTx (bottom-right). d, e Pearson correlation (y-axis in d and color gradient in e) of the signature per pair of cell types determined by Finotello et al. and two PBMC scRNA-seq data used in this study. *(TRegs: regulatory T cells; NKcells: natural killer cells; mDC: myeloid dendritic cells).
Fig. 7
Fig. 7. Performance evaluation of BLADE for deconvoluting tumor data.
a t-SNE plot showing the variability of the cell populations in the PDAC single-cell RNA-seq data. b Performances (Pearson correlation coefficient; y-axis) of BLADE (orange), CIBERSORTx (blue), NNLS (dark red), and MuSiC (light yellow) in predicting cellular fractions of the PDAC bulk RNA-seq data (n = 29 main samples). The standard boxplot notation was used (lower/upper hinges—first/third quartiles; whiskers extend from the hinges to the largest/lowest values no further than 1.5 * inter-quartile ranges). c Comparison of performance in estimating the cellular fractions of each cell type of BLADE (y-axis) with CIBERSORTx (left), NNLS (middle), and MuSiC (right; x-axis). The fraction of each cell type is indicated by the point size. Pearson correlation coefficient and two-tailed test P-values are indicated at the top left in each panel. d The number of unique DEGs per cell type (x-axis) and the respective fraction in the PDAC data (y-axis). e Performance in Pearson correlation of BLADE (orange), CIBERSORTx (blue) for group mode purification (n = 10 cell types). The standard boxplot notation was used. f Performance (Pearson correlation coefficient; y-axis) of BLADE (orange) and CIBERSORTx (blue) in estimating gene expression profiles per cell type (x-axis) and per sample (n = 29 samples for each cell type; right). The standard boxplot notation was used. g Fraction of genes in silico purified in group mode (blue) and high-resolution mode (blue) by CIBERSORTx.

References

    1. Angelova M, et al. Characterization of the immunophenotypes and antigenomes of colorectal cancers reveals distinct tumor escape mechanisms and novel targets for immunotherapy. Genome Biol. 2015;16:1–17. doi: 10.1186/s13059-015-0620-6. - DOI - PMC - PubMed
    1. Tirosh I, et al. Dissecting the multicellular ecosystem of metastatic melanoma by single-cell RNA-seq. Science. 2016;352:189–196. doi: 10.1126/science.aad0501. - DOI - PMC - PubMed
    1. Zheng Z, et al. Single-cell transcriptomic analysis. Compr. Physiol. 2020;10:767–783. doi: 10.1002/cphy.c190037. - DOI - PubMed
    1. Pottier C, et al. The importance of the tumor microenvironment in the therapeutic management of cancer. Expert Rev. Anticancer Ther. 2015;15:943–954. doi: 10.1586/14737140.2015.1059279. - DOI - PubMed
    1. Kumar MP, et al. Analysis of single-cell RNA-Seq identifies cell-cell communication associated with tumor characteristics. Cell Rep. 2018;25:1458–1468.e4. doi: 10.1016/j.celrep.2018.10.047. - DOI - PMC - PubMed

Publication types