. 2021 Oct 20;12(1):6102.
doi: 10.1038/s41467-021-26345-1.

Spared perilesional V1 activity underlies training-induced recovery of luminance detection sensitivity in cortically-blind patients

Affiliations

Spared perilesional V1 activity underlies training-induced recovery of luminance detection sensitivity in cortically-blind patients

Antoine Barbot et al. Nat Commun. .

Abstract

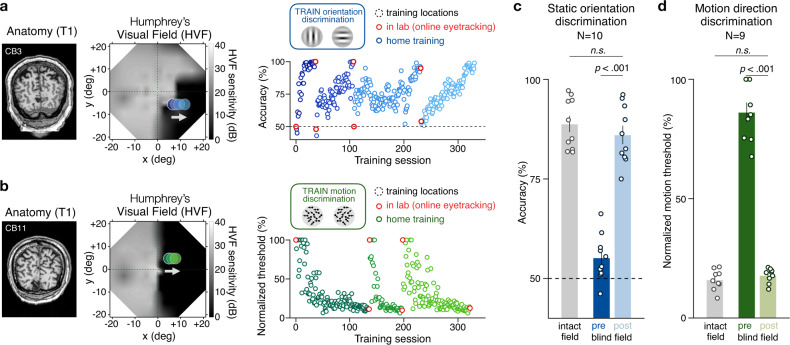
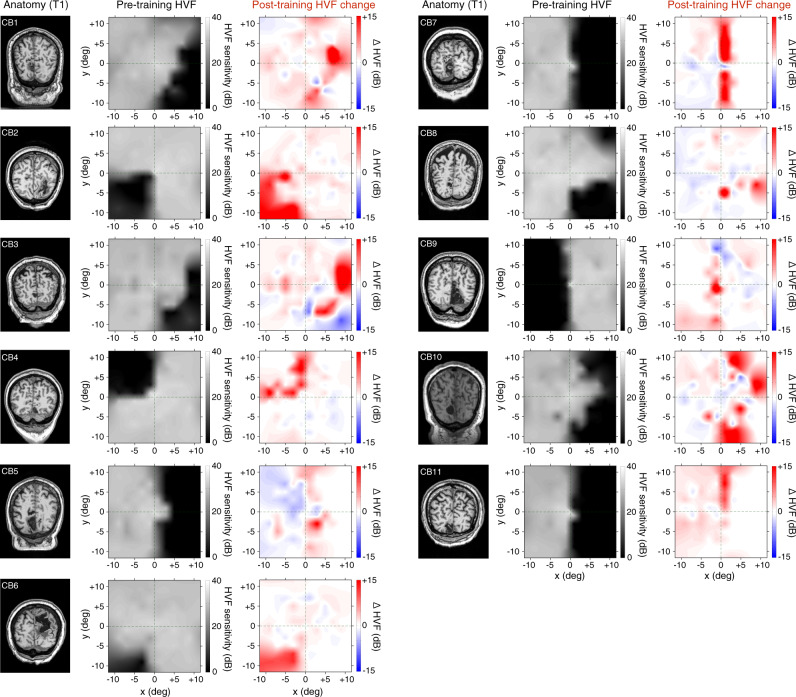
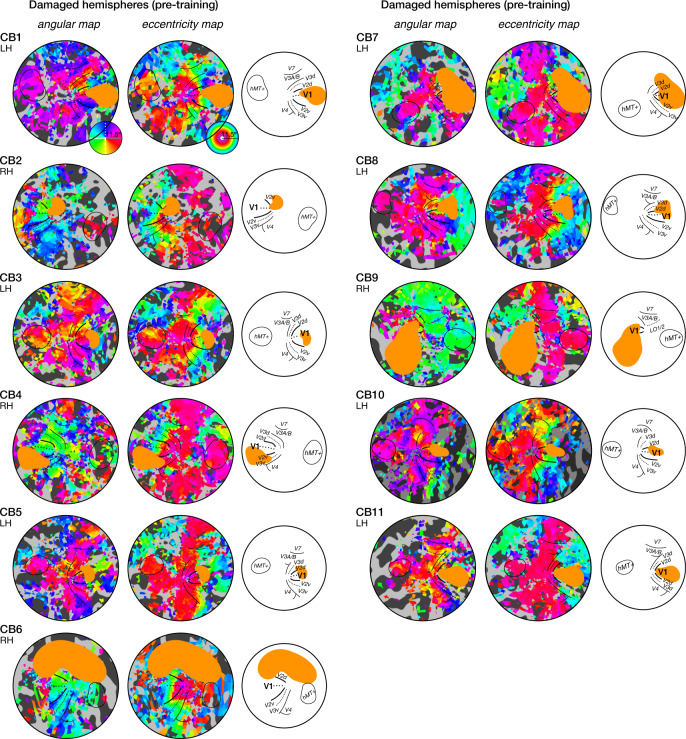
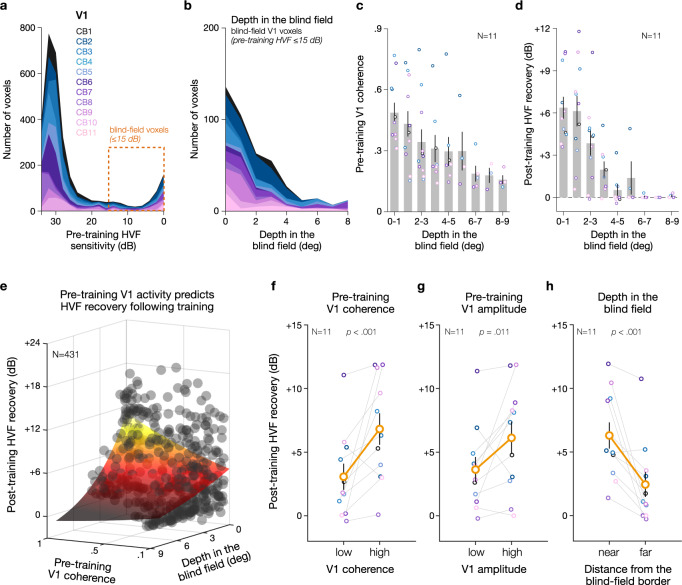
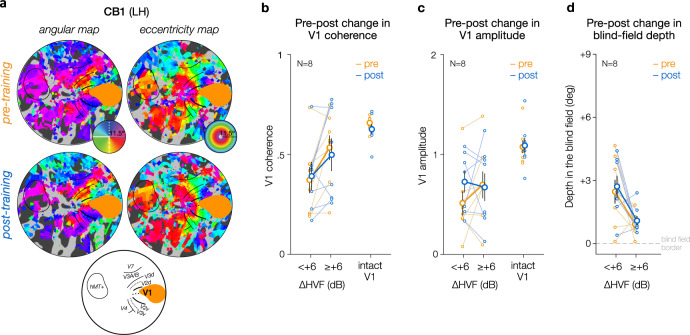
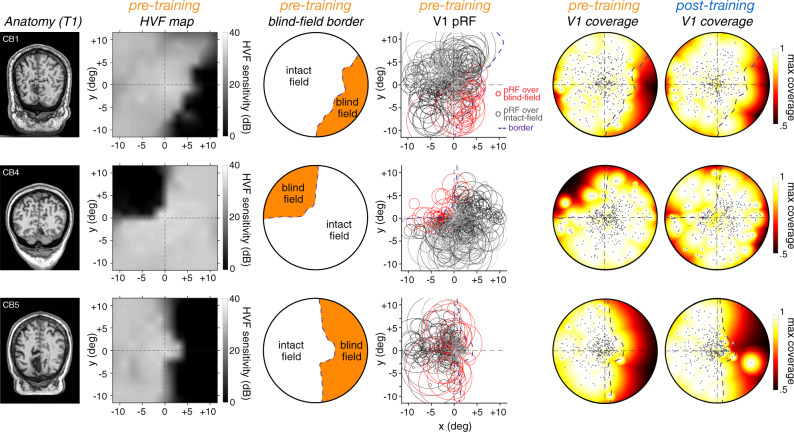
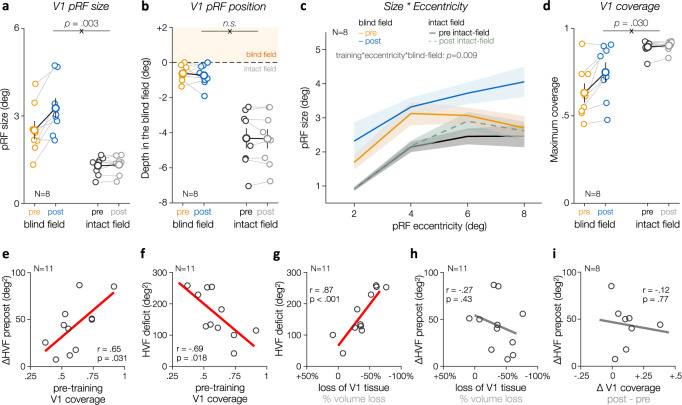
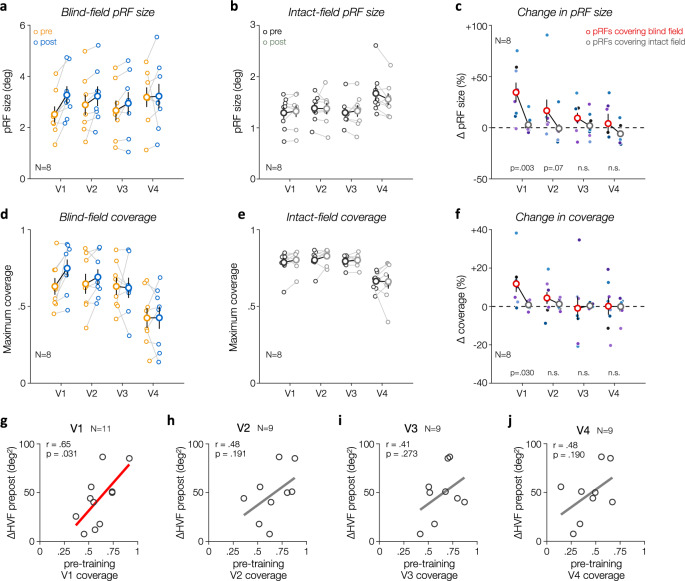
Damage to the primary visual cortex (V1) causes homonymous visual-field loss long considered intractable. Multiple studies now show that perceptual training can restore visual functions in chronic cortically-induced blindness (CB). A popular hypothesis is that training can harness residual visual functions by recruiting intact extrageniculostriate pathways. Training may also induce plastic changes within spared regions of the damaged V1. Here, we link changes in luminance detection sensitivity with retinotopic fMRI activity before and after visual discrimination training in eleven patients with chronic, stroke-induced CB. We show that spared V1 activity representing perimetrically-blind locations prior to training predicts the amount of training-induced recovery of luminance detection sensitivity. Additionally, training results in an enlargement of population receptive fields in perilesional V1, which increases blind-field coverage and may support further recovery with subsequent training. These findings uncover fundamental changes in perilesional V1 cortex underlying training-induced restoration of conscious luminance detection sensitivity in CB.


Conflict of interest statement

KRH is co-inventor on US Patent No. 7,549,743. The remaining authors have no competing interests.

Figures

Fig. 1
Fig. 1. Visual discrimination training recovers visual functions in chronic cortically-blind (CB) fields.
a, b T1-weighted MRI and full (±21 deg) Humphrey Visual Field (HVF) for two chronic CB patients with stroke-induced damage to the primary visual cortex and associated loss of conscious luminance detection sensitivity. Dark regions (low HVF sensitivity) correspond to blind-field areas. Visual training can successfully restore (a) static orientation discrimination and (b) coarse (left/right) global motion direction discrimination in the blind field of chronic CB patients. Recovery is typically retinotopically-specific, requires weeks of daily home training (blue/green dots in scatter plots), and can be verified in lab under eye-tracking control (red dots in scatter plots). As detailed in previous work, all 11 CB patients included in the present study trained on (c) static orientation discrimination (N = 10) and/or (d) motion direction discrimination (N = 9) at different blind-field locations. All CB patients recovered performance levels on these tasks similar to those at equivalent locations in their intact visual hemifields. Bars show mean performance across subjects (±1 SEM), with individual data superimposed.
Fig. 2
Fig. 2. Visual discrimination training improves conscious luminance detection sensitivity in chronic CB patients.
T1-weighted MRI and corresponding baseline (pre-training) composite Humphrey Visual Fields (HVF; luminance detection sensitivity in dB) for all 11 chronic CB patients over the central 11.5 degrees of the visual field–i.e., the area stimulated during fMRI retinotopic mapping (see Supplementary Fig. S1 for individual maps of the full HVFs showing locations used for visual discrimination training). Prior to training, all CB patients showed homonymous loss of HVF sensitivity (dark regions) within parts of their visual field. As indicated by the post-training HVF change maps, all patients showed improved HVF sensitivity (red regions) following training, which was greatest within the confines of their initial (pre-training) blind-field border. A substantial amount of this recovery occurred within the inner 11.5 degrees of the visual field (see for full description of training-induced HVF recovery in a larger cohort of chronic CB patients). Areas of sensitivity loss (blue) were also noted in some patients, but only 2 (CB3 and CB9) exhibited significant loss (≥-6dB) along with larger areas of HVF improvements.
Fig. 3
Fig. 3. Pre-training retinotopic maps of the damaged hemispheres of all 11 chronic CB patients.
All patients retained retinotopic organization, both in terms of radial and eccentric representations. Stroke-induced lesions (orange masks) overlapped with V1 in most cases, as well as with other extrastriate areas.
Fig. 4
Fig. 4. Spared pre-training V1 activity predicts post-training Humphrey’s Visual Field (HVF) recovery in the blind field of chronic CB patients.
a Distribution plot of V1 voxels in damaged hemispheres as a function of the pre-training HVF sensitivity (using 2 ± 1 dB steps). b Distribution plot of V1 voxels in damaged hemispheres representing regions of the blind field (≤15 dB pre-training HVF sensitivity) prior to training as a function of the depth in the blind field (i.e., distance from the blind-field border) using 1 ± 0.5 deg steps. Each color corresponds to a single CB patient. Note the preferential location of these voxels near the blind-field border (i.e., 0 deg). c, d Consistent with enhanced plastic potential along the blind-field border of CB patients, spared blind-field locations closer to the blind-field border showed stronger visually-evoked V1 response coherence prior to training, as well as greater HVF change (in dB of sensitivity) from pre- to post-training. Bars represent average estimates across CB patients (±1SEM), with individual dots corresponding to individual CB patients. e The strength of pre-training visually-evoked responses and the blind-field depth of V1 voxels representing blind-field locations were predictive of the magnitude of post-training HVF recovery, with a significant interaction between pre-training V1 coherence and depth in the blind field. Each data point corresponds to a V1 voxel, which were fit (colored surface) using a generalized linear mixed-effects model with participants as a random effect (adj-r2 = .55). Post-training HVF recovery as a function of pre-training, visually-evoked V1 responses within the blind field (f: coherence; g: amplitude) computed for each CB patient (N = 11). Data were split using the group median for illustration purposes only (coherence: 0.37; amplitude: 0.54); p-values were computed from the generalized linear mixed-effects analyses on unbinned data. Error bars correspond to ±1SEM, with gray lines representing individual subjects. (h) Same as (f, g) but as function of the blind-field depth (median split: 1.7 deg).
Fig. 5
Fig. 5. Retinotopic organization and V1 activity in CB patients (N = 8) following training.
a Sample pre-training and post-training retinotopic maps of the damaged hemispheres for one of our CB patients (see Supplementary Fig. S4 for all individual post-training maps). Qualitatively, no global change in retinotopic organization was observed following training. V1 response (b: coherence; c: amplitude) for voxels representing blind-field locations prior to training, are then plotted as a function of training and post-training HVF recovery. Although no consistent change in V1 coherence was observed following training, V1 voxels representing blind-field locations with weak HVF recovery showed increased response amplitude. Data were split based on the level of HVF recovery for illustration purposes only (no recovery: ∆HVF < + 6 dB; significant recovery: ∆HVF ≥ + 6 dB), while generalized linear mixed-effects models on unbinned data, with participants as a random effect, were used for statistical analyses. Solid symbols represent group-averaged values with ±1SEM error bars, with each individual CB patient represented by thinner lines. d Same as (b, c) but for the depth in the blind field of the preferred position of V1 voxels before and following training as a function of the amount of HVF recovery observed at that blind-field location.
Fig. 6
Fig. 6. Population receptive field (pRF) and visual field coverage before and following training.
Anatomy (T1), pre-training HVF map, pre-training V1 pRFs, and resulting visual-field coverage maps (maximum coverage) for pre-training and post-training V1 pRFs shown for 3 CB patients. The pRF method was used to estimate the position and size of the visual-field area that best explained each voxel’s visually-evoked response. The initial (pre-training) HVF map was used to define the blind-field border and determine whether each single pRF covered blind-field regions or solely intact-field regions with preserved HVF sensitivity. Single black dots on the coverage maps indicates the preferred center of each V1 pRFs.
Fig. 7
Fig. 7. Enhanced population receptive field size and coverage of the blind field in V1 following training.
a Training in CB patients (N = 8) resulted in a significant increase in pRF size for V1 pRFs covering blind-field regions, compared to V1 pRFs covering solely intact-field regions. Solid symbols show group-averaged estimates (±1SEM), and smaller dots individual data. Significant pRF coverage*training interaction (repeated-measures ANOVA) is indicated above the graph. b Training was not associated with a change in V1 pRF preferred position relative to the blind-field border, expressed as the depth in the blind field (in deg). Same convention as in (a). Moreover, training was not associated with changes in variance explained, pRF eccentricity or number of V1 pRFs (see Supplementary Figs. S5 and S6). c Prior to training, pRF size plotted as a function of eccentricity indicated larger pRF size for V1 pRFs covering parts of the blind field, compared to V1 pRFs covering the intact field. This difference decreased with eccentricity. Following training, pRF covering the blind field increased in size, with this increase being more pronounced with eccentricity. Shaded areas correspond to ±1SEM. Data were binned as a function of eccentricity (2–8 deg with 2 ± 1 deg steps) for illustration purpose only; effects were assessed using a linear mixed-effects model. d Increase in the size of perilesional V1 pRFs resulted in enhanced V1 coverage of the blind field following training. Same convention than (a, b). e Pre-training V1 coverage of the blind field in CB patients (N = 11) was predictive of the amount of HVF recovery observed within the inner 11.5 deg following training. The initial HVF deficit area (for the inner 11.5 deg) was anti-correlated with (f) the amount of pre-training coverage of the blind field and (g) with the loss of V1 tissue (i.e., negative values indicate a stronger reduction in V1 volume between the intact and damaged hemispheres). h However, the loss of V1 tissue (and the size of the pre-training HVF deficit) did not correlate with the amount of HVF recovery observed following training. i Larger increase in V1 coverage of the blind field (or in the size of V1 pRFs) was not associated with stronger HVF recovery.
Fig. 8
Fig. 8. Lesion-induced and training-induced differences in pRF size and coverage in V1 but not in extrastriate areas (V2, V3, V4).
a V1 pRFs covering blind-field regions showed an increase in pRF size following training, which was not observed in extrastriate areas (V2-V4), or for (b) pRFs covering solely intact-field regions. c Summary of the changes in pRF size as a function of visual areas and whether pRFs covered blind-field or intact-field regions, computed as a percent change. d, e Training-induced enlargement of V1 pRFs covering regions of the blind field significantly increases coverage of the blind field in V1, without clear change in extrastriate areas (V2-V4) or for the coverage of the intact field. In panels a-f, small symbols correspond to individual CB patients (N = 8), with larger symbols corresponding to group-average values (±1SEM). Statistical values for the training*HVF coverage interaction are provided at the bottom of (c) and (f). g–i Pre-training pRF coverage of the blind field was predictive of the amount of HVF change in V1, but not in extrastriate areas. Note that extrastriate areas could not be defined in two patients (CB9 and CB11), resulting in a different number of patients for extrastriate areas (N = 9) than for V1 (N = 11) in panels g-j (excluding these two patients from V1 analyses as well did not affect our findings).

References

    1. Zhang X, Kedar S, Lynn MJ, Newman NJ, Biousse V. Natural history of homonymous hemianopia. Neurology. 2006;66:901–905. doi: 10.1212/01.wnl.0000203338.54323.22. - DOI - PubMed
    1. Zhang X, Kedar S, Lynn MJ, Newman NJ, Biousse V. Homonymous hemianopias: clinical-anatomic correlations in 904 cases. Neurology. 2006;66:906–910. doi: 10.1212/01.wnl.0000203913.12088.93. - DOI - PubMed
    1. Leopold DA. Primary visual cortex: awareness and blindsight. Annu Rev. Neurosci. 2012;35:91–109. doi: 10.1146/annurev-neuro-062111-150356. - DOI - PMC - PubMed
    1. Melnick MD, Tadin D, Huxlin KR. Relearning to See in Cortical Blindness. Neuroscientist. 2016;22:199–212. doi: 10.1177/1073858415621035. - DOI - PMC - PubMed
    1. Pollock, A. et al. Interventions for visual field defects in patients with stroke. Cochrane Database Syst. Rev. CD008388 10.1002/14651858.CD008388.pub2 (2011). - PubMed

Publication types

MeSH terms