. 2021 Oct 20;9(1):45.
doi: 10.1038/s41413-021-00162-0.

Augmenting MNK1/2 activation by c-FMS proteolysis promotes osteoclastogenesis and arthritic bone erosion

Affiliations

Augmenting MNK1/2 activation by c-FMS proteolysis promotes osteoclastogenesis and arthritic bone erosion

Se Hwan Mun et al. Bone Res. .

Abstract

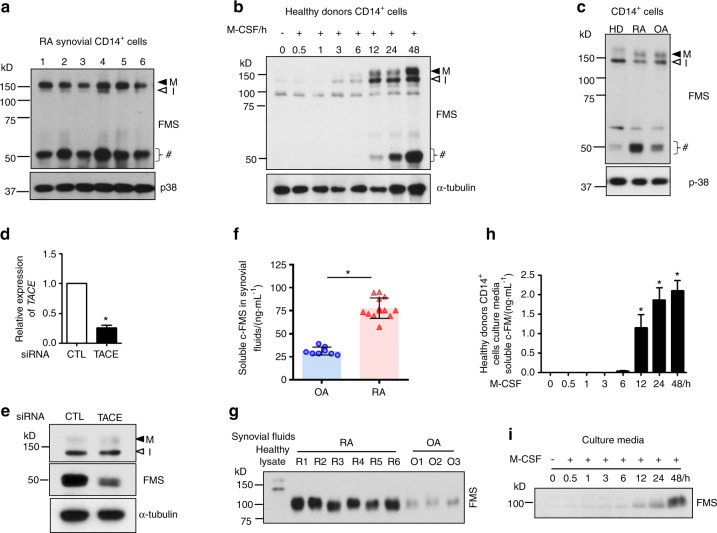
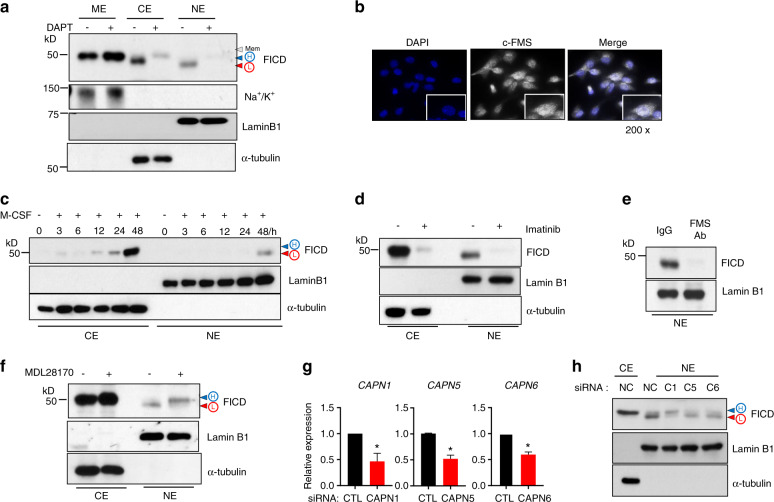
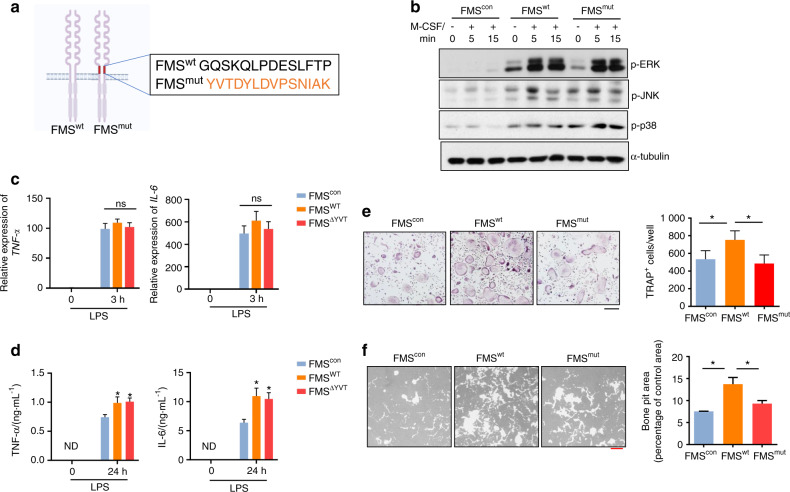
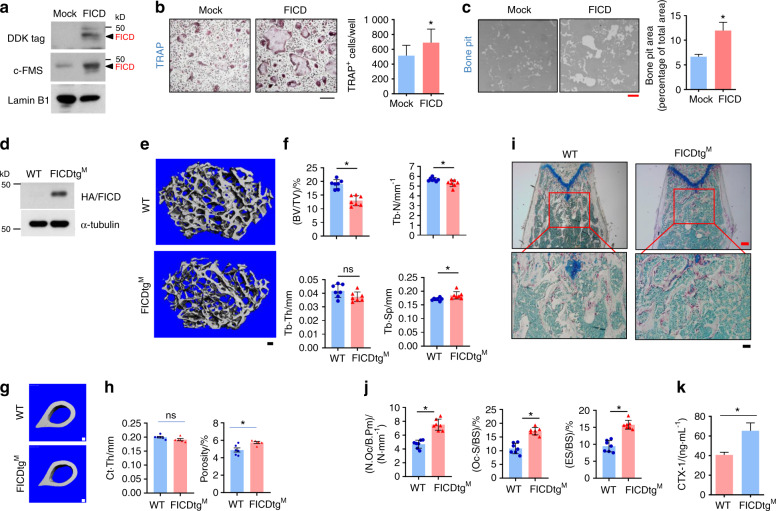
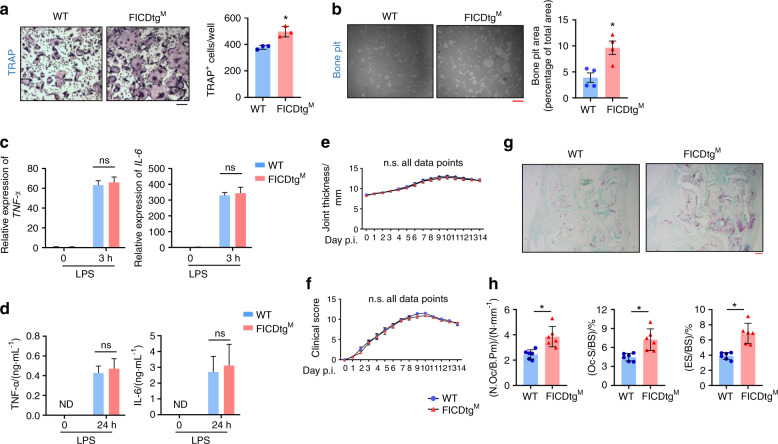
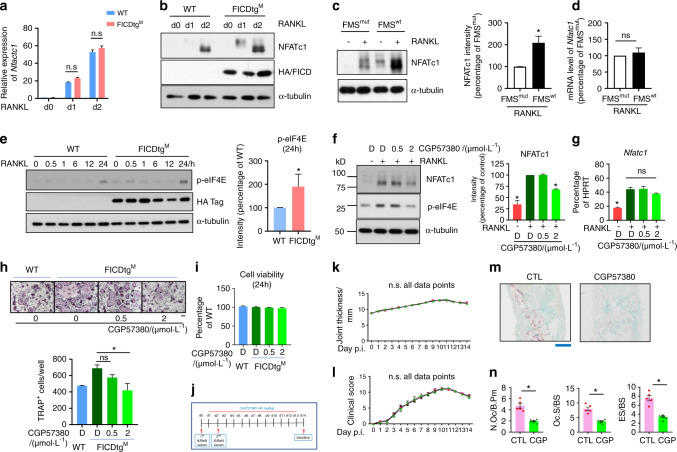
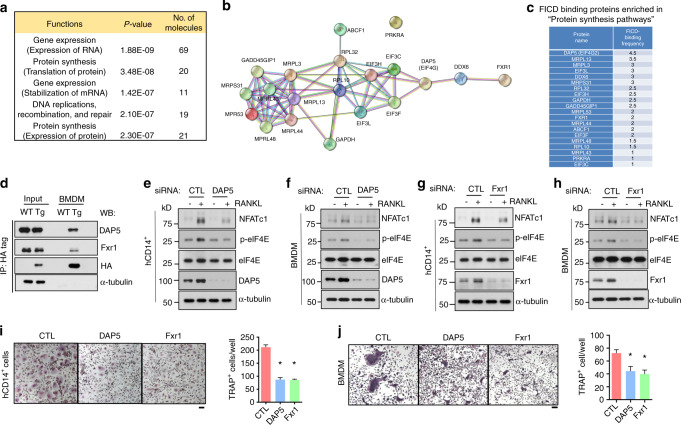
Osteoclasts are bone-resorbing cells that play an essential role in homeostatic bone remodeling and pathological bone erosion. Macrophage colony stimulating factor (M-CSF) is abundant in rheumatoid arthritis (RA). However, the role of M-CSF in arthritic bone erosion is not completely understood. Here, we show that M-CSF can promote osteoclastogenesis by triggering the proteolysis of c-FMS, a receptor for M-CSF, leading to the generation of FMS intracellular domain (FICD) fragments. Increased levels of FICD fragments positively regulated osteoclastogenesis but had no effect on inflammatory responses. Moreover, myeloid cell-specific FICD expression in mice resulted in significantly increased osteoclast-mediated bone resorption in an inflammatory arthritis model. The FICD formed a complex with DAP5, and the FICD/DAP5 axis promoted osteoclast differentiation by activating the MNK1/2/EIF4E pathway and enhancing NFATc1 protein expression. Moreover, targeting the MNK1/2 pathway diminished arthritic bone erosion. These results identified a novel role of c-FMS proteolysis in osteoclastogenesis and the pathogenesis of arthritic bone erosion.


Conflict of interest statement

The authors declare no competing interests.

Figures

Fig. 1
Fig. 1
The detection of small fragments of c-FMS and soluble c-FMS. a Immunoblot analysis of rheumatoid arthritis (RA) synovial CD14+ cells with antibodies against the C-terminus of c-FMS. b Human CD14+ cells from healthy donors were cultured with M-CSF for the indicated times. Immunoblot analysis of whole cell lysates with antibodies against the C-terminus of c-FMS. c Immunoblot analysis of whole cell lysates from CD14+ cells from healthy donors cultured with M-CSF for 1 day (HD) and synovial CD14+ cells from patients with RA or osteoarthritis (OA). d, e Human CD14+ cells were nucleofected with control (CTL) or TACE siRNAs and then cultured with M-CSF. d Knockdown (KD) efficiency. TACE mRNA was measured by qPCR and normalized to HPRT. e Immunoblot analysis of KD cells using an anti-c-FMS antibody. f, g Soluble c-FMS levels in synovial fluids from patients with rheumatoid arthritis (RA, n = 13) and osteoarthritis (OA, n = 8) were measured by ELISA (f) and immunoblot analysis with antibodies against N-terminal c-FMS (g). h, i Human CD14+ cells were cultured with M-CSF. Soluble c-FMS in the culture media was measured by ELISA (h) and immunoblot analysis with anti-c-FMS antibodies (i). All data are shown as the mean ± SEM. *P < 0.05 by unpaired t-test (d, f) or one-way ANOVA with a post hoc Tukey test (h). The data represent at least 3 independent donors. M; a mature c-FMS, I; an immature c-FMS, #; small fragments.
Fig. 2
Fig. 2
Calpain 1 cleaves FICD fragments. a Human CD14+ cells were cultured with M-CSF (20 ng·mL−1) for 8 h to induce early signals, and then DAPT (10 μmol·L−1) was added. The cells were cultured for additional 2 days. Protein expression of c-FMS, the Na+/K+pump, Lamin B1, and α-tubulin were determined by immunoblot analysis. ME membrane extracts, CE cytoplasmic extracts, NE nuclear extracts. b Immunocytochemical analysis of DAPI and c-FMS. The right panel shows a merged image. Scale: 200×. c Cells were starved for 3h and then stimulated with M-CSF for the indicated times. d, e Cells were treated with imatinib (0.3 μmol·L−1, d or a c-FMS-blocking antibody (5 μg·mL−1, e prior to the addition of M-CSF. Protein expression of the FICD was measured by immunoblot analysis. Lamin B1 and α-tubulin were used as controls for the nuclear and cytoplasmic fractions, respectively. f Human CD14+ cells were cultured with M-CSF (20 ng·mL−1) for 8h to induce early signals, and then MDL 28170 (5 μmol·L1) was added. The cells were cultured for additional 2 days. Immunoblot analysis with anti-c-FMS, Lamin B1, and α-tubulin antibodies. g, h Calpain 1, 5, and 6 were knocked down with siRNAs. The cells were cultured with M-CSF for 12 h. g Efficiency of Calpain 1, 5, and 6 knockdown. h Immunoblot analysis of c-FMS, α-tubulin, and Lamin B1. All data are shown as the mean ± SEM. *P < 0.05 by two-tailed, unpaired t-test (g). Representative results from at least three independent experiments are shown.
Fig. 3
Fig. 3
c-FMS proteolysis positively regulates osteoclastogenesis. a Schematic showing mutations in the TACE cleavage sites of c-FMS. TACE cleavage sites of c-FMS were replaced by the addition of 14 amino acids from insulin receptor sequences (FMSmut). b 293 T cells did not express c-FMS and were transduced with lentiviral particles encoding control, FMSwt or FMSmut. The cells were then stimulated with M-CSF for the indicated times. Protein expression of phospho-ERK, phospho-JNK, phospho-p38, and α-tubulin was determined by immunoblot analysis. cf BMDMs from c-FMSf/+ Mx1-Cre mice were transduced with lentivirus encoding control, wild-type FMS (FMSwt), or the TACE-uncleavable mutant FMS (FMSmut). The transduced BMDMs were stimulated with LPS (10 ng·mL−1) for 3 h (c) and 24 h (d). c The mRNA expression of TNFα and IL6 was measured by q-PCR. d TNFα and IL6 protein levels in the culture media were measured by Luminex multiplex cytokine assays. e Osteoclastogenesis assay. The left panel shows representative images of TRAP-stained cells. The right panel shows the percentage of TRAP-positive multinuclear cells (MNCs: more than three nuclei) per control (n = 6). Black scale bar: 100 μm. f Resorption pit assay. Bone resorption activity analysis of FMScon, FMSwt, or FMSmut cells. The left panel shows representative images, and the right panel shows the percentage of the resorbed pit area per total area. Red scale bar: 200 μm. All data are shown as the mean ± SEM. ns not significant, ND not detected. *P < 0.05 by one-way ANOVA with a post hoc Tukey test (cf). The data represent at least three experiments (bd, f).
Fig. 4
Fig. 4
FICDtgM mice exhibit an osteoporotic bone phenotype with increased osteoclast numbers. a, c BMDMs were transduced with retroviral particles encoding either control or FICD. a The protein expression of DDK-tagged FICD was determined by immunoblot analysis. b Osteoclastogenesis assay. The left panel shows representative images of TRAP-stained cells (n = 4). c Bone resorption activity analysis. The left panel shows representative images, and the right panel shows the percentage of the resorbed pit area per total area (n = 3). d BMDMs from wild type (WT) and FICDtgM mice. Immunoblot analysis of the expression of HA-tagged FICD protein. e–h Micro-CT analysis of femurs from 12-week-old male wild-type (WT) and FICDtgM mice (n = 7). Scale bar: 100 µm. e Representative images of distal femurs. f Bone parameters in distal femurs. Bone volume/tissue volume ratio (BV/TV), trabecular thickness (Tb.Th), trabecular number (Tb.N), and trabecular space (Tb.Sp) were determined by micro-CT analysis. g Representative images of cortical bone. h Cortical bone parameters. Cortical bone thickness (Ct.Th) and Cortical porosity. i, j Histomorphometric analysis of the distal femurs of 12-week-old male WT and FICDtgM mice (n = 6). i Representative image showing TRAP-positive, multinucleated osteoclasts (red). j The number of osteoclasts per bone surface (N.Oc/BS), osteoclast surface area per bone surface (Oc.S/BS), and eroded surface per bone surface (ES/BS). k CTX-1 (WT = 5, FICDtgM = 8) in the sera of WT and FICDtgM mice. All data are shown as the mean ± SEM. ns, not significant. *P < 0.05 by two-tailed, unpaired t-test (b, c, f, h, i).
Fig. 5
Fig. 5
FICDtgM mice show enhanced arthritic bone erosion. a, b BMDMs from WT and FICDtgM mice were cultured with M-CSF and RANKL for 3 days. a Osteoclastogenesis assay. The left panel shows representative images of TRAP-stained cells. The right panel shows the percentage of TRAP-positive multinuclear cells per WT cell (n = 3). b Resorption pit assay. The left panel shows representative images, and the right panel shows the percentage of the resorbed pit area per total area (n = 3). BMDMs from WT and FICDtgM mice were stimulated with LPS (10 ng·mL−1) for 3 h (c) and 24 h (d). c mRNA expression of TNF-α and IL-6 was measured by q-PCR. d TNFα and IL6 protein levels in the culture media were measured by Luminex multiplex cytokine assays. eh K/BxN serum transfer-induced arthritis model. Eight-week-old female wild-type and FICDtgM mice were administered K/BxN serum on days 0 and 2. e, f Time course of joint swelling and clinical score analysis of serum-induced arthritis in littermate control and FICDtgM mice (n = 6). (g) Representative images of the TRAP-stained tarsal bones (hind paws) of arthritic mice. h Histomorphometric analysis of tarsal bones. N.Oc/B.Pm Osteoclast number/bone parameter, Oc.S/BS osteoclast surface/bone surface, ES/BS eroded surface/bone surface. The black scale bar is 100 μm, and the red scale bar is 200 μm. All data are shown as the mean ± SEM. n.s. not significant. ND not detected. *P < 0.05 two-way ANOVA with a post hoc Tukey test (cf) or two-tailed, unpaired t-test (a, b, h).
Fig. 6
Fig. 6
The FICD augments NFATc1 expression by activating the MNK1/2/eIF4E axis. a, b BMDMs from WT and FICDtgM mice were stimulated with RANKL (50 ng·mL1) for the indicated times. a RT-qPCR analysis of Nfatc1 mRNA normalized to Hprt mRNA. b Immunoblot analysis with anti NFATc1, HA, or α-tubulin antibodies. c, d BMDMs from c-FMSf/+ Mx1-Cre mice were transduced with lentiviral particles encoding FMSwt or FMSmut and then cultured with M-CSF and RANKL. c Immunoblot analysis of whole cell lysate with anti-NFATc1 antibody. α-Tubulin was used as a control. The left panel shows representative images. The right panel shows the cumulative intensity of NFATc1 bands. The intensity of NFATc1 in FMSmut was set as 100%. d The mRNA expression level of NFATc1. e Immunoblot analysis of whole cell lysates with phospho-eIF4E antibodies. HA-tagged FICD was detected by HA-antibodies. α-Tubulin was used as a control. The left panel shows representative images. The right panel shows the cumulative percentage of the intensity of the band (at 24 h) relative to the control from three independent experiments. f, g BMDMs from WT mice were treated with CPG57380 at the indicated doses and then cultured with RANKL for 1 day. D: DMSO. f Immunoblot analysis with anti-NFATc1, phospho-eIF4E, or α-tubulin antibodies. The left panel shows representative images. The right panel shows the cumulative percentage of the intensity of the band relative to the control (RANKL + DMSO) (n = 4). g Nfatc1 mRNA expression was measured by qPCR relative to Hprt mRNA. the DMSO-treated RANKL condition was set as 100%. h Osteoclastogenesis assay. BMDMs from WT and FICDtgM mice were treated with CPG57380 at the indicated doses and then cultured with RANKL for an additional 3 days. The upper panel shows representative images of TRAP-stained cells. The bottom panel shows the percentages of TRAP-positive multinuclear cells (MNCs: more than three nuclei) per control from three independent experiments. Scale bar: 100 μm. i Cell viability assay. BMDMs from WT and FICDtgM mice were stimulated with CPG57380 at the indicated doses for 1 day. jn K/BxN serum transfer-induced arthritis model. Nine-week-old male C57BL/6 J mice received K/BxN serum on days 0 and 2. Vehicle or CPG57380 (40 mg·kg−1, CPG) was administered intraperitoneally (i.p.) from day 2 until day 13. j Schematic diagram showing the experimental design. k Ankle thickness. l Arthritis score. m Representative images of TRAP-stained histological sections from the calcaneocuboid and tarsometatarsal joints. Scale bar: 1 mm. n Histomorphometric analysis of tarsal bones. N.OC/B.Pm Osteoclast number/bone parameter. OC.S/BS osteoclast surface/bone surface. ES/BS Eroded surface/bone surface. All data are shown as the mean ± SEM. CTL, Control. *P < 0.05; n.s. not significant by one-way ANOVA with a post hoc Tukey test (a, fi, k, l) or two-tailed, unpaired t-test (c, d, e, n). The data represent at least three experiments.
Fig. 7
Fig. 7
The FICD enhances the activation of MNK1/2/eIF4E via DAP5/Fxr1. a Ingenuity pathway analysis of 145 FICD-interacting proteins. Pooled data from two biological replicates were analyzed. b Interaction map showing 20 FICD-interacting proteins in “Protein synthesis pathways” using STRING functional protein association analysis. c Frequencies of the proteins shown in (b). d The interaction of the FICD with DAP5 or Fxr1 was determined by immunoblot analysis with anti-DAP5, Fxr1, HA, or α-tubulin antibodies. Whole cell lysates of BMDMs from WT and FICDtgM mice were used for immunoprecipitation with anti-HA-tagged antibodies. Knockdown (KD) of DAP 5 (e, f, i, j) or Fxr1 (g, h, i, j) in both human CD14+ cells (e, g, i) and BMDMs (f, h, j). e–h The protein expression of NFATc1, p-eIF4E, eIF4E, DAP5, Fxr1, and α-tubulin was determined by immunoblot analysis. Osteoclastogenesis assay. KD of DAP5 or Fxr1 in hCD14+ cells (i) or in BMDMs (j) that were cultured with M-CSF and RANKL for 3 days. The left panel shows representative images of TRAP-stained cells. The right panel shows the percentages of TRAP-positive multinuclear cells (MNCs: more than three nuclei) per control from three independent experiments. CTL Control siRNAs. All data are shown as the mean ± SEM. *P < 0.05 by one-way ANOVA with a post hoc Tukey test (i, j). The data represent 2 biological replicates for mass spectrometry (ac) and three independent experiments (di).

Similar articles

Cited by

References

    1. Smolen JS, et al. Rheumatoid arthritis. Nat. Rev. Dis. Prim. 2018;4:18001. doi: 10.1038/nrdp.2018.1. - DOI - PubMed
    1. Schett G, Gravallese E. Bone erosion in rheumatoid arthritis: mechanisms, diagnosis and treatment. Nat. Rev. Rheumatol. 2012;8:656–664. doi: 10.1038/nrrheum.2012.153. - DOI - PMC - PubMed
    1. Guo Q, et al. Rheumatoid arthritis: pathological mechanisms and modern pharmacologic therapies. Bone Res. 2018;6:15. doi: 10.1038/s41413-018-0016-9. - DOI - PMC - PubMed
    1. Lin H, et al. Discovery of a cytokine and its receptor by functional screening of the extracellular proteome. Science. 2008;320:807–811. doi: 10.1126/science.1154370. - DOI - PubMed
    1. Paniagua RT, et al. c-Fms-mediated differentiation and priming of monocyte lineage cells play a central role in autoimmune arthritis. Arthritis Res Ther. 2010;12:R32. doi: 10.1186/ar2940. - DOI - PMC - PubMed