. 2021 Oct;598(7882):682-687.
doi: 10.1038/s41586-021-03994-2. Epub 2021 Oct 20.

KDM5B promotes immune evasion by recruiting SETDB1 to silence retroelements

Affiliations

KDM5B promotes immune evasion by recruiting SETDB1 to silence retroelements

Shang-Min Zhang et al. Nature. 2021 Oct.

Abstract

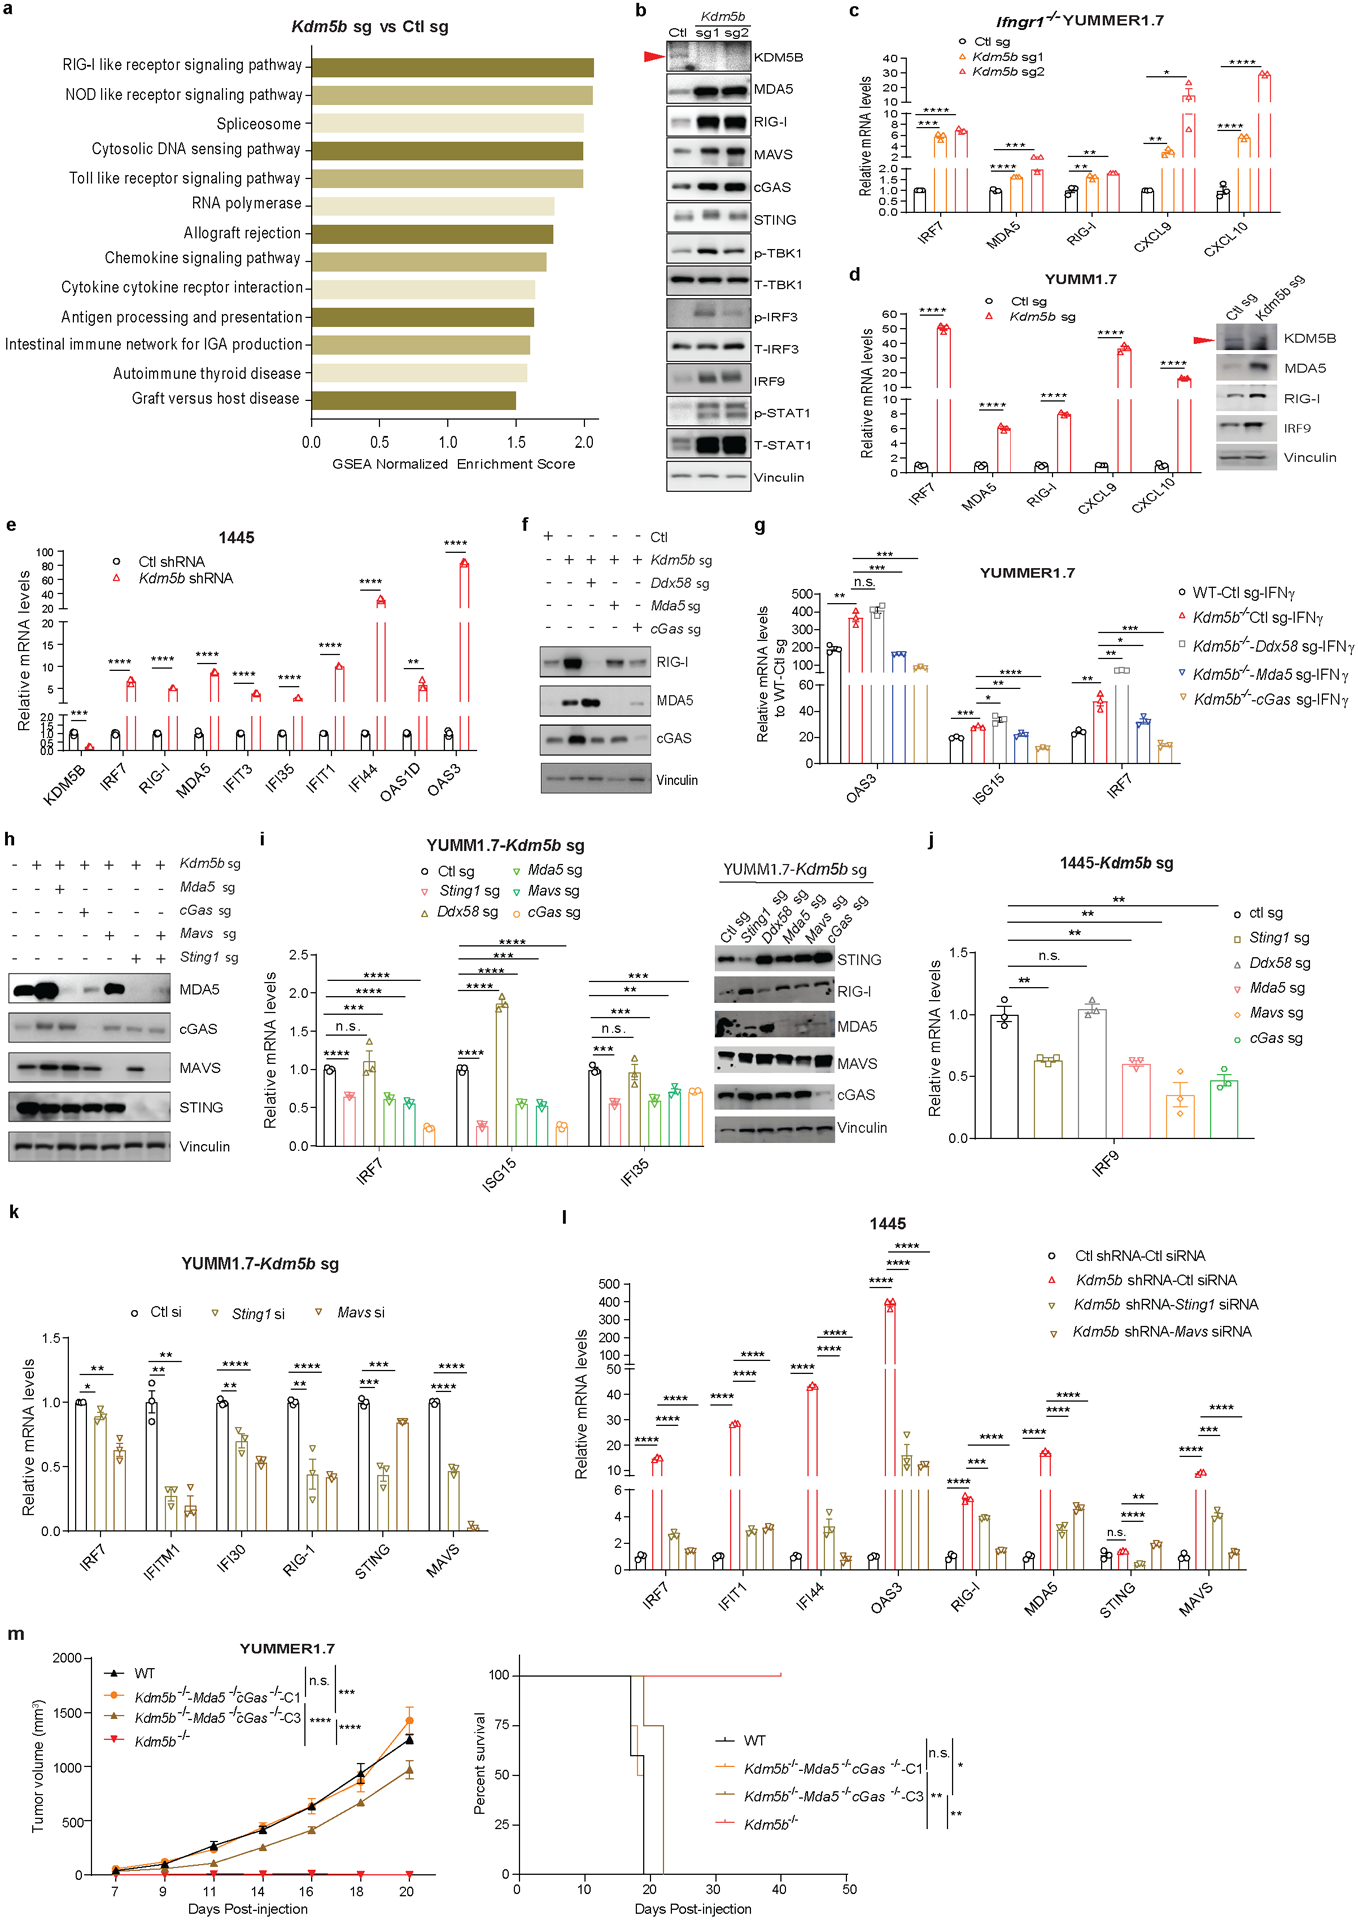
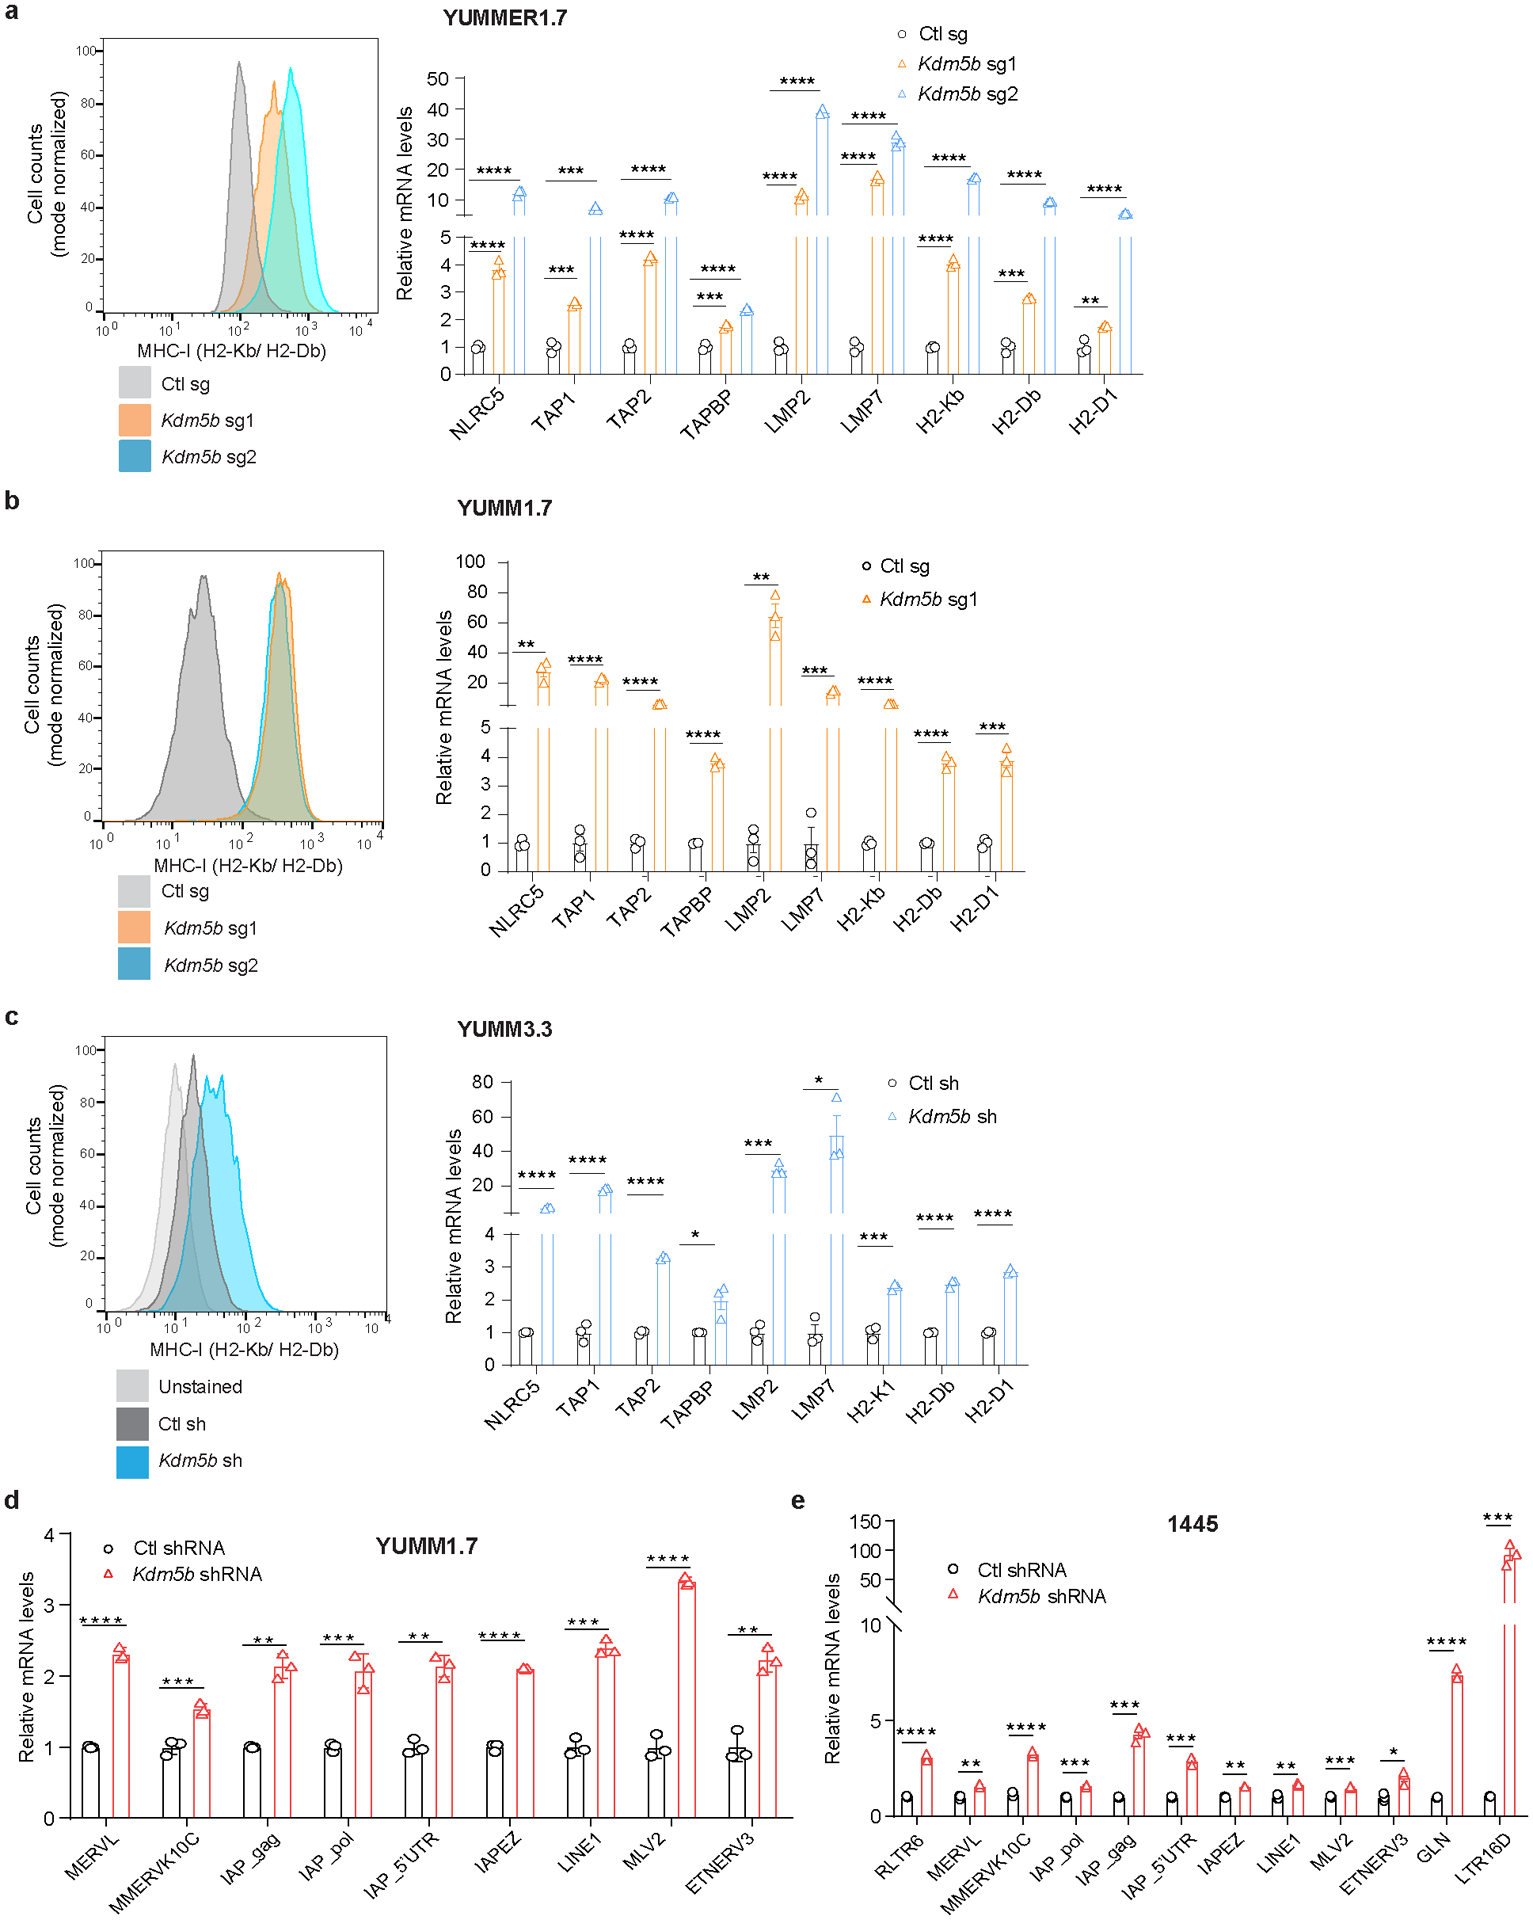
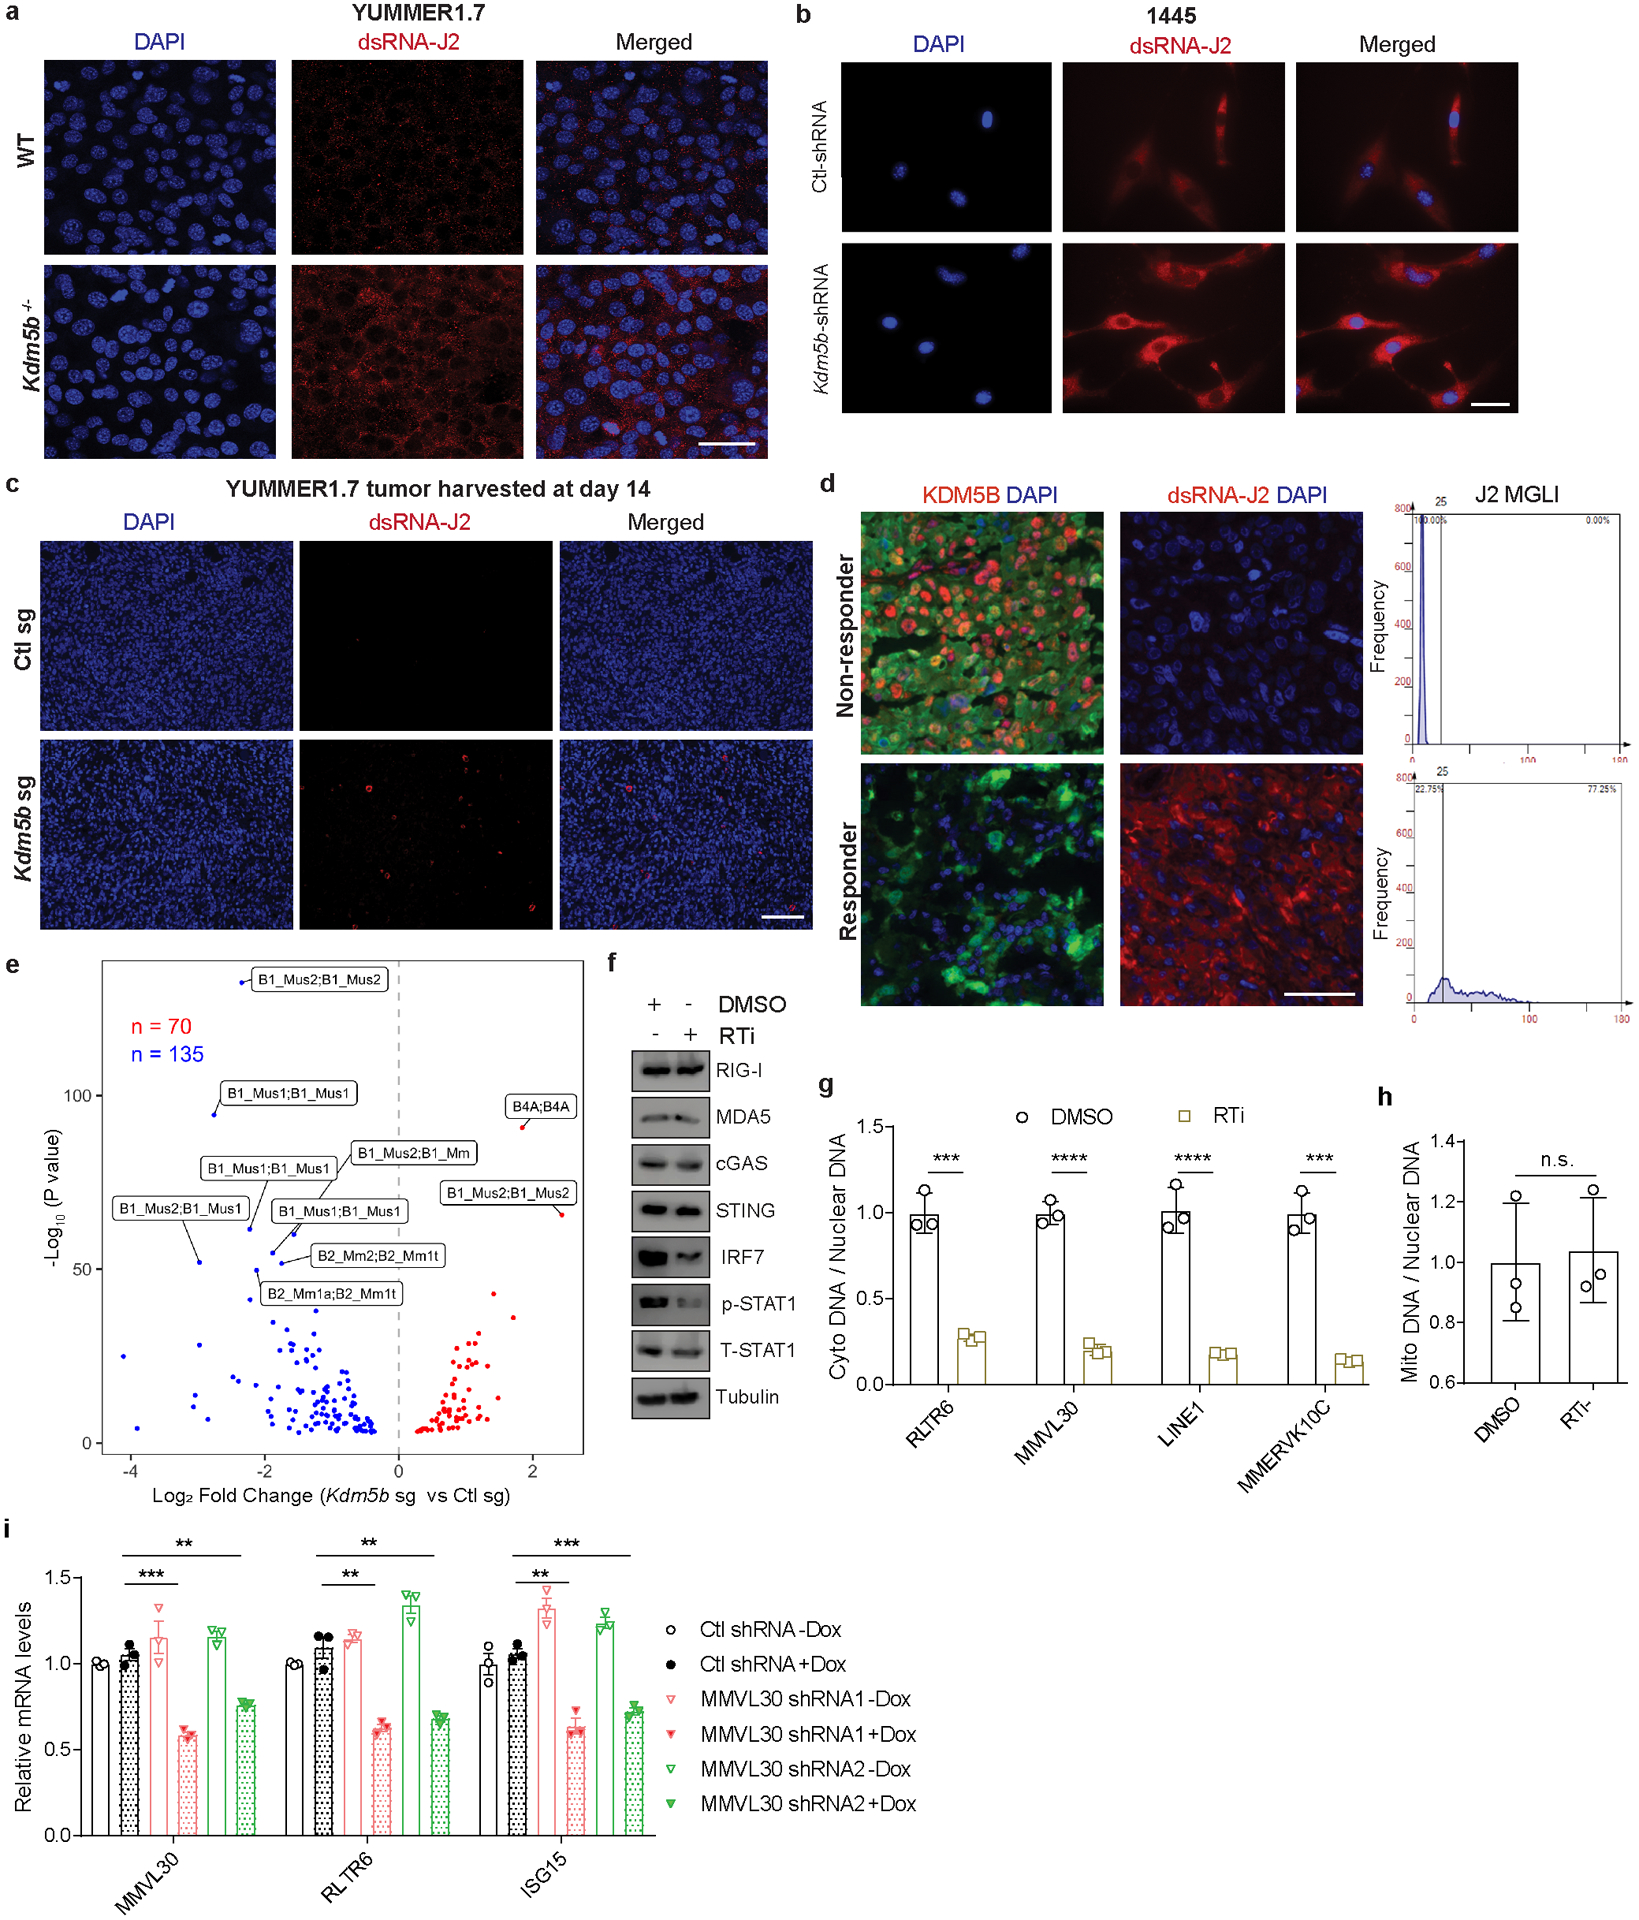
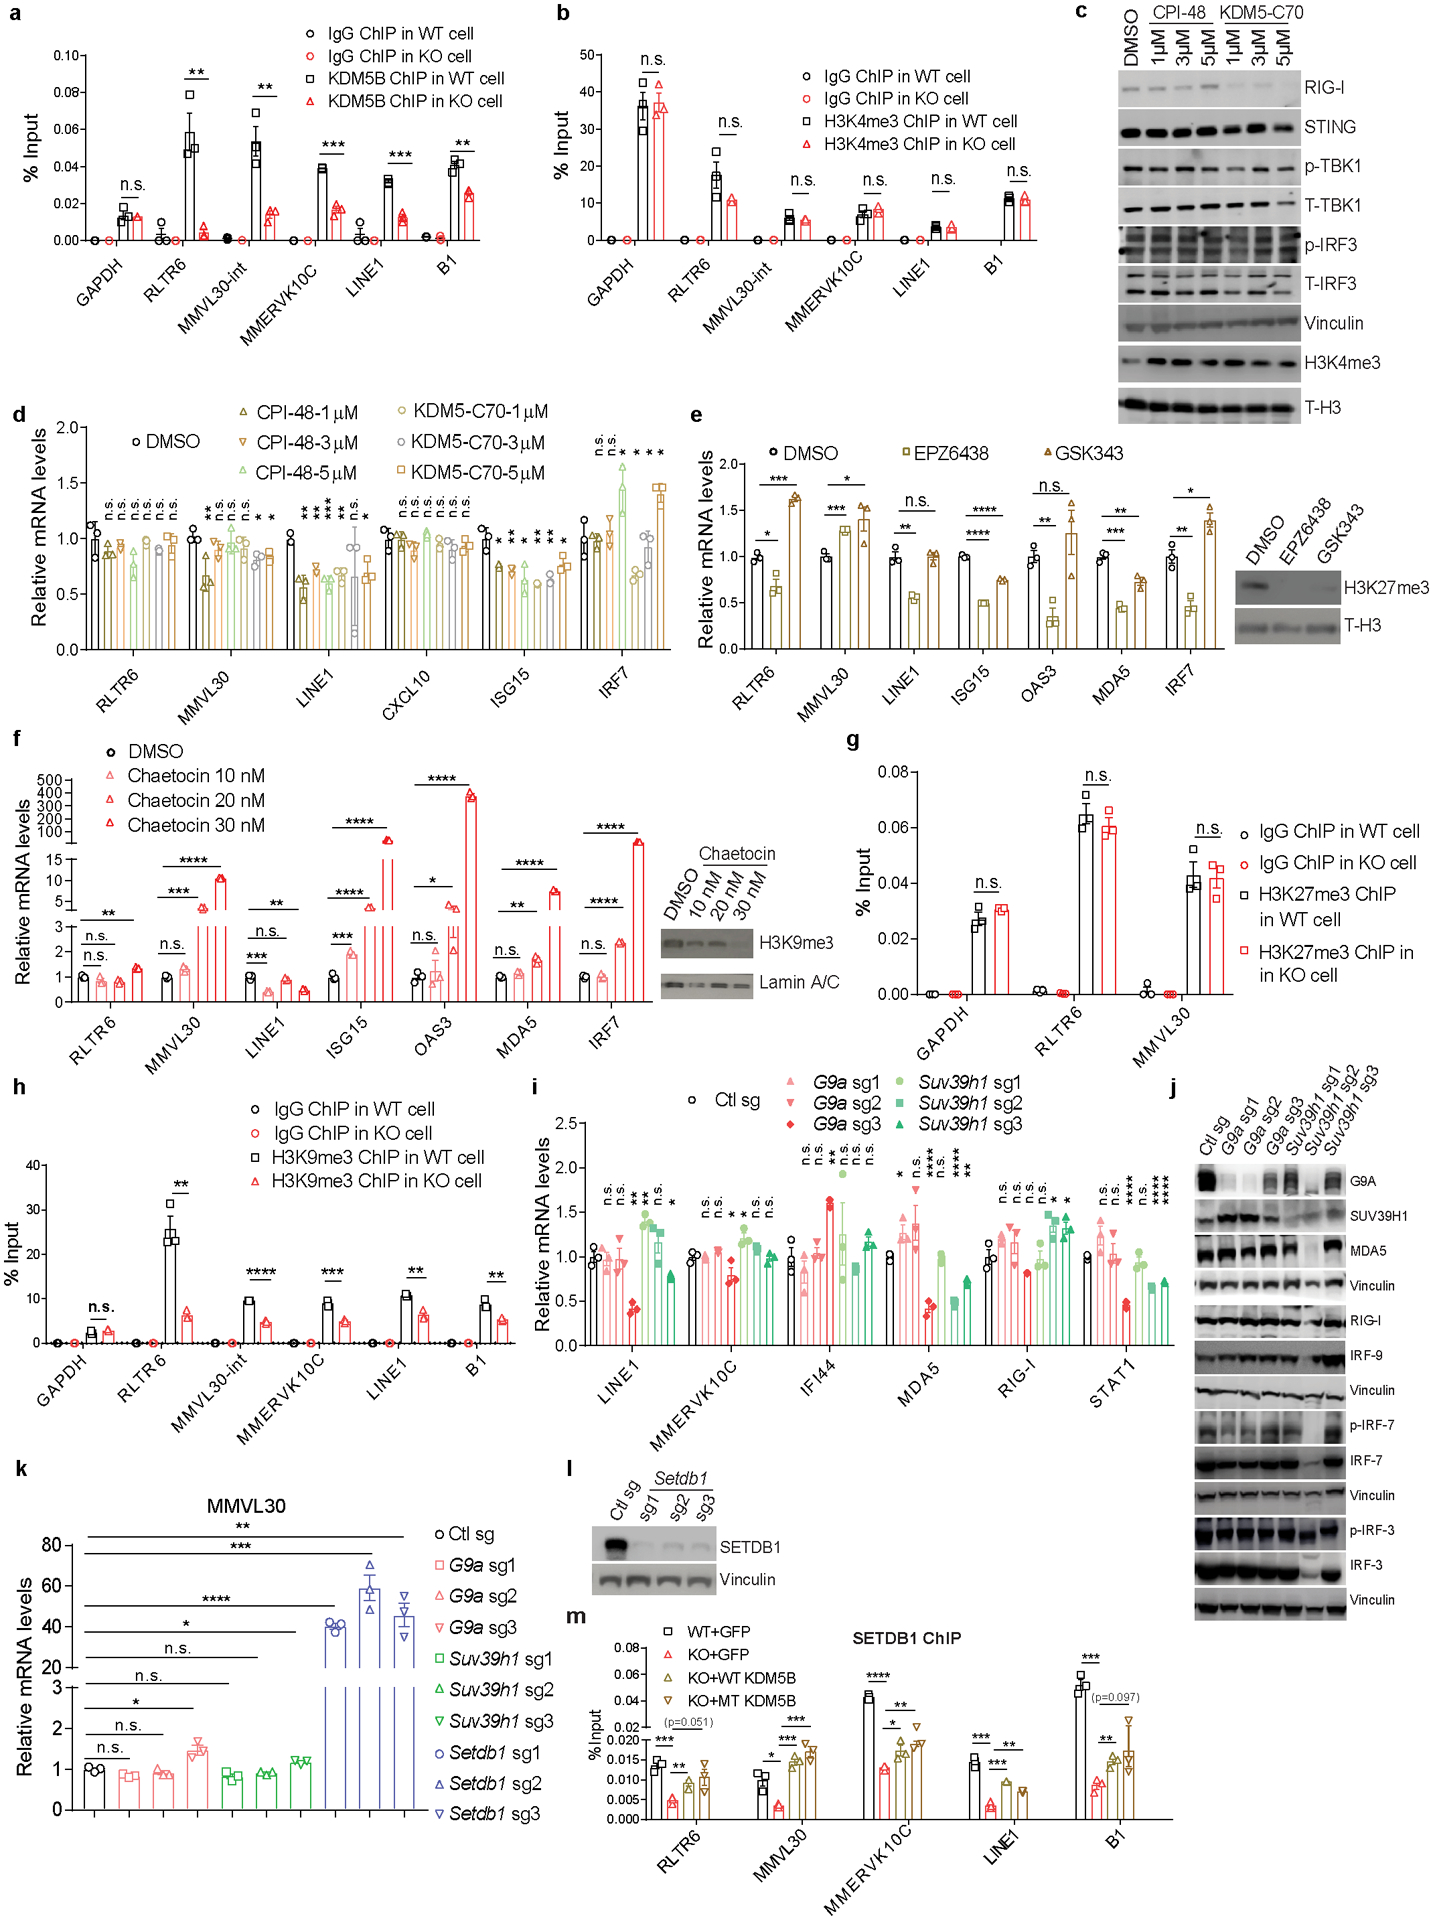
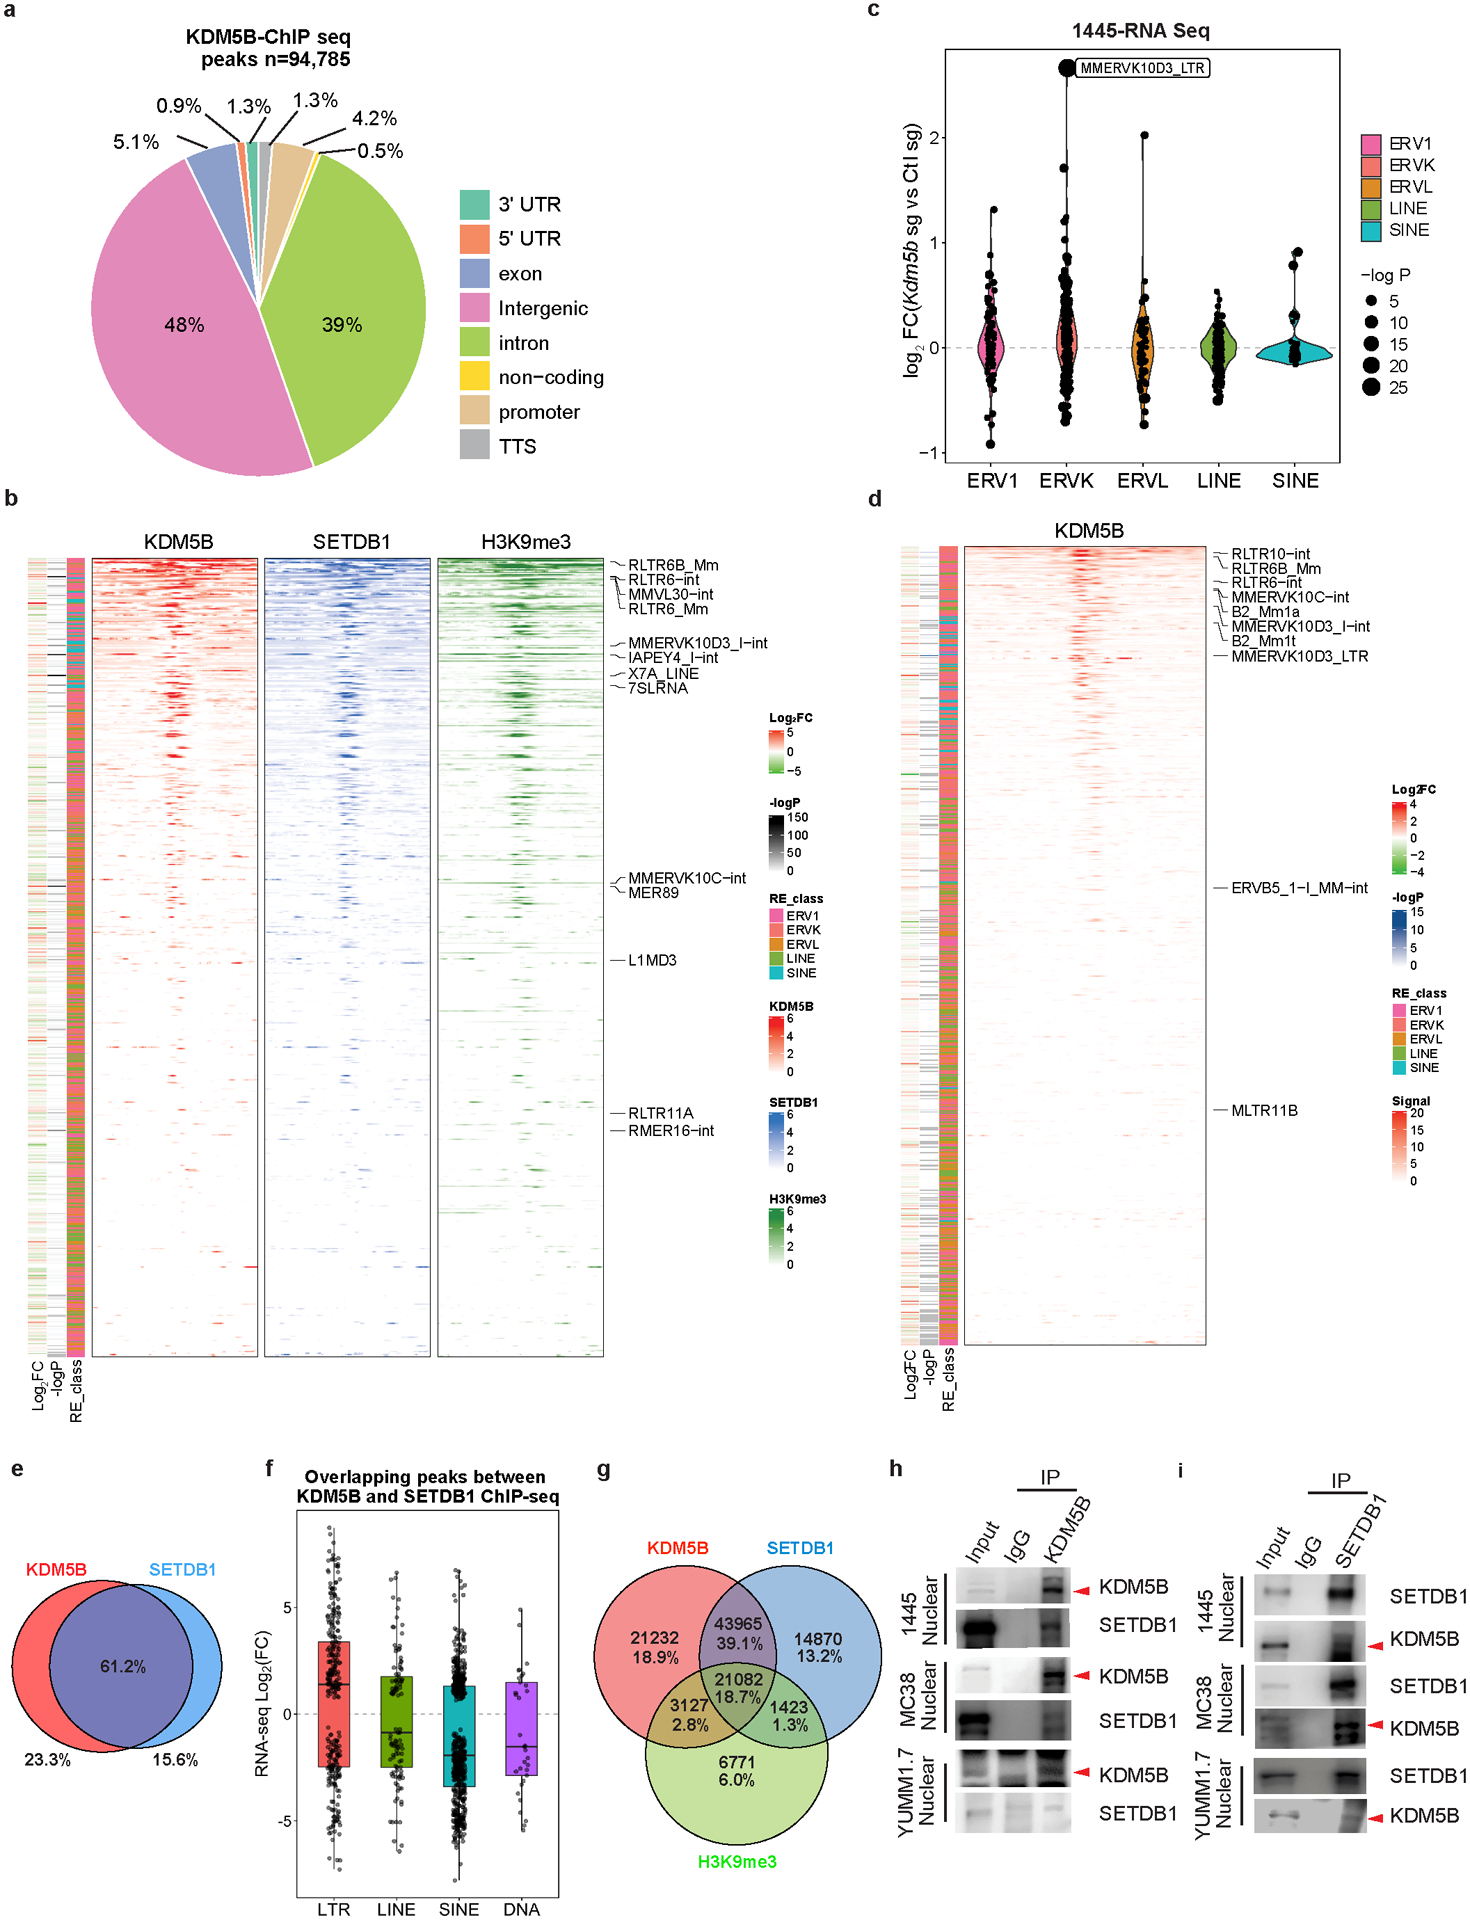
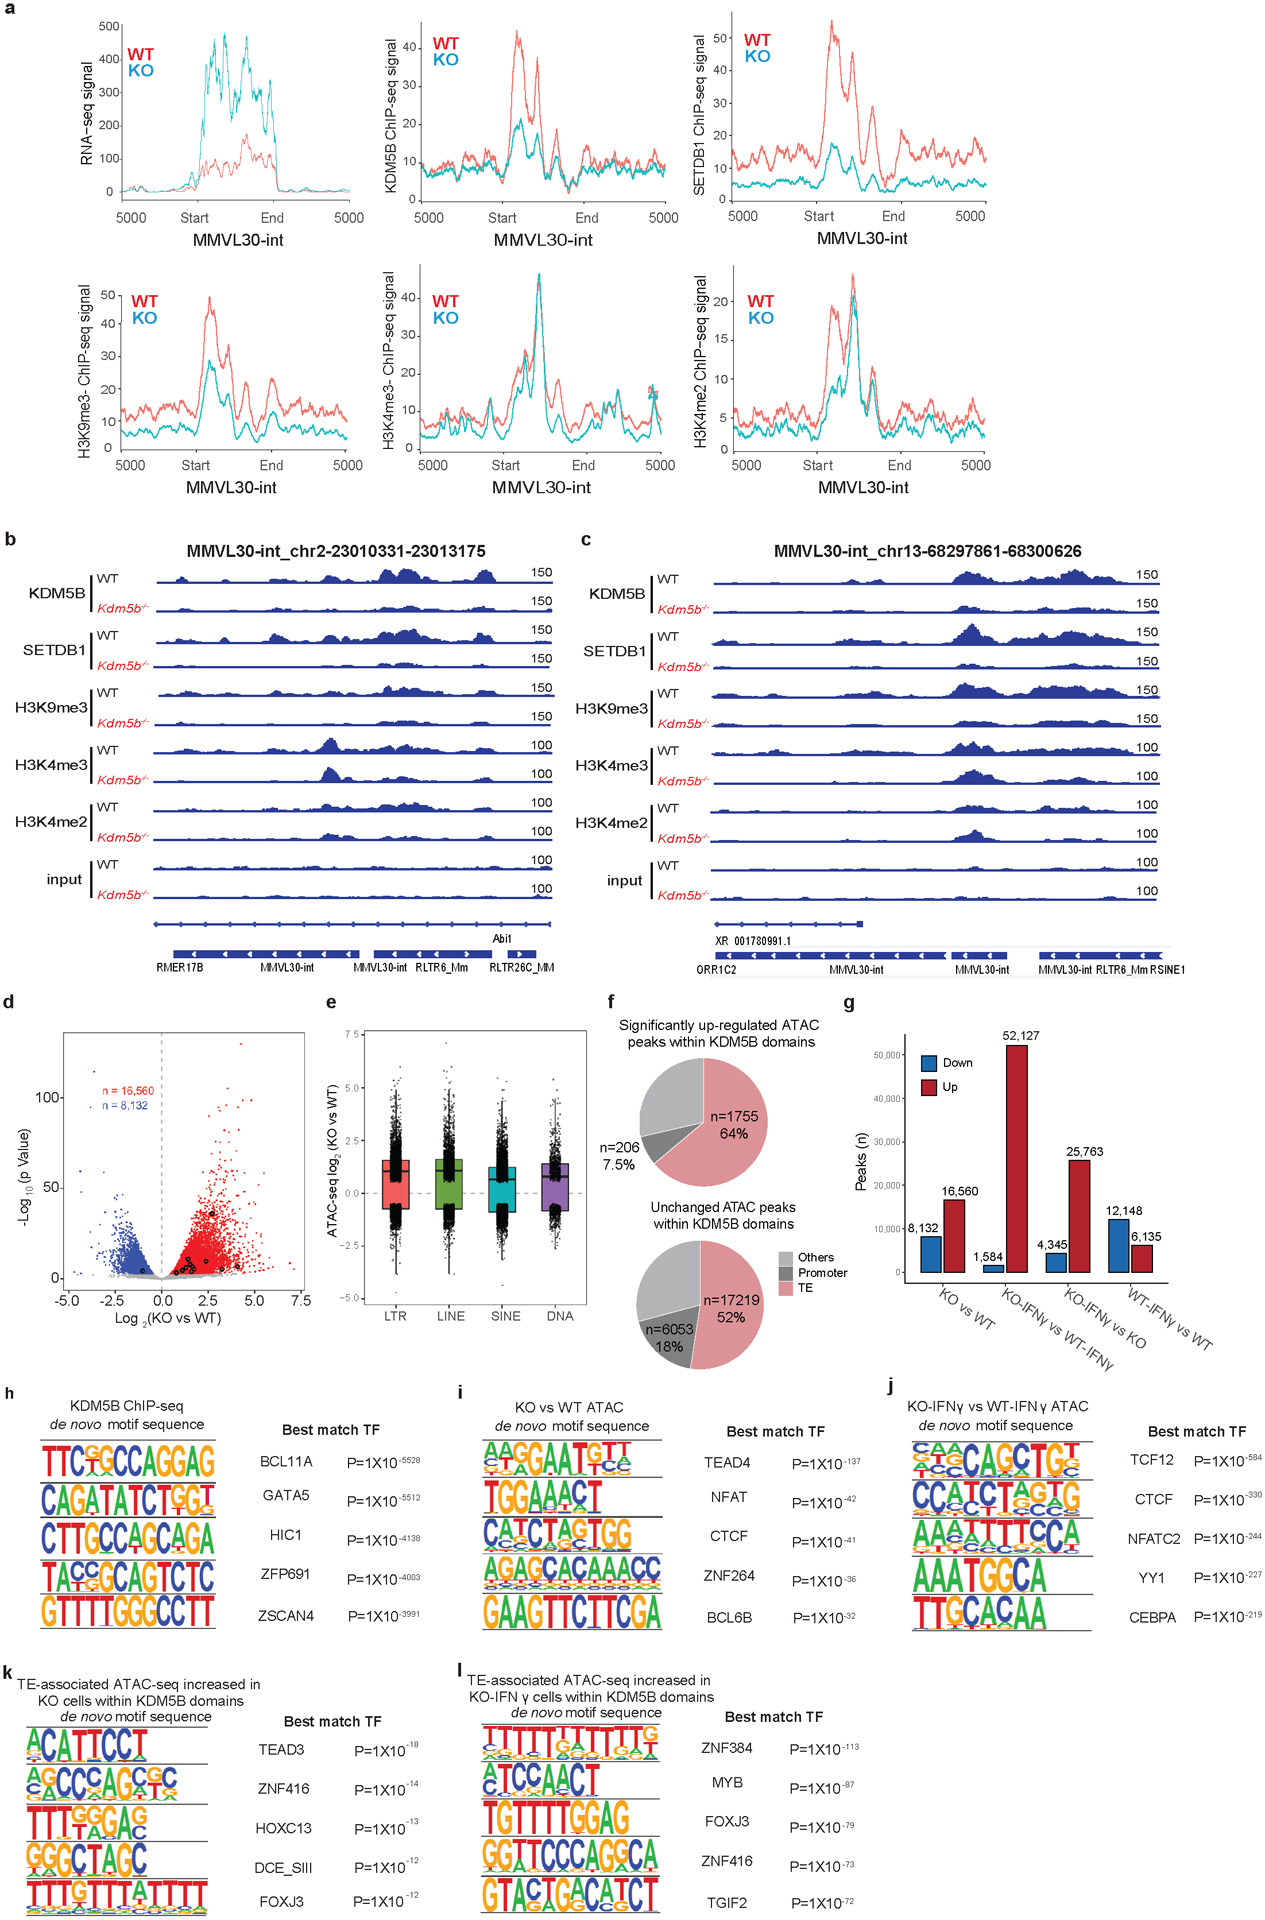
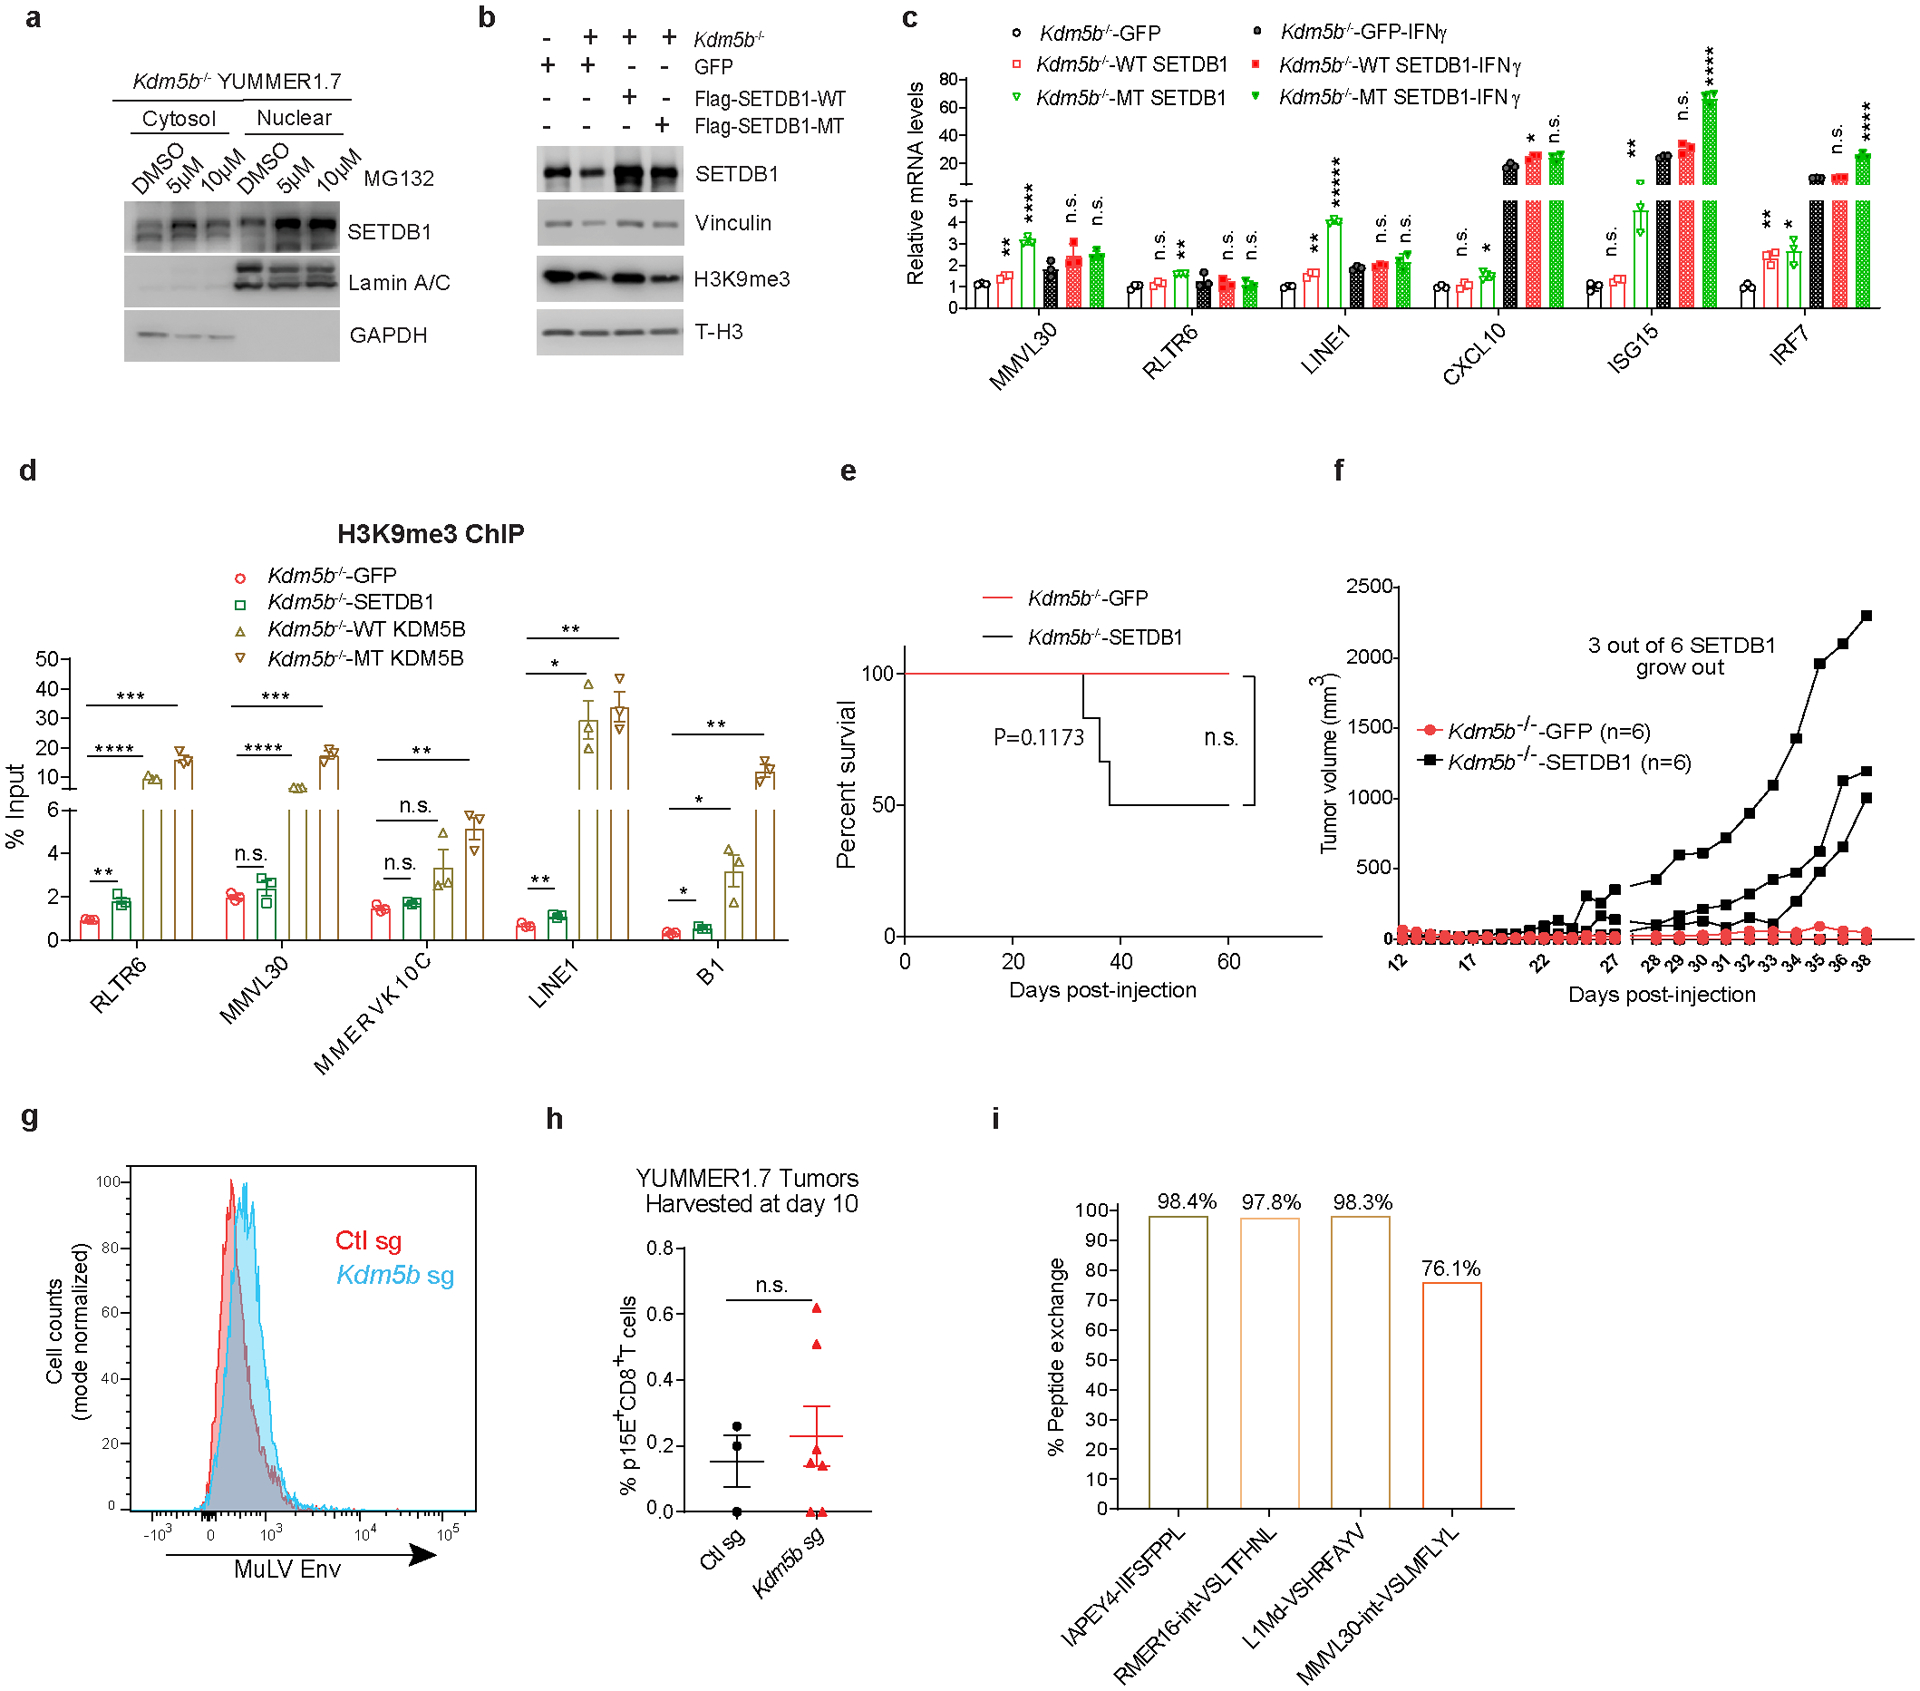
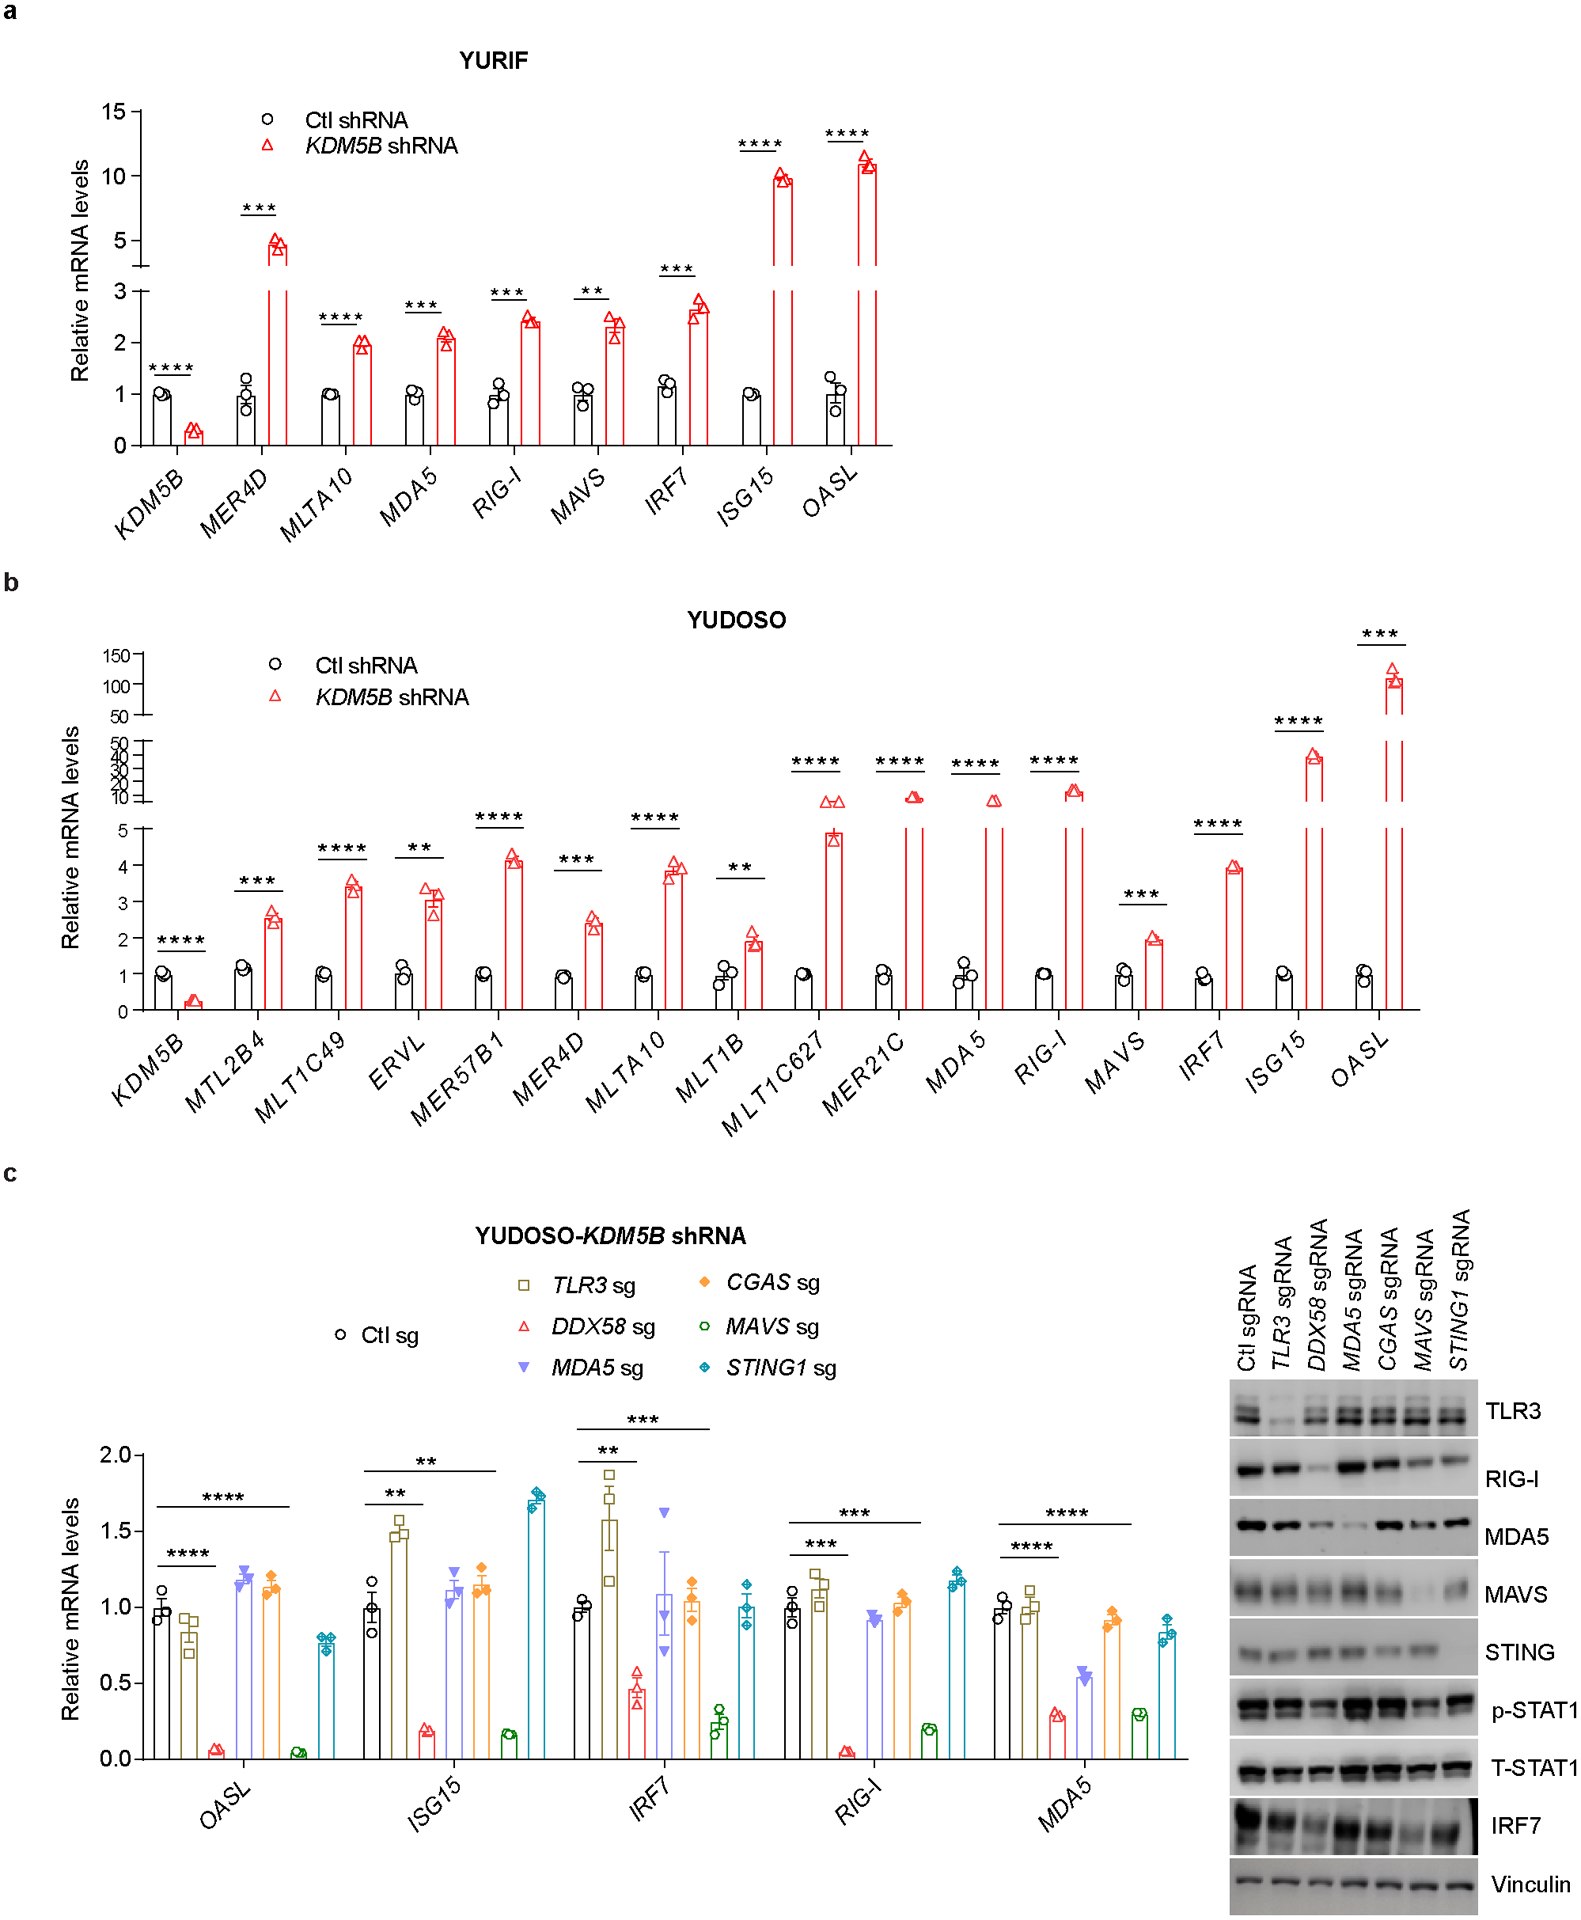
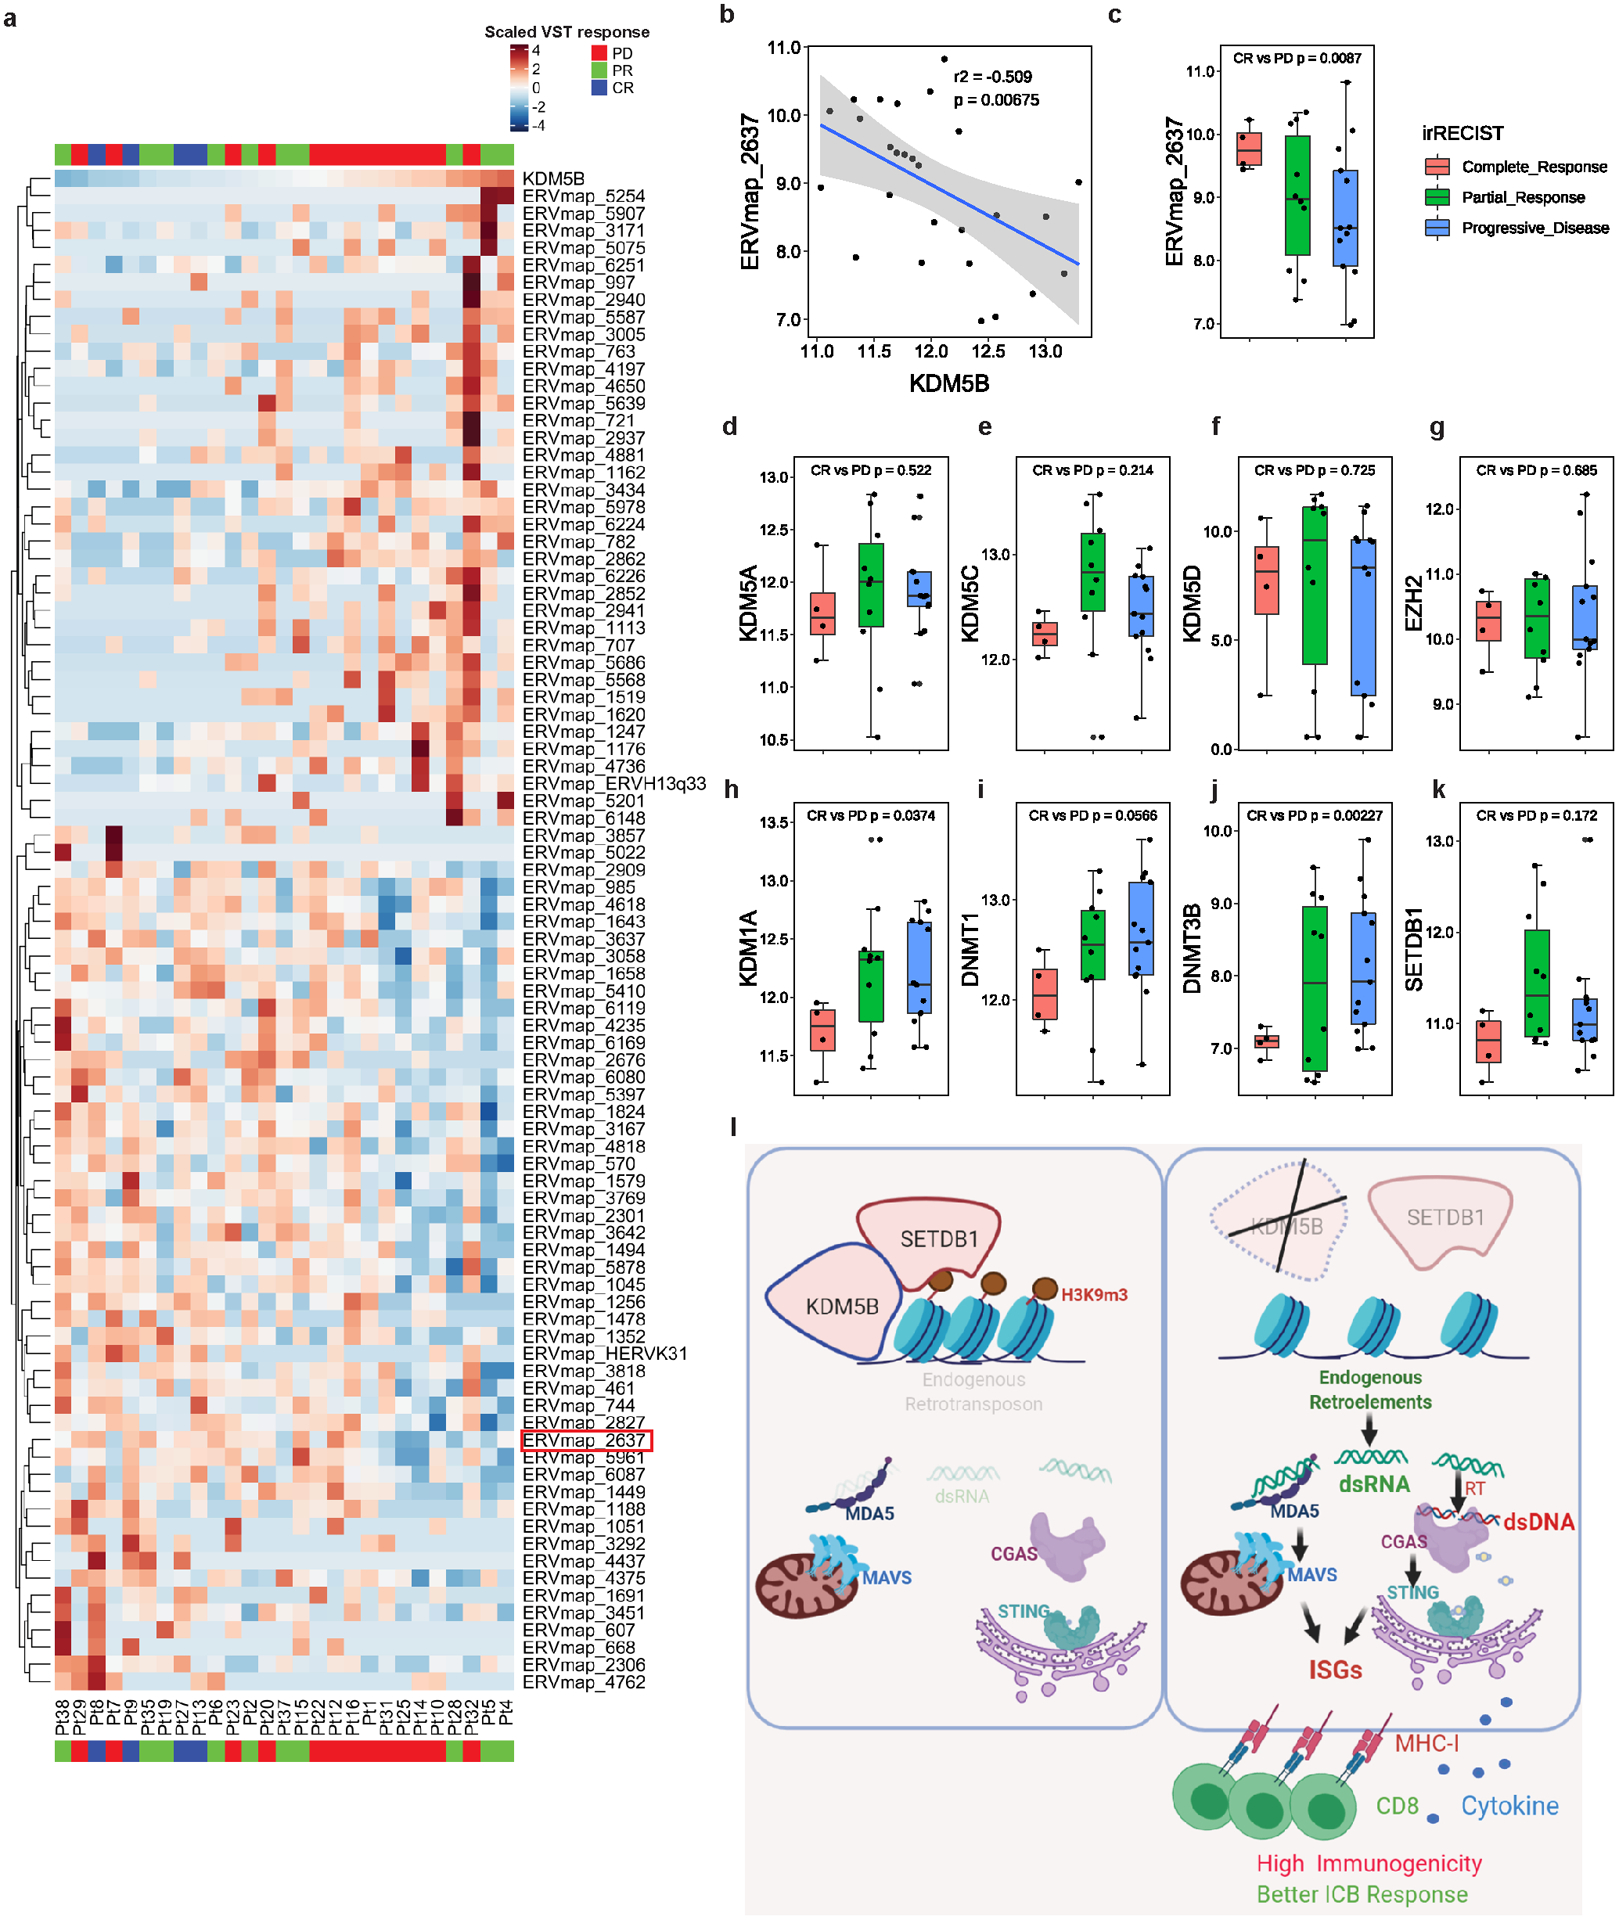
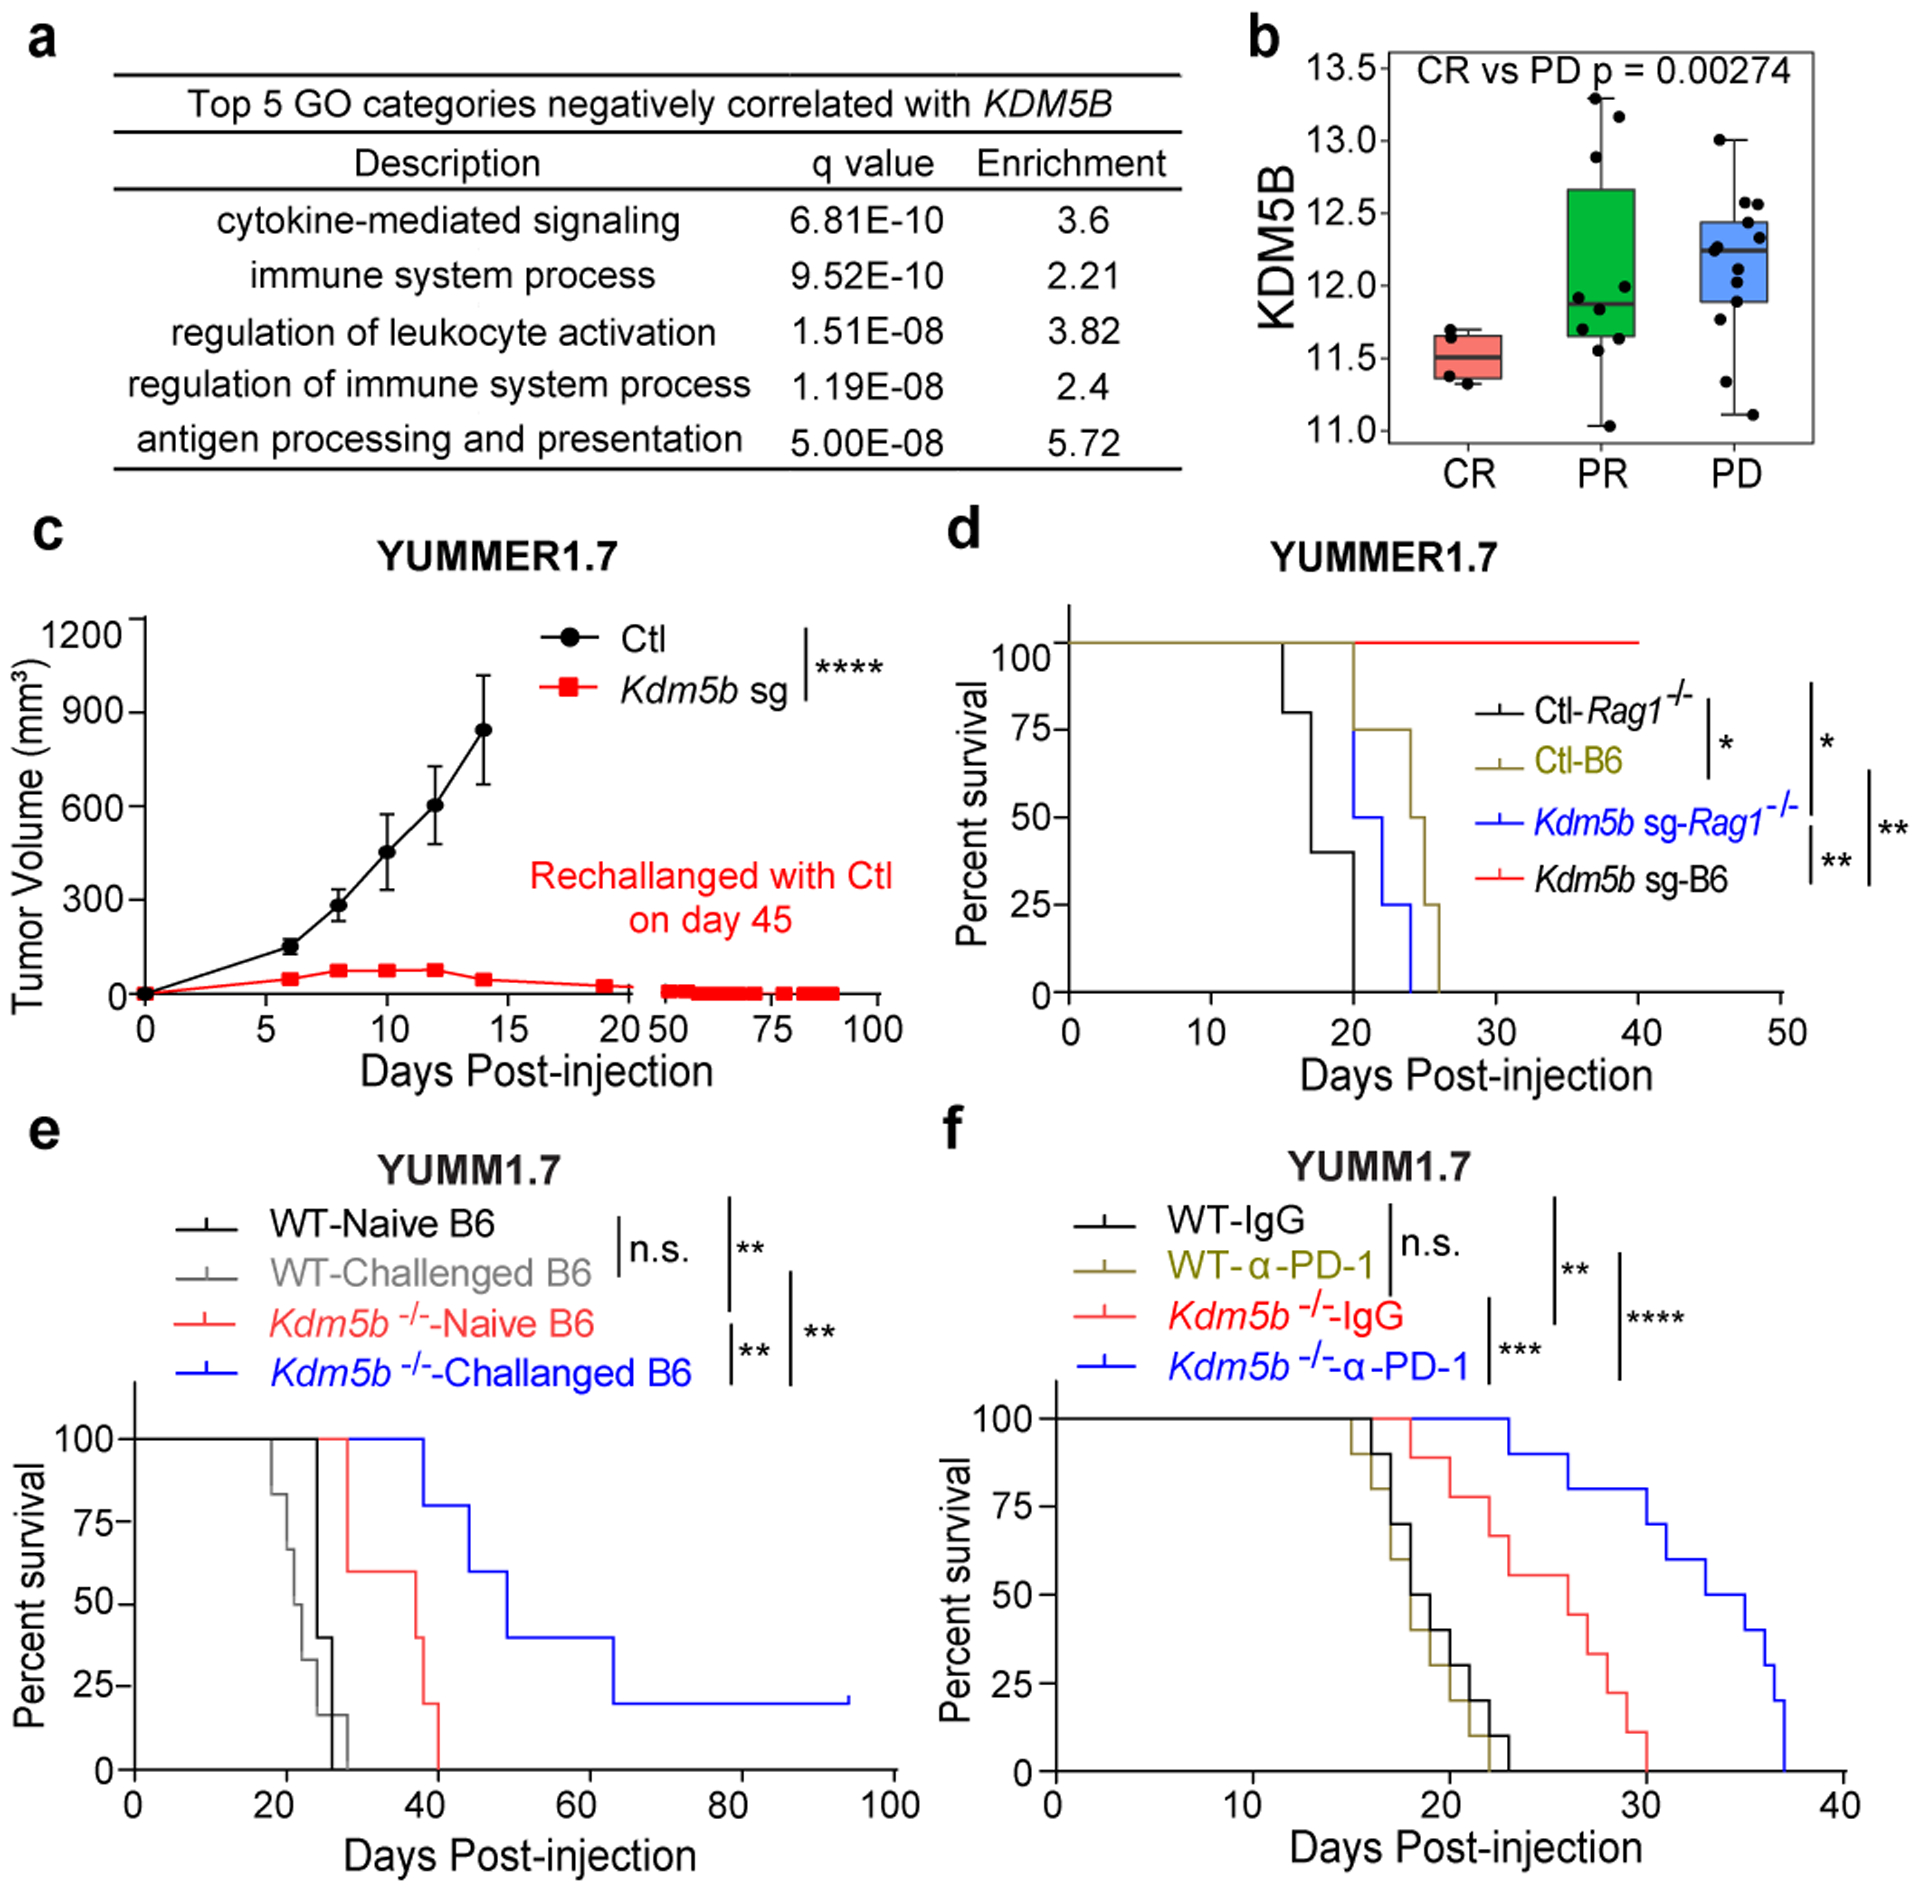
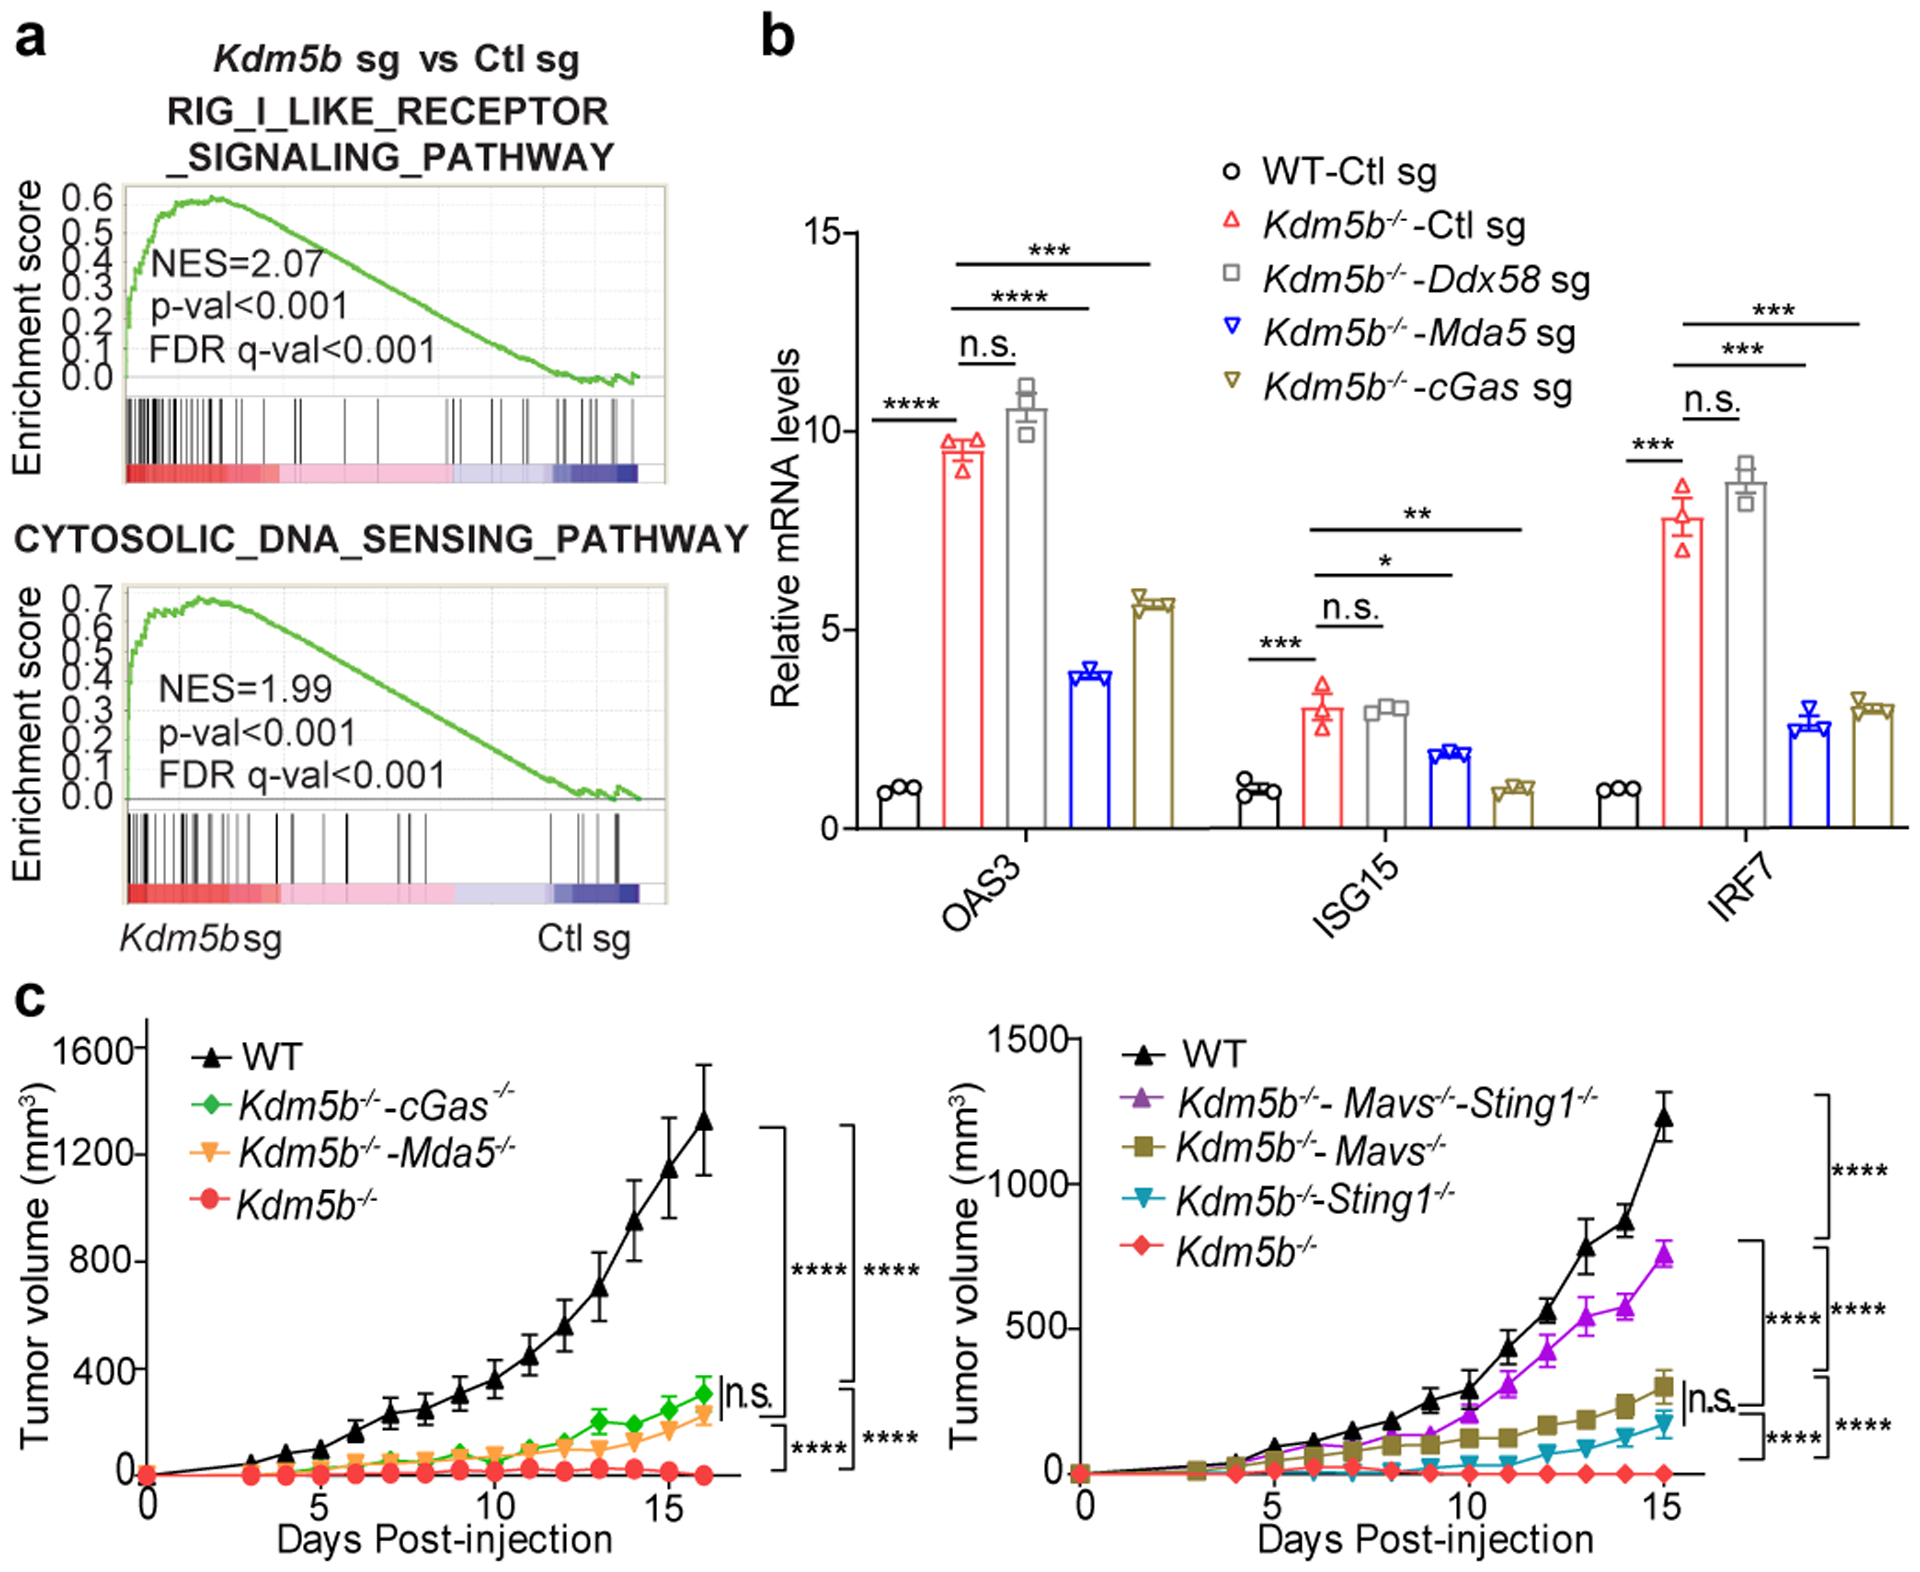
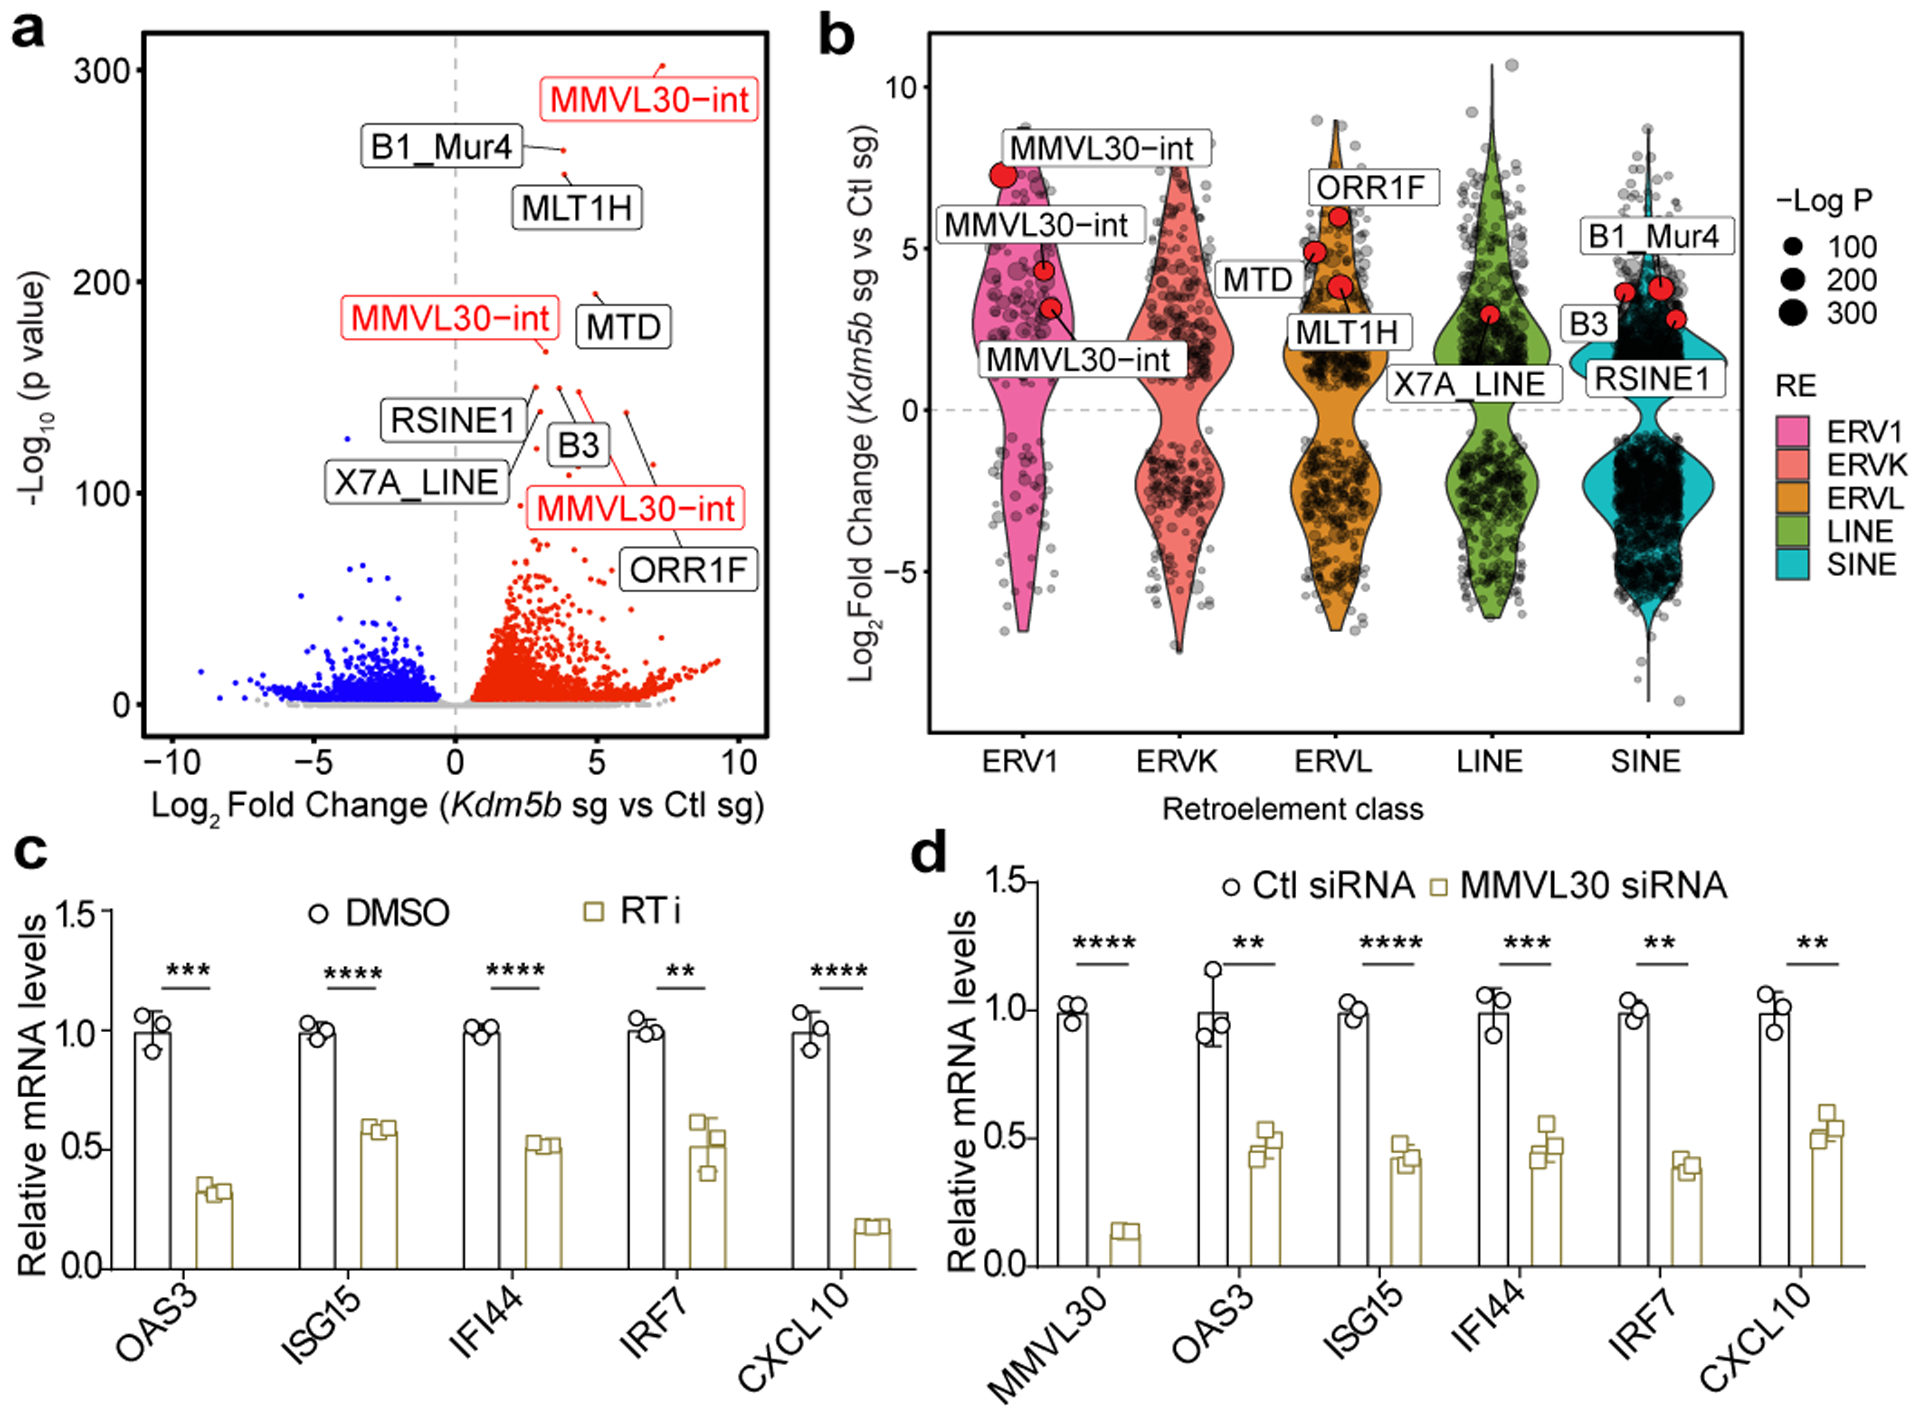
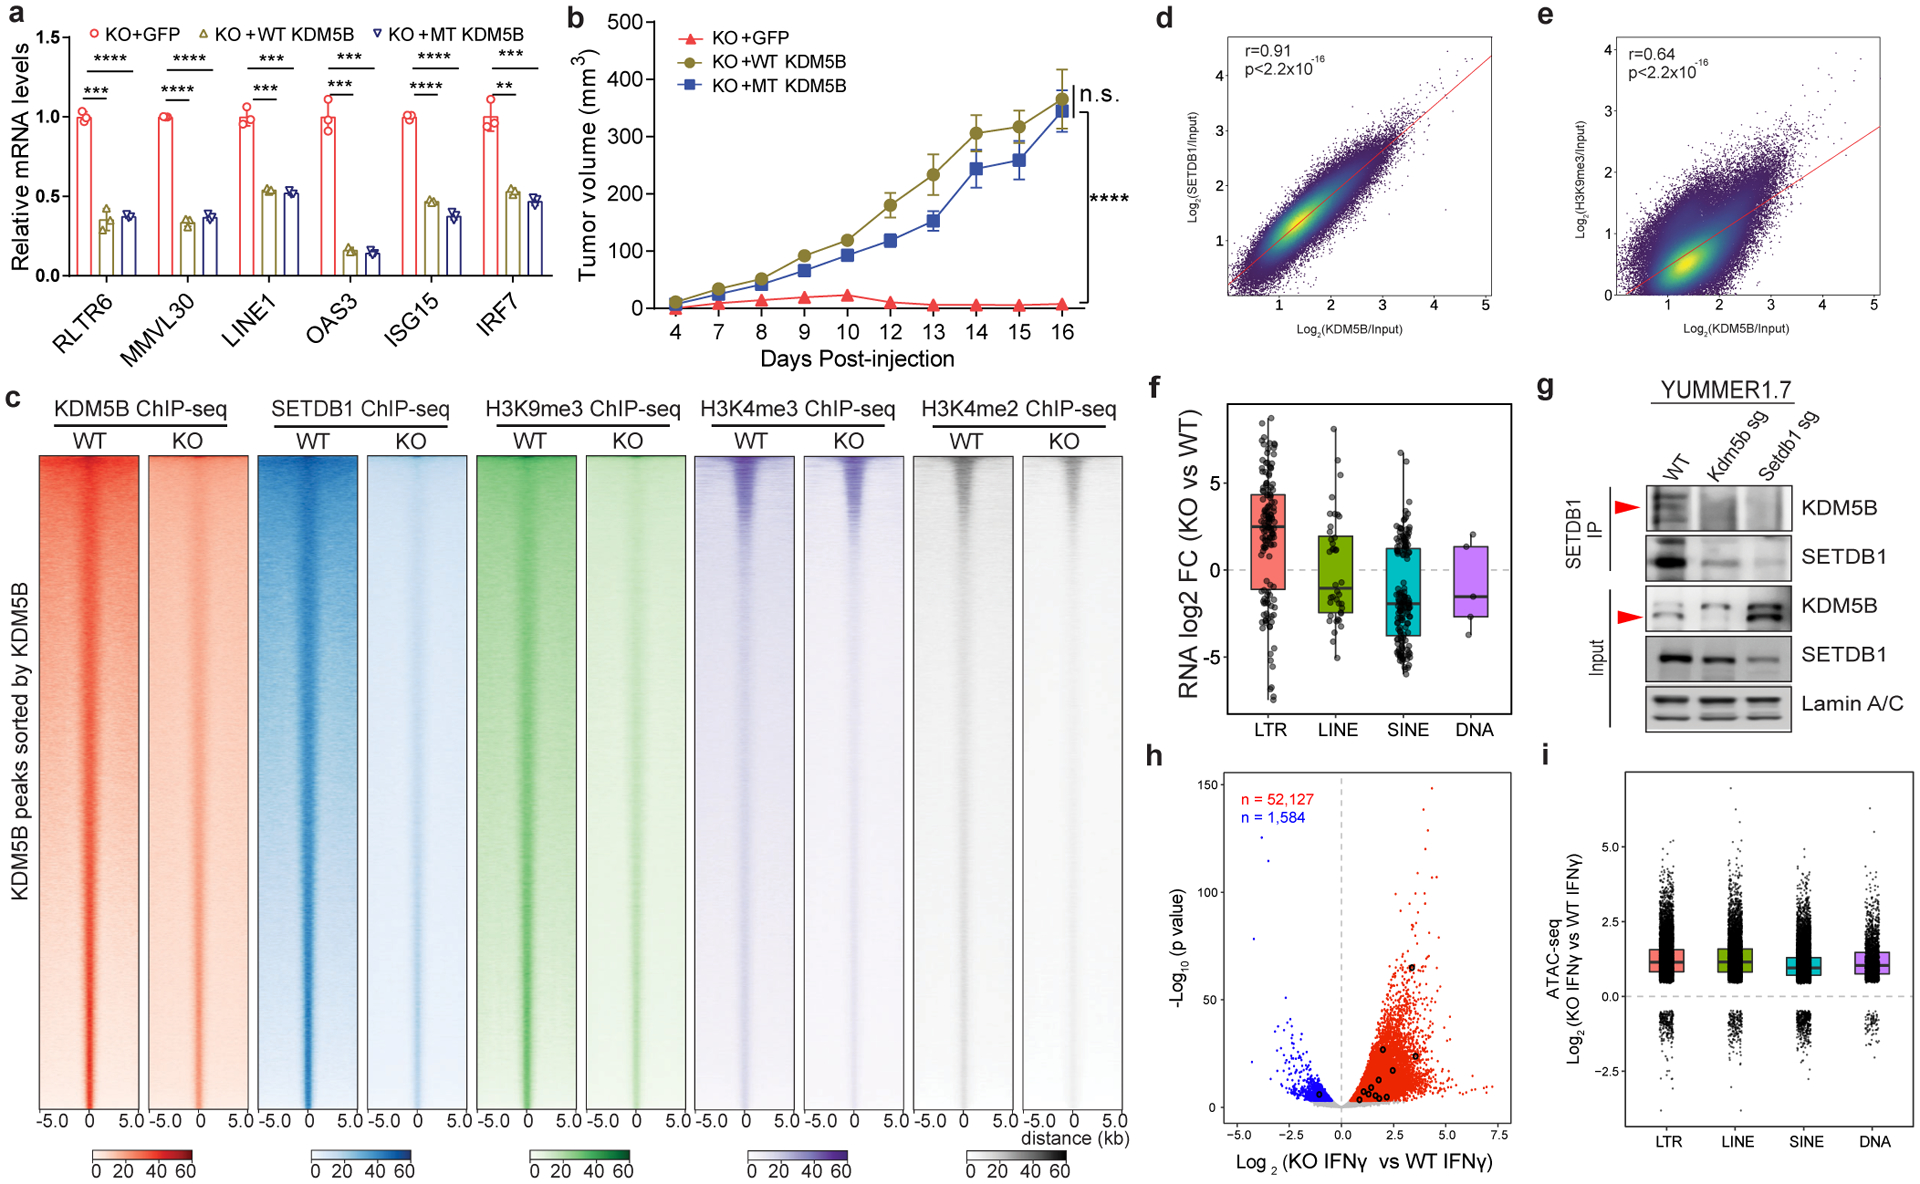
Tumours use various strategies to evade immune surveillance1,2. Immunotherapies targeting tumour immune evasion such as immune checkpoint blockade have shown considerable efficacy on multiple cancers3,4 but are ineffective for most patients due to primary or acquired resistance5-7. Recent studies showed that some epigenetic regulators suppress anti-tumour immunity2,8-12, suggesting that epigenetic therapies could boost anti-tumour immune responses and overcome resistance to current immunotherapies. Here we show that, in mouse melanoma models, depletion of KDM5B-an H3K4 demethylase that is critical for melanoma maintenance and drug resistance13-15-induces robust adaptive immune responses and enhances responses to immune checkpoint blockade. Mechanistically, KDM5B recruits the H3K9 methyltransferase SETDB1 to repress endogenous retroelements such as MMVL30 in a demethylase-independent manner. Derepression of these retroelements activates cytosolic RNA-sensing and DNA-sensing pathways and the subsequent type-I interferon response, leading to tumour rejection and induction of immune memory. Our results demonstrate that KDM5B suppresses anti-tumour immunity by epigenetic silencing of retroelements. We therefore reveal roles of KDM5B in heterochromatin regulation and immune evasion in melanoma, opening new paths for the development of KDM5B-targeting and SETDB1-targeting therapies to enhance tumour immunogenicity and overcome immunotherapy resistance.


Conflict of interest statement

Competing interests: The authors declare no competing interests.

Figures

Extended Data Figure 1.
Extended Data Figure 1.. KDM5B expression is negatively correlated with anti-tumor immunity, and depletion of KDM5B in mouse melanoma tumor cells induces strong anti-tumor immunity and enhances response to anti-PD-1 treatment.
A, Spearman correlation coefficient scores of selected genes negatively correlated with KDM5B gene expression from the melanoma TCGA dataset, categorized by their functions. B, Box plot showing expression levels of CD8A, CD8B, IFNG, TNF, CXCL9 and CXCL10 in melanoma patient samples from the TCGA dataset are higher in “KDM5B low” group (lowest quartile) than in “KDM5B high” (highest quartile) group. Statistical significance was computed with the unpaired two-sided Student’s t test. c, Immunofluorescence staining of pre-treatment melanoma samples with a melanoma cocktail (S100, HMB45 -green), KDM5B (red), and DAPI (blue). Images A-C are representative images from 3 independent non-responders to anti-PD-1 treatment; Images D-F are representative images from 3 independent responders. Cell-specific KDM5B expression levels of KDM5B and melanoma markers in the tumor microenvironment are displayed in 2D dot plots in non-responders (G) and responders (H). Each dot represents the mean fluorescent intensities of a single cell for KDM5B and the melanoma marker cocktail. Cells that are positive for both KDM5B and melanoma marks are in the upper right quadrants. (I) displays the frequency and distribution of expression levels of KDM5B in responders (green) and non-responders (red). MGLI= mean grey level intensity. Cutoff values for positive settings are denoted by the horizontal and vertical bars. Scale bar=100 μm. d, Survival curves of C57BL/6 mice subcutaneously injected with 500,000 control (black) (n=6) or Kdm5b−/− (Kdm5b sg) (red) (n=6) YUMMER1.7 cells. Mice injected with Kdm5b−/− cells had completely regressed tumors, and were re-challenged with control tumor cells on day 45 after initial tumor injection. Data are representative of two independent experiments. Log-rank test for survival curves, **p=0.004. e, Tumor growth curves of C57BL/6 mice injected with polyclonal YUMMER1.7 cells with stable lentiviral Ctl sg (n=5), Kdm5b sg1 (n=5) or Kdm5b sg2 (n=5), with western blot analyses (insert) showing knockout efficacy of KDM5B. Data are representative of two independent experiments. Data are mean ± SEM. 2-way ANOVA analysis for comparison at day 18 after tumor injection, ****p<0.0001. For gel source data, see Supplementary Fig. 1. f, Representative images of immunofluorescent staining of CD3 (green), Melan A (red) and DAPI (blue) (left) and Quantification of CD3+ cells per view field (3–5 view fields per tumor; each dot represents the mean for each tumor; 5 tumors per group) (right) from Ctl, Kdm5b sg1 and Kdm5b sg2 YUMMER1.7 tumors harvested at day 14 after injection. scale bar=200 μm. Quantification data are mean ± SD; Unpaired two-sided Student’s t-test, **p= 0.0081 for Ctl vs sg1; **p=0.0063 for Ctl vs sg2. g, Quantitation of the percentages of CD4+ and CD8+ cells in total CD45+ immune cells using flow cytometry analysis of control and Kdm5b sgRNA tumors. Unpaired two-sided Student’s t-test for each comparison, *p=0.036 for CD4+%; *p=0.024 for CD8+%. Data are representative of two independent experiments. Data are mean± SD. h, Representative flow cytometry plots showing CD8+ T cells in Ctl and Kdm5b sg YUMMER1.7 tumors harvested at day 14 after tumor injection. i. Representative immunohistochemical staining of CD8 (CD8+ T cells) and cleaved caspase-3 in control and Kdm5b sg YUMMER1.7 tumors at day 14 after injection. scale bar=100 μm. Data are representative of three independent experiments. j,k, Tumor growth curves (j) and survival curves (k) of C57BL/6 mice injected with single clones of Kdm5b−/− YUMMER1.7 cells, WT (n=5), 1G8 (n=5), 4B5 (n=5), 4H1(n=5) and 4H3(n=5) are clone numbers. Statistical significance of tumor growth curves was analyzed with 2-way ANOVA, ****p<0.00001. Data are representative of two independent experiments. Data are mean± SEM. Statistical significance of tumor survival was analyzed with log-rank (Mantel-Cox) test. **p=0.0018. l, Tumor growth curves of wild-type C57BL/6J (B6) mice injected with control (Ctl) (n=4) or Kdm5b−/− (Kdm5b sg) (n=4) YUMMER1.7 cells or Rag1−/− mice injected with control (n=5) or Kdm5b−/− YUMMER1.7 cells (n=4). Data represent one experiment. Data are mean ± SEM. ****p<0.0001. m, Tumor growth curves of WT (n=5) and Kdm5b−/− YUMM1.7 (n=4) in Rag1−/− mice. Western blot of the cell lines is shown on the right. Data represent one experiment. Data are mean ± SEM. 2-way ANOVA analysis for comparison at day 25 after tumor injection, ****p<0.0001. For gel source data, see Supplementary Fig. 1. n, Tumor growth curves of C57BL/6J (B6) mice that rejected Kdm5b−/− YUMMER1.7 tumors (Challenged B6) rechallenged with YUMM1.7 (n=6) or Kdm5b−/− YUMM1.7 (n=5) cells compared with age matched Naïve B6 mice injected with YUMM1.7 (n=5) or Kdm5b−/− YUMM1.7 (n=5) cells. Data represent one experiment. Data are mean ± SEM. 2-way ANOVA analysis for comparison of tumor size at day 25. n.s., not significant; ****p<0.0001. o, Survival curves of C57BL/6J (B6) mice that rejected Kdm5b−/− YUMMER1.7 tumors (Challenged B6) rechallenged with Kdm5b−/− YUMM1.7 cells and treated with anti-CD8 antibody (n=4) or IgG control (n=4). Data represent one experiment. Statistical significance of tumor survival was analyzed with log-rank (Mantel-Cox) test. **p=0.0067. p, Tumor growth curves of C57BL/6 mice injected with wild-type YUMM1.7 cells treated with IgG control (n=10) or anti-PD-1 antibody (n=10); or Kdm5b−/− YUMM1.7 cells treated with IgG control (n=9) or anti-PD-1 antibody (n=10). Data are representative of two independent experiments. Data are mean ± SEM. 2-way ANOVA analysis for comparison at day 18. n.s., not significant; ****p<0.0001. q, Spider plots of tumor growth data shown in p.
Extended Data Figure 2.
Extended Data Figure 2.. Depletion of KDM5B in mouse melanoma cells activates the type I interferon response through both RNA and DNA sensing pathways.
a, GSEA comparing RNA-seq data from Kdm5b−/− (Kdm5b sg) YUMMER1.7 cells with control YUMMER1.7 cells. Shown are selected top upregulated pathways (FDR<=0.05). b, Western blot analyses of DNA and RNA sensors, as well as signaling proteins involved in the type I IFN pathway. T-, total; p-, phosphorylated. For gel source data, see Supplementary Fig. 1. c, RT-qPCR analyses of ISGs in Ifngr1−/− YUMMER1.7 mouse melanoma cells with Ctl sg, Kdm5b sg1 and Kdm5b sg2. d, RT-qPCR analyses of ISGs (left) and western blot analyses (right) of YUMM1.7 mouse melanoma cells with Ctl sg and Kdm5b sg. For gel source data, see Supplementary Fig. 1. e, RT-qPCR analyses of ISGs in 1445 mouse melanoma cells with Ctl shRNA and Kdm5b shRNA. f, Western blot analyses of the indicated cell lines used in Figure 2b and Exteneded Data Figure 2g. For gel source data, see Supplementary Fig. 1. g, RT-qPCR analyses of selected ISGs in the indicated YUMMER1.7 cells treated with 10 ng/ml IFNγ for 24h. Data are mean ± SD. h, Western blot analyses of the indicated cell lines, used in Figure 2c. For gel source data, see Supplementary Fig. 1. i, RT-qPCR analyses (left) and western blot analyses (right) of YUMM1.7-Kdm5b sg cells with Ctl sg, Sting1 sg, Ddx58 (RIG-I gene) sg, Mda5 sg, Mavs sg, or cGas sg. For gel source data, see Supplementary Fig. 1. j, RT-qPCR analyses of IRF9 in1445-Kdm5b sg cells with Ctl sg, Sting1 sg, Ddx58 sg, Mda5 sg, Mavs sg, or cGas sg. k, RT-qPCR analyses of ISGs from YUMM1.7-Kdm5b sg cells treated with Ctl siRNA, Sting1 siRNA or Mavs siRNA for 3 days. l, RT-qPCR analyses of ISGs from 1445 cells with Ctl shRNA treated with Ctl siRNA, 1445 cells with Kdm5b shRNA treated with Ctl siRNA, Sting1 siRNA, or Mavs siRNA cells for 3 days. Data are means ± SEM. m, Tumor growth curve (left) and survival curve (right) of C57BL/6 mice injected with YUMMER1.7 cells of the indicated genotypes, WT (n=5), Kdm5b−/−-Mda5−/− cGas−/−-C1 (n=4), Kdm5b−/−-Mda5−/− cGas−/−-C3 (n=4), Kdm5b−/− (n=5). C1 and C3 are clone numbers. Data represent one experiment. Data are mean ± SEM. 2-way ANOVA analysis for comparison at day 20. n.s., not significant; ****p<0.0001. Log-rank test for survival curves. **p=0.004 for C1 vs Kdm5b−/−; **p=0.005 for C3 vs Kdm5b−/−; *p=0.023 for C3 vs WT. Unpaired two-sided Students’ t tests were performed for all RT-qPCR data (c-e,g, i-l). n.s., not significant; *p<0.05; **p<0.01; ***p<0.001; ****p<0.0001.
Extended Data Figure 3.
Extended Data Figure 3.. Deletion of KDM5B in mouse melanoma cells increases MHC-I expression, and induces expression of genes involved in antigen processing/presentation and endogenous retroelements.
a-c, Flow cytometry analysis for MHC-I levels (left) and RT-qPCR analyses of MHC-I genes and genes involved in antigen processing and presentation (right) in YUMMER1.7 cells with Ctl sg, Kdm5b sg1 or sg2 (a), YUMM1.7 cells with Ctl sg, Kdm5b sg1 or sg2 (b), and YUMM3.3 cells with Ctl shRNA or Kdm5b shRNA (c). Data are mean ± SEM. d,e, RT-qPCR analyses of ERVs in YUMM1.7 cells (d) and 1445 cells (e) with Ctl shRNA or Kdm5b shRNA. Data are mean ± SEM. Statistical analysis was done with unpaired two-sided Student’s t test. *p<0.05, **p<0.01, *** p<0.001 and ****p<0.0001.
Extended Data Figure 4.
Extended Data Figure 4.. Deletion of KDM5B induces endogenous retroelement expression and forms dsRNA.
a,b, Immunofluorescence staining of dsRNA with J2 antibody (red) and DAPI (blue) in WT or Kdm5b−/− YUMMER1.7 cells, using a confocal microscope (a) (scale bar=50 μm) and 1445 cells with Ctl shRNA or Kdm5b shRNA (b) (scale bar=50 μm). c, Immunofluorescence staining of dsRNA with J2 antibody (red) and DAPI (blue) of WT or Kdm5b sg YUMMER1.7 tumors harvested 14 days after tumor injection (scale bar=100 μm). d. Immunofluorescence staining (left) and quantification (right) of dsRNA with J2 antibody (red) and DAPI (blue) of representative patients as responder or non-responder to ICB (scale bar=100 μm). MGLI= mean grey level intensity. e, Volcano plots comparing inverted repeats in YUMMER1.7 cells with Kdm5b sg vs YUMMER1.7 cells with Ctl sg. f, Western blot analyses of Kdm5b sg YUMMER1.7 cells treated with 20 μM of reverse transcriptase inhibitors (RTi) for 48h. For gel source data, see Supplementary Fig. 1. g, qPCR analyses of retroelements from DNA isolated from cytosolic (cyto) lysate versus from nuclear lysate. Data are mean ± SD. h, Relative copy number of mitochondrial (mito) DNA quantified by qPCR analyses with Dloop primers. Data are mean ± SD. i, RT-qPCR analyses of MMVL30, RLTR6 and ISG15 in Kdm5b−/− cells with the indicated doxycycline (Dox) inducible shRNAs. Data are mean ± SEM. p values for g-i were calculated using unpaired two-sided Students’ t tests. n.s., not significant; **p<0.01; ***p<0.001; ****p<0.0001.
Extended Data Figure 5.
Extended Data Figure 5.. KDM5B represses retroelement expression in a demethylase-independent manner.
a,b, ChIP-qPCR analyses of WT and Kdm5b−/− (KO) YUMMER1.7 cells. Data are mean± SEM. c,d, Western blot (c) and RT-qPCR analyses of ERVs and ISGs (d) in YUMMER1.7 treated with 1 μM, 3 μM and 5 μM of KDM5i (CPI-48 and KDM5-C70) for 7 days. For gel source data, see Supplementary Fig. 1. e, RT-qPCR analyses of ERVs and ISGs (left) and western blot analyses (right) of YUMMER1.7 cells treated with DMSO or EZH2 inhibitors (5 μM EPZ6438, 5 μM GSK343) for 10 days. For gel source data, see Supplementary Fig. 1. f, RT-qPCR analyses (left) and western blot analyses (right) of YUMMER1.7 cells treated with DMSO or chaetocin (10, 20, and 30 nM), an inhibitor of H3K9me3 methyltransferase SETDB1, for 3 days. g,h, ChIP-qPCR analyses of WT and Kdm5b−/− (KO) YUMMER1.7 cells. i,j, RT-qPCR analyses (i) and western blot analyses (j) of YUMMER1.7 cells with Ctl sg, G9a sg (1–3) or Suv39h1 sg (1–3). For gel source data, see Supplementary Fig. 1. k, RT-qPCR analyses of MMVL30 in YUMMER1.7 cells with Ctl sg, G9a sg (1–3), Suv39h1 sg (1–3), and Setdb1 sg (1–3). l, Western blot analyses of YUMMER1.7 cells with Ctl sg or Setdb1 sg (1–3). For gel source data, see Supplementary Fig. 1. m, ChIP-qPCR analyses of WT YUMMER1.7 cells with GFP, Kdm5b−/− YUMMER1.7 cells, with GFP control, or reconstituted expression of WT-KDM5B or catalytically inactive mutant (MT) KDM5B. For a,b, d-h, i,k,m, data are means ± SEM. Statistical analysis was done with unpaired two-sided Student’s t test. n.s. not significant, *p<0.05, **p<0.01, *** p<0.001 and ****p<0.0001.
Extended Data Figure 6.
Extended Data Figure 6.. KDM5B directly binds to the retroelements induced by Kdm5b loss.
a, Genomic annotations of Kdm5b binding peaks from KDM5B ChIP-seq in YUMMER1.7 cells. b, Heatmaps of input-subtracted KDM5B, SETDB1 and H3K9me3 ChIP-seq signal averaged across all loci per retroelement in YUMMER1.7 cells, sorted by KDM5B binding intensity. Top 10 significantly increased retroelements plus “MMERVK10C-int, RLTR6-int, and RLTR6B_Mm“ are labeled. c, Violin plots of RNA-seq analysis showing differential expressed endogenous retroelements categorized in classes (three classes of ERVs, LINEs and SINEs) in 1445 mouse melanoma cells with Kdm5b sg vs. Ctl sg. d, Input-subtracted KDM5B ChIP-seq signal averaged across all loci per retroelement in 1445 cells. KDM5B signal on ERVs were sorted by intensity. Top 10 significantly increased retroelements are labeled. e, Venn diagram showing overlapping ChIP-seq binding regions shared between KDM5B and SETDB1. KDM5B only peaks, n=25,315; Shared peaks, n=66,503; SETDB1 only peaks, n=16,934. f, Box plot showing RNA-seq log2 Fold Change (FC) of (Kdm5b−/− vs WT) for four different categories of transposable elements located within overlapping regions between KDM5B and SETDB1. g, Venn diagram showing overlapping ChIP-seq binding regions shared among KDM5B, SETDB1 and H3K9me3. h,i, Western blot analyses of KDM5B (h) or SETDB1 (i) immunoprecipitates from nuclear extracts of 1445 mouse melanoma cells, MC38 mouse colon cancer cells or YUMM1.7 mouse melanoma cells. For gel source data, see Supplementary Fig. 1.
Extended Data Figure 7.
Extended Data Figure 7.. ChIP-seq and ATAC-seq analyses of epigenomic changes induced by Kdm5b loss.
a. Aggregated RNA-seq, KDM5B, SETDB1, H3K9me3, H3K4me3 and H3K4me2 ChIP-seq signals of MMVL30-int loci in WT and Kdm5b−/− (KO) YUMMER1.7 cells. b-c. IGV (Integrative Genomic Viewer) screenshots of KDM5B, SETDB1, H3K9me3, H3K4me3, and H3K4me2 ChIP-seq signals from WT and Kdm5b−/− YUMMER1.7 cells. d. Volcano plot showing ATAC-seq signals from WT and Kdm5b−/− YUMMER1.7 cells; Peaks enriched significantly in Kdm5b−/− cells are in red and enriched significantly in WT cells are in blue (FDR < 0.05). Significant changed MMVL30-int loci are marked in black. e. Box plot showing ATAC-seq log2 Fold Change of (Kdm5b−/− vs WT YUMMER1.7) for four different categories of transposable elements. f. Pie charts showing proportion of increased or unchanged ATAC peaks within KDM5B domains in Kdm5b−/− vs WT YUMMER1.7 cells. g. Comparison of ATAC-seq signals among baseline or IFNγ treated Kdm5b−/− (KO) and WT YUMMER1.7 cells. h-l, Motif sequences (left) and top 5 best matched transcription factor (TF) with corresponding p value (right) from de novo motif analysis of KDM5B binding regions (h), increased ATAC seq peaks in Kdm5b−/− (KO) compared to WT YUMMER1.7 cells (i), increased ATAC seq peaks in IFNγ treated Kdm5b−/− compared to WT YUMMER1.7 cells (j), retroelements within KDM5B binding regions, with increased ATAC seq peaks in Kdm5b−/− cells compared to WT YUMMER1.7 cells (k), and retroelements within KDM5B binding regions, with increased ATAC seq peaks in IFNγ treated Kdm5b−/− (KO) YUMMER1.7 compared to IFNγ treated WT YUMMER1.7 cells (l).
Extended Data Figure 8.
Extended Data Figure 8.. KDM5B regulates SETDB1 protein stability and is required for the recruitment of SETDB1 to retroelements, some of which encode potential antigens.
a, Western blot analyses of SETDB1 in cytosolic and nuclear extracts from Kdm5b−/− YUMMER1.7 cells treated with DMSO, 5 μM or 10 μM proteasome inhibitor MG132 for 21 h. For gel source data, see Supplementary Fig. 1. b, Western blot analyses of YUMMER1.7 cells with GFP, Kdm5b−/− YUMMER.17 cells with GFP, WT SETDB1, or MT SETDB1. For gel source data, see Supplementary Fig. 1. c, RT-qPCR analyses of ERVs and ISGs in Kdm5b−/− YUMMER1.7 cells with GFP, WT SETDB1, or MT SETDB1, in the absence or presence of 100 nM IFNγ for 24 h. d, H3K9me3 ChIP-qPCR analyses of Kdm5b−/− YUMMER1.7 cells with GFP, SETDB1, WT KDM5B or MT KDM5B. c-d, Data are means ± SEM. Statistical analysis was done with unpaired two-sided Student’s t test. P values for c are from comparison to the GFP control with the same IFNγ treatment status. n.s. not significant; *p<0.05; **p<0.01; ***p<0.001 and ****p<0.0001. e,f, Kaplan–Meier survival curves (e) and spider plots of tumor growth (f) of C57BL/6 mice injected with Kdm5b−/− YUMMER1.7 cells with GFP (n=6) or SETDB1 (n=6). P values were determined using the log-rank test, n.s. not significant. g, Flow cytometry analysis for MuLV envelope protein (Env) in YUMMER1.7 cells with Ctl sg or Kdm5b sg. h, Quantification of flow cytometry analysis for P15E+CD8+ T cells in YUMMER1.7 tumors with Ctl sg (n=3) or Kdm5b sg (n=7). Data are means ± SEM. Statistical analysis was done with unpaired two-sided Student’s t test. n.s. not significant. i, Quantification showing the percentage of retroelement encoded peptides that were exchanged onto H2-Kb in vitro.
Extended Data Figure 9.
Extended Data Figure 9.. Knockdown of KDM5B in human melanoma cells induces ISGs and ERVs through RIG-I and MAVS.
a,b, RT-qPCR analyses of ERVs and ISGs in YURIF (a) or YUDOSO (b) with Ctl or KDM5B shRNA. c, RT-qPCR analyses of ISGs (left) and western blot analyses of DNA and RNA sensors and the type I IFN pathway (right) in YUDOSO human melanoma cells with KDM5B shRNA and Ctl sg, TLR3 sg, RIG-I (DDX58) sg, MDA5 sg, CGAS sg, MAVS sg, or STING1 sg. For gel source data, see Supplementary Fig. 1. Data are means ± SEM. Statistical analysis was done with unpaired two-sided Student’s t test. **p<0.01, ***p<0.001 and ****p<0.0001.
Extended Data Figure 10.
Extended Data Figure 10.. Correlation analysis of human ERVs with KDM5B expression and selected epigenetic regulators with patient response to anti-PD-1 treatment, and the working model summarizing the mechanistic findings.
a, Heatmap showing highly differential expressed human ERVs in patient biopsies prior to anti-PD-1 treatment. Samples were ranked by KDM5B expression, with patient responses to anti-PD-1 treatment annotated (PD, progressive disease; PR, partial response; CR, complete response). b, ERVmap_2637 expression is inversely correlated with KDM5B expression in patient cohort described in panel a. Gray zone represents 95% confidence interval for the linear model prediction. c-k, Box plot showing expression of ERVmap_2637 (c), KDM5A (d), KDM5C (e), KDM5D (f), EZH2 (g), KDM1A (h), DNMT1 (i), DNMT3B (j) and SETDB1 (k) in patient cohort described in panel a. Statistical analysis was done with unpaired two-sided Student’s t test. l, The working model showing that KDM5B suppresses anti-tumor responses by recruiting SETDB1 to inhibit endogenous retroelements and type I interferon response. This panel is created with BioRender.com.
Fig. 1
Fig. 1. Depletion of KDM5B induces anti-tumor immunity in an adaptive immune system dependent manner.
a, Gene Ontology (GO) pathways negatively correlated with KDM5B. b, Box plot showing KDM5B mRNA levels in tumors from patients with complete response (CR, n=4), partial response (PR, n=10), or progressive disease (PD, n=13). p value by unpaired two-sided Student’s t test. c, Tumor growth curves of C57BL/6 mice subcutaneously injected with 500,000 control (Ctl) (n=6) or Kdm5b−/− (Kdm5b sg) (n=6) YUMMER1.7 cells. Mice injected with Kdm5b−/− cells were re-challenged with control cells on day 45. Data are representative of two independent experiments. Data are mean ± SEM. ****p<0.0001. d, Survival curves of wild-type (WT) C57BL/6J (B6) mice injected with control (n=4) or Kdm5b sgRNA (n=4) or Rag1−/− mice injected with control (n=5) or Kdm5b sgRNA YUMMER1.7 cells (n=4). *p=0.0184 for Ctl-Rag1−/− vs Ctl-B6; *p=0.0376 for Ctl-Rag1−/− vs Kdm5b sg-Rag1−/−; **p=0.0067 for Ctl-B6 vs Kdm5b sg-B6; **p=0.0062 for Kdm5b sg-B6 vs Kdm5b sg-Rag1−/−. Data represent one experiment. e, Survival curves of C57BL/6J (B6) mice that rejected Kdm5b−/− YUMMER1.7 tumors (Challenged B6) rechallenged with WT (n=6) or Kdm5b−/− YUMM1.7 cells (n=5) compared with age matched Naïve B6 mice rechallenged with YUMM1.7 (n=5) or Kdm5b−/− YUMM1.7 cells (n=5). Data represent one experiment. n.s., not significant; **p= 0.0023 for WT-Naïve B6 vs Kdm5b−/−-Naïve B6; **p=0.0014 for WT-Challenged B6 vs Kdm5b−/−-Challenged B6; **p=0.0086 for Kdm5b−/− -Naïve B6 vs Kdm5b−/−-Challenged B6. f, Survival curves of C57BL/6 mice injected with WT YUMM1.7 cells treated with IgG control (n=10) or anti-PD-1 antibody (n=10); or Kdm5b−/− YUMM1.7 cells treated with IgG control (n=9) or anti-PD-1 antibody (n=10). Data are representative of two independent experiments. **p=0.0021 for WT-IgG vs Kdm5b−/−-IgG; ****p<0.0001 for WT-α-PD-1 vs Kdm5b−/−-α-PD-1; n.s. for WT-IgG vs WT-α-PD-1; ***p=0.0007 for Kdm5b−/−-IgG vs Kdm5b−/− -α-PD-1.
Fig. 2
Fig. 2. Deletion of KDM5B activates the type I interferon response through both cytosolic RNA and DNA sensing pathways.
a, GSEA plots of two top pathways induced by KDM5B deletion in YUMMER1.7 cells. FDR, false discovery rate. b, RT-qPCR analyses of selected ISGs in the indicated YUMMER1.7 cells. Data are mean ± SD. c, Tumor growth curves of C57BL/6 mice injected with YUMMER1.7 cells of the indicated genotypes. Left: wild-type (WT, n=4), Kdm5b−/−-Mda5−/− (n=6), Kdm5b−/−-cGas−/− (n=5), Kdm5b−/− (n=5); Right: WT (n=5), Kdm5b−/−-Sting1−/−-Mavs−/− (n=5), Kdm5b−/−-Mavs−/− (n=4), Kdm5b−/−-Sting1−/− (n=4), Kdm5b−/− (n=5). Data are representative of two independent experiments. Data are mean ± SEM. n.s., not significant; *p<0.05; **p<0.01; ***p<0.001; ****p<0.0001.
Fig. 3.
Fig. 3.. Deletion of KDM5B de-represses endogenous retroelements, which can be reverse transcribed into cDNAs.
a, Volcano plot showing retroelement loci with increased expression (red) and decreased expression (blue) (FDR< 0.05) in Kdm5b−/− (Kdm5b sg) vs control YUMMER1.7, combining both forward and reverse strands. Top 10 significantly differential loci are labeled, with MMVL30-int loci highlighted in red. b, Violin plots showing differential expressed retroelement classes comparing Kdm5b−/− (Kdm5b sg) to control YUMMER1.7 cells (FDR<0.05). c,d, RT-qPCR analyses of Kdm5b−/− YUMMER1.7 cells treated with 20 μM of reverse transcriptase inhibitors (RTi) for 48h (c) or Kdm5b−/− cells treated with control or MMVL30 targeting siRNA for 3 days (d). Data are mean ± SD. n.s., not significant; **p<0.01; ***p<0.001; ****p<0.0001.
Fig. 4.
Fig. 4.. KDM5B suppresses the expression of retroelements by recruiting H3K9 methyltransferase SETDB1.
a, RT–qPCR analyses of Kdm5b−/− (KO) YUMMER1.7 cells, with GFP control, or reconstituted expression of wild-type (WT)-KDM5B or catalytically inactive mutant (MT) KDM5B. Data are mean ± SEM. **p<0.01; ***p<0.001, ****p<0.0001. b, Tumor growth curves of C57BL/6 mice injected with KO+GFP (n=4), KO+WT KDM5B (n=5), KO+MT-KDM5B (n=6). Data are representative of two independent experiments. Data are mean± SEM. n.s. not significant; ****p<0.0001. c, Heatmap of KDM5B, SETDB1, H3K9me3, H3K4me3 and H3K4me2 ChIP-seq signal within KDM5B peaks in WT and Kdm5b−/− YUMMER1.7 cells. Peaks were sorted according to KDM5B signal in WT cells. d,e, Correlation between ChIP-seq signals of KDM5B and SETDB1 (d) or H3K9me3 (e) in YUMMER1.7 cells. Two-sided Pearson’s correlation test. f, Box plot showing log2 Fold Change (FC) of RNA-seq signals in Kdm5b−/− vs WT for four different categories of transposable elements located within regions with KDM5B, SETDB1 and H3K9me3 binding. g, Western blot analyses of SETDB1 immunoprecipitates with nuclear extracts from WT, Kdm5b sg and Setdb1 sg YUMMER1.7 cells. For gel source data, see Supplementary Fig. 1. h, Volcano plot showing ATAC-seq signals from WT and Kdm5b−/− YUMMER1.7 cells, treated with 200 ng/ml IFNγ for 36h; Shown are increased (red) and decreased (blue) peaks in Kdm5b−/− cells (FDR < 0.05). Significantly changed peaks overlapping MMVL30-int loci are marked in black. i, Box plot showing log2 Fold Change of ATAC-seq signals in (Kdm5b−/− treated with IFNγ vs WT treated with IFNγ) for four different categories of transposable elements.

Comment in

References

    1. Chen DS & Mellman I Elements of cancer immunity and the cancer-immune set point. Nature 541, 321–330 (2017). - PubMed
    1. Cao J & Yan Q Cancer Epigenetics, Tumor Immunity, and Immunotherapy. Trends Cancer 6, 580–592 (2020). - PMC - PubMed
    1. Topalian SL, Drake CG & Pardoll DM Immune checkpoint blockade: a common denominator approach to cancer therapy. Cancer Cell 27, 450–461 (2015). - PMC - PubMed
    1. Topalian SL et al. Safety, activity, and immune correlates of anti-PD-1 antibody in cancer. N Engl J Med 366, 2443–2454 (2012). - PMC - PubMed
    1. Hugo W et al. Genomic and Transcriptomic Features of Response to Anti-PD-1 Therapy in Metastatic Melanoma. Cell 165, 35–44 (2016). - PMC - PubMed

Publication types