. 2021 Nov;599(7883):125-130.
doi: 10.1038/s41586-021-04006-z. Epub 2021 Oct 20.

Regulation of intestinal immunity and tissue repair by enteric glia

Affiliations

Regulation of intestinal immunity and tissue repair by enteric glia

Fränze Progatzky et al. Nature. 2021 Nov.

Abstract

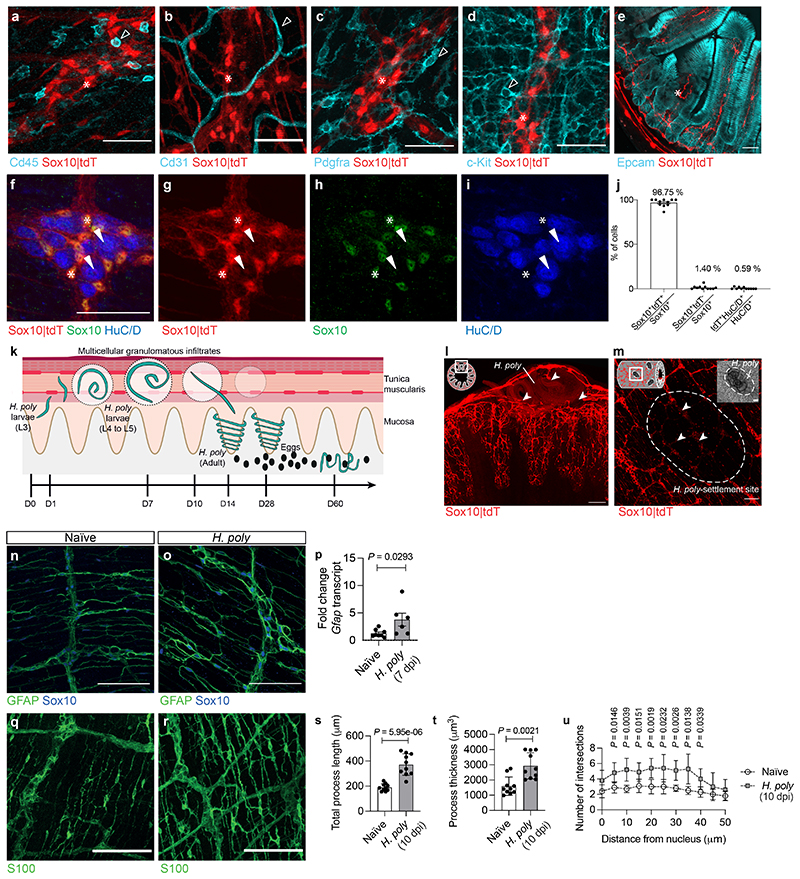
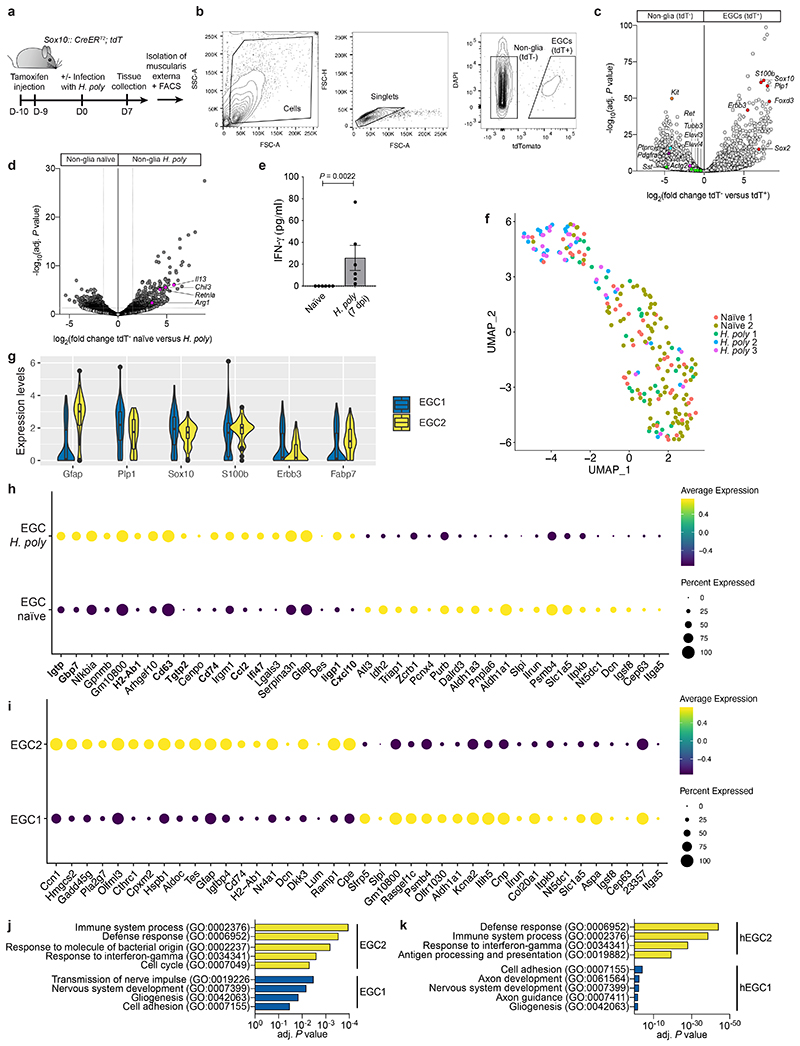
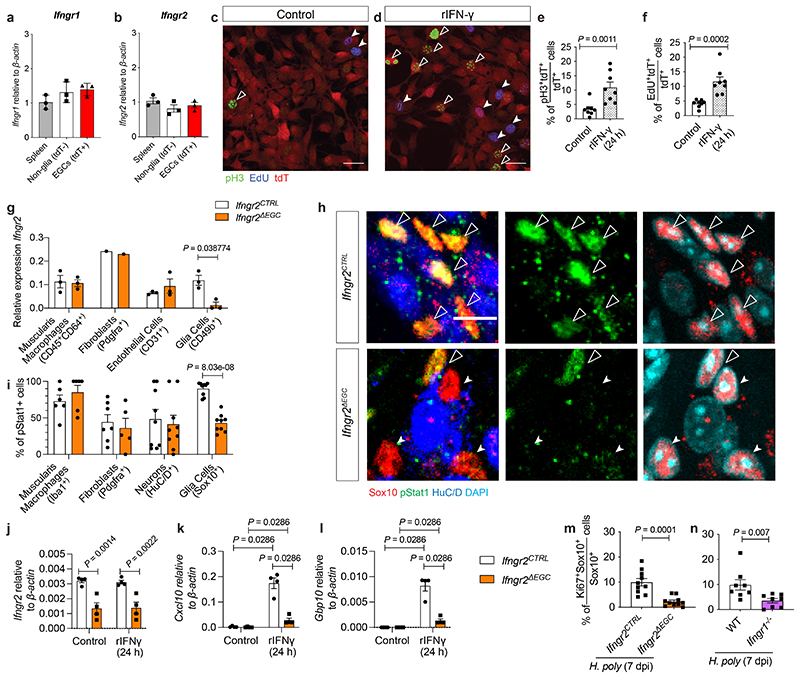
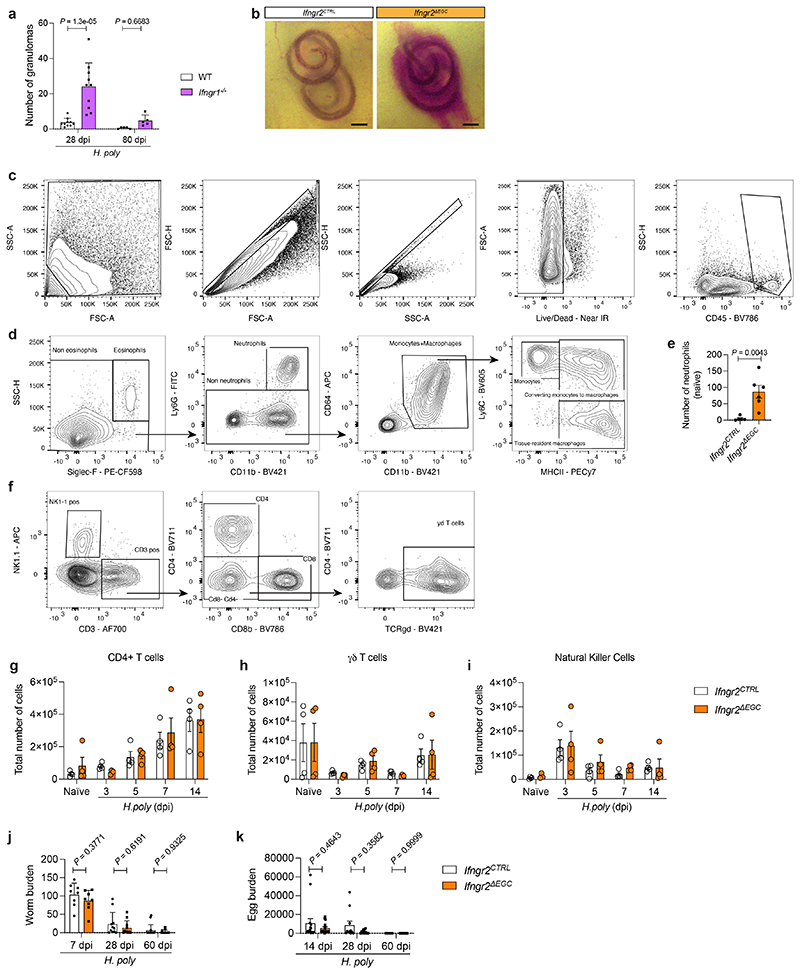
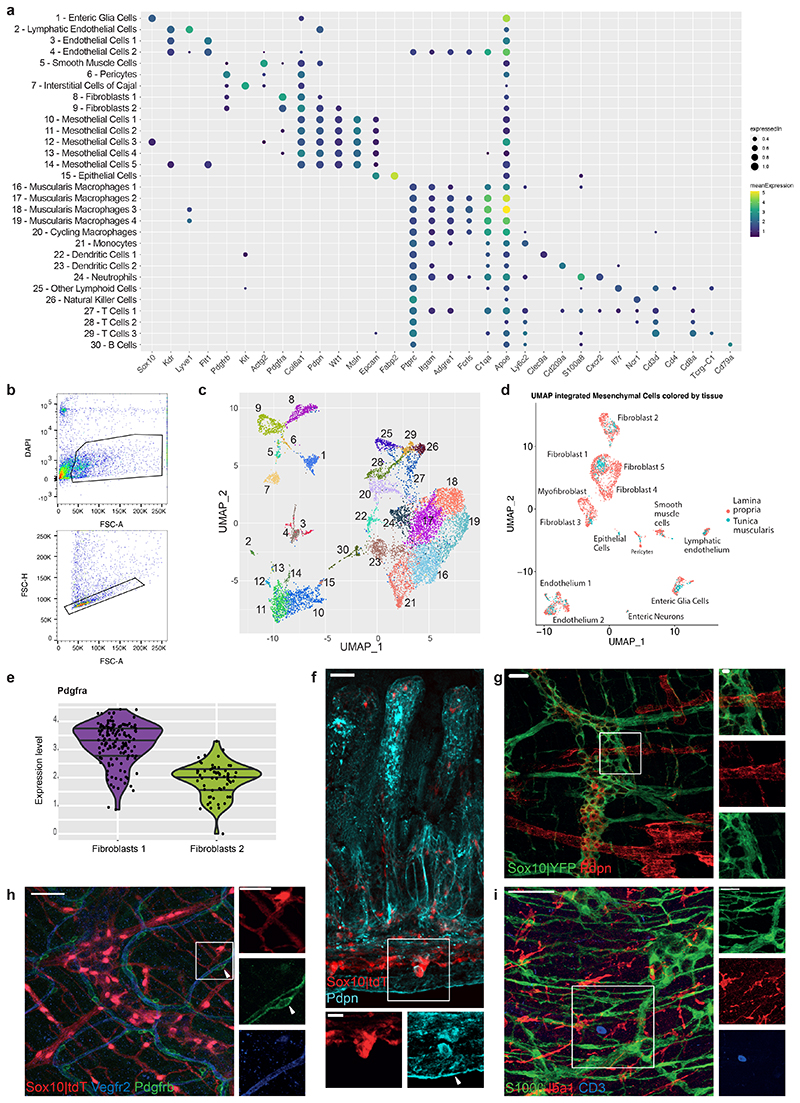
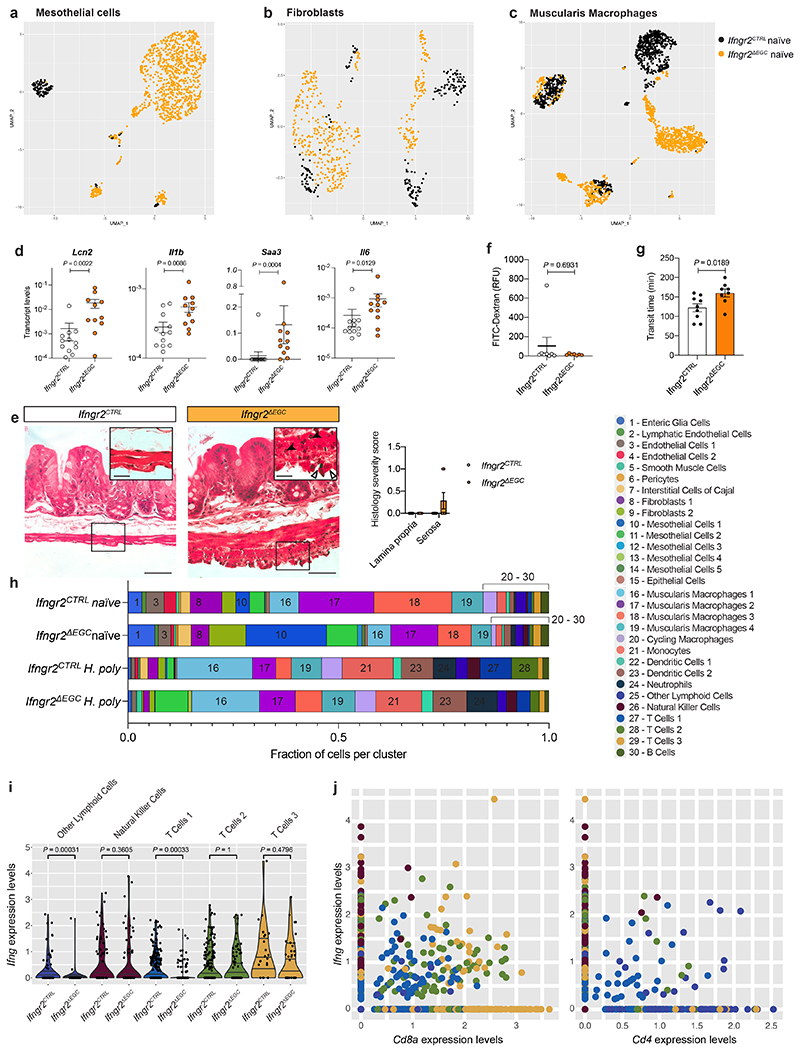
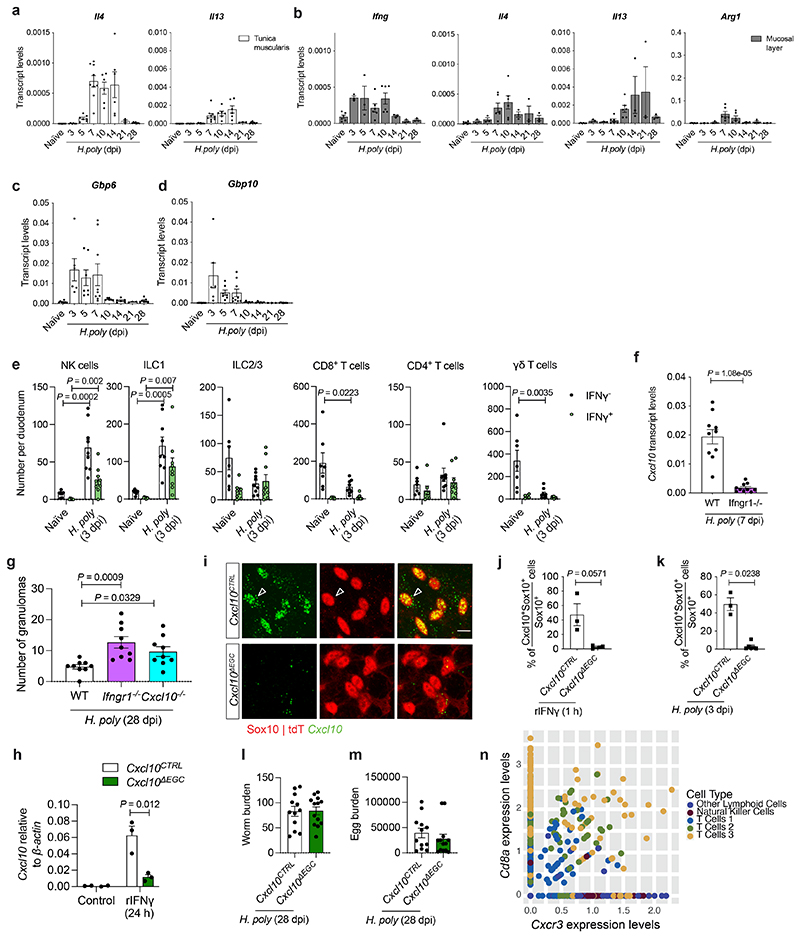
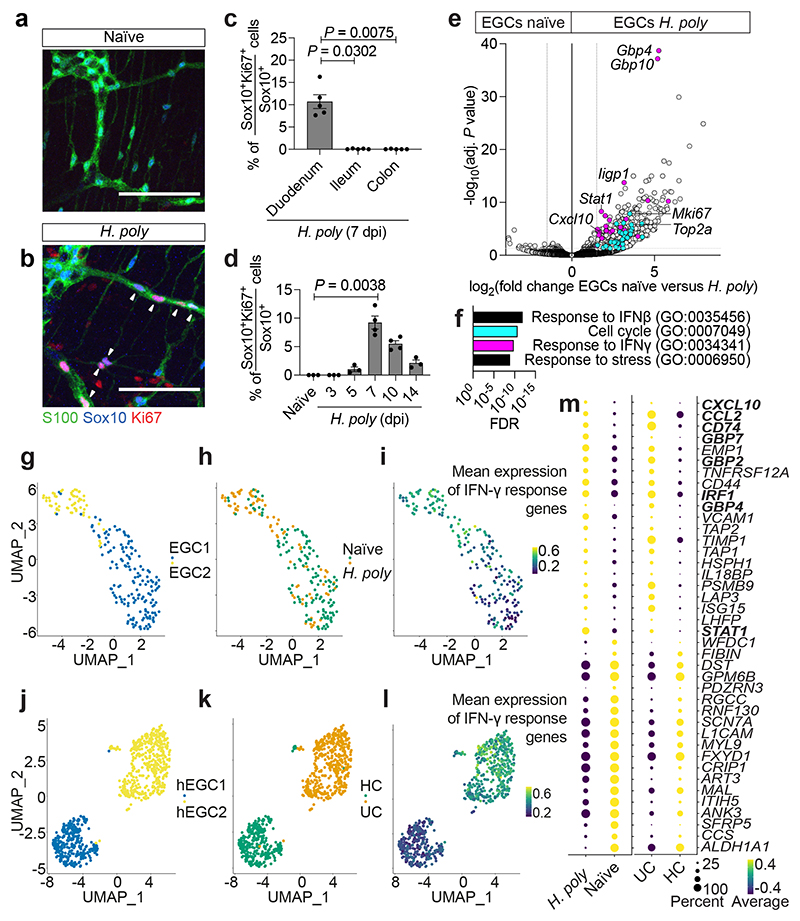
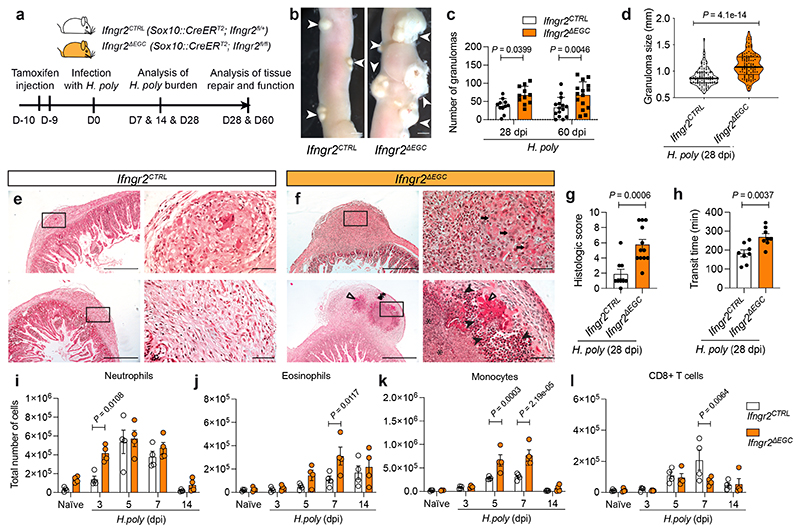
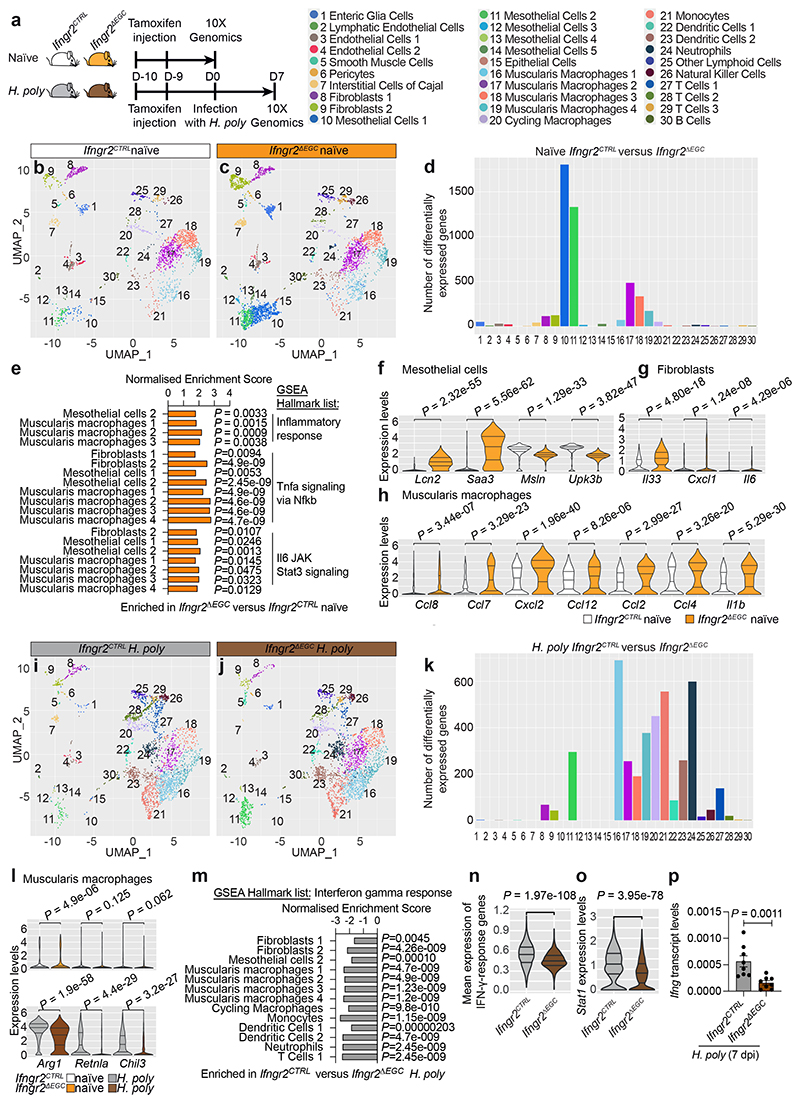
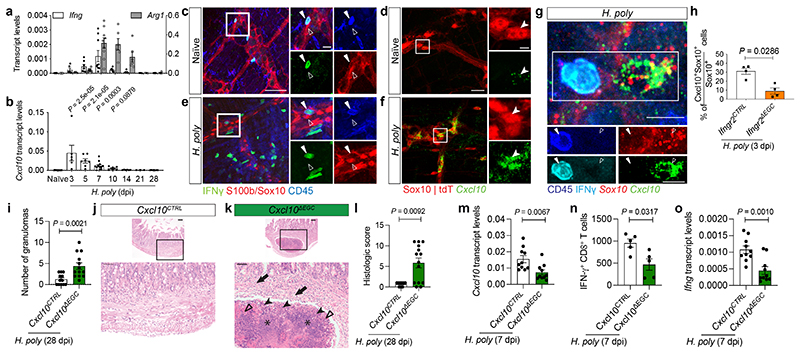
Tissue maintenance and repair depend on the integrated activity of multiple cell types1. Whereas the contributions of epithelial2,3, immune4,5 and stromal cells6,7 in intestinal tissue integrity are well understood, the role of intrinsic neuroglia networks remains largely unknown. Here we uncover important roles of enteric glial cells (EGCs) in intestinal homeostasis, immunity and tissue repair. We demonstrate that infection of mice with Heligmosomoides polygyrus leads to enteric gliosis and the upregulation of an interferon gamma (IFNγ) gene signature. IFNγ-dependent gene modules were also induced in EGCs from patients with inflammatory bowel disease8. Single-cell transcriptomics analysis of the tunica muscularis showed that glia-specific abrogation of IFNγ signalling leads to tissue-wide activation of pro-inflammatory transcriptional programs. Furthermore, disruption of the IFNγ-EGC signalling axis enhanced the inflammatory and granulomatous response of the tunica muscularis to helminths. Mechanistically, we show that the upregulation of Cxcl10 is an early immediate response of EGCs to IFNγ signalling and provide evidence that this chemokine and the downstream amplification of IFNγ signalling in the tunica muscularis are required for a measured inflammatory response to helminths and resolution of the granulomatous pathology. Our study demonstrates that IFNγ signalling in enteric glia is central to intestinal homeostasis and reveals critical roles of the IFNγ-EGC-CXCL10 axis in immune response and tissue repair after infectious challenge.


Conflict of interest statement

The authors declare no competing financial interest.

Figures

Extended Data Figure 1
Extended Data Figure 1. Intestinal helminth infection induces ENS injury and gliosis.
(a-i) TM preparations (a-d, f-i) and cross-section (e) from the duodenum of Sox10|tdT mice immunostained for CD45 (a), CD31 (b), Pdgfra (c), c-Kit (d), Epcam (e), Sox10 (f, h) and HuC/D (f, i). Indicated are cells negative for tdT (empty arrowheads), tdT+ EGCs (asterisks) and neurons (arrowheads). g, h and i show single spectrum images of f. n=3. (j) Quantification of tdT+ cells expressing Sox10 (EGCs) and HuC/D (neurons) (n=11 field of views, representative of 3 experiments). (k) Schematic of intestinal cross-section illustrating the organisation of the EGC-network and the life-cycleof H. poly. L3 H. poly larvae penetrate the duodenum mucosa and settle in the TM, eliciting local tissue damage, inflammation and formation of granulomatous infiltrates. 10 days later they emerge as adult worms into the lumen where they mate and produce eggs. (l, m) Cross-section (l) and whole-mount view (m) of the duodenum of H. poly-infected Sox10|tdT mice (7 dpi). Schematics (top left) show the orientation of the images. Arrowheads point to H. poly settlement sites. n=4. (n, o, q, r) TM preparations from the duodenum of naïve and H. poly-infected (7 dpi n, o; 10 dpi q, r) animals immunostained for GFAP and Sox10 (n, o) and S100 (q, r).n=5. (p) Quantification (qRT-PCR) of Gfap transcripts in the TM of naïve and H. poly-infected mice (7 dpi). (nNaïve=8, n H.poly =6). 2 experiments. (s-u) Quantification of S100+ type III EGC morphology including total process length (s) (n=10), process thickness (t) (n=10) and Scholl analysis for EGC process branching (u) (n=5). 2 experiments. Two-tailed Mann-Whitney test (p, t), unpairedtwo-tailed t-test (s), Two-way ANOVA with multiple comparisons (u). Mean±SEM. Scale bars: a-i: 50 μm; l, m, n, o, q, r:100 μm, insets: 12.5 μm
Extended Data Figure 2
Extended Data Figure 2. Transcriptomic analysis of H. poly-infected TM.
(a) Experimental design for bulk RNAseq of EGCs from the TM of naïve and H. poly-infected (7 dpi) Sox10|tdT mice. tdT+ and tdT- cell populations of dissociated TM were separated using FACS and subjected to RNAseq. (b) Sorting strategy for tdT+ EGCs and tdT- non-glia cells. (c, d) Volcano plot showing mean log2-transformed fold change (x-axis) and significance (-log10(adjusted Pvalue)) of differentially expressed genes between tdT- and tdT+ cells from naïve mice (c) and in tdT- cells from naïve and H. poly-infected animals (d). Coloured dots in (c) indicate genes specific to EGCs (Sox10, Plp1, S100b, Foxd3, Erbb3, Sox2; red), enteric neurons (Ret, Tubb3, Sst, Elavl3, Elavl4; green), immune cells (Ptprc; cyan), interstitial cells of Cajal (Kit; orange), smooth muscle cells (Acgt2; pink), fibroblasts (Pdgfra; purple) and in (d) genes specific to type II immune response (Arg1, Retnla, Chil3) and TH2 cytokines (Il13).n=4. (e) Quantification of IFN-γ in the TM of naïve and H. poly-infected animals (7 dpi). Mean±SD; n=6. Two-tailed Mann-Whitney test. (f) UMAP of sequenced EGCs from the TM of naïve and H. poly infected mice. Cells are color-coded according to experimental batches. (g) Violin plots showing normalized expression of representative EGC marker genes in EGC1 and EGC2 clusters in Fig. 1g. (h, i) Top 20 up-regulated and top 20 down-regulated genes in EGCs from H. poly-infected mice (h) and in EGC2 relative to EGC1 (i). IFN-γ-target genes shown in bold (h). Dot size indicates proportion of expressing cells and fill colour indicates mean normalized, centred and scaled expression level. (j, k) GO terms significantly enriched among the differentially expressed genes in EGC1 and EGC2 clusters shown in Fig. 1g (j) and in hEGC1 and hEGC2 clusters shown in Fig. 1j (k).
Extended Data Figure 3
Extended Data Figure 3. Cell autonomous activation of EGCs by IFN-γ.
(a, b) qRT-PCR analysis of Ifngr1 (a) and Ifngr2 (b) transcript levels from spleen cells and FACS-isolated EGCs (tdT+) and non-glia cells (tdT-) from Sox10|tdT mice. n=3. (c, d) Cultures of FACS-isolated EGCs from Sox10|tdT mice in the absence (c) or presence (d) of IFN-γ immunostained for pH3 (green) and labelled with EdU (blue). Scale bars: 100 μm. (e, f) Quantification of pH3+ (e) and EdU+ (f) EGCs (tdT+ cells) in the cultures shown in c and d, respectively. n=8 field of views from each of 3 experiments. (g) qRT-PCR analysis of Ifngr2 transcript levels in muscularis macrophages, fibroblasts, endothelial cells and EGCs FACS-isolated from the TM of Ifngr2CTRL and Ifngr2ΔEGC mice. n=3. (h) Images of IFN-γ-treated (1 hour) myenteric plexus preparations from the duodenum of Ifngr2CTRL and Ifngr2ΔEGC mice immunostained for pStat1, Sox10 and HuC/D and counterstained for DAPI. Indicated are pStat1+ EGCs (empty arrowheads), pStat1- EGCs (filled arrowheads). Scale bar = 10 μm. (i) Quantification of pStat1+ muscularis macrophages, fibroblasts, neurons and EGCs in IFN-γ-treated (1 hour) TM preparations from Ifngr2CTRL and Ifngr2ΔEGC mice. n=8. (j-l) qRT-PCR analysis of Ifngr2, Cxcl10 and Gbp10 transcript levels from rIFN-γ treated EGCs isolated from Ifngr2CTRL and Ifngr2ΔEGC mice. n=4. (m) Quantification of Ki67+ EGCs in the TM of H. poly-infected Ifngr2CTRL and Ifngr2ΔEGC mice at 7 dpi (n=10). (n) Quantification of Ki67+ EGCs in the TM of WT and Ifngr1-/- mice (n=8). 2 experiments (m, n). Two-tailed Mann-Whitney test (e, f, n, o), unpaired two-tailed t-test (g, i, j, k, l, m). Mean±SEM
Extended Data Figure 4
Extended Data Figure 4. Characterisation of mice with glia-specific deletion of IFN-γ signalling.
(a) Quantification of granulomas in the small intestine at 28 dpi (n=10) and 80 dpi (n=5) WT and Ifngr1 -/- mice (2 experiments). (b) Representative images of H. poly settlement sites in Ifngr2CTRL and Ifngr2ΔEGC gut at 7 dpi. Note bleeding in Ifngr2ΔEGC mice (65.2±3.14 versus 31.8±1.56 in Ifngr2CTRL mice). n=20 animals analysed. (c, d, f) Flow cytometry gating strategy to immunophenotype the TM of naïve and H. poly-infected Ifngr2CTRL andIfngr2ΔEGC mice showing debris exclusion and doublet discrimination, selection of live immune cells (c), followed by gating of myeloid cells (d) or NK-/ T cells (f). (e) Flow cytometry quantification of neutrophils in the TM of naïve Ifngr2CTRL and Ifngr2ΔEGC mice. (nCTRL=5, nΔEGC=6). (g-i) Flow cytometry quantification of CD4 and γδT cells and NK cells at indicated time-points after H. poly infection within the TM of Ifngr2CTRL and Ifngr2ΔEGC mice. (n=4, data from 1 experiment). (j) Quantification of worms in the TM at 7 dpi (nCTRL&ΔEGC=8) or recovered from the intestinal tract at 28 (nCTRL&ΔEGC=11) and 60 days post-infection (nCTRL&ΔEGC=15). Mean±SD. Two-way Anova. (k) H. poly egg burden at 14 (nCTRL=15, nΔEGC=16), 28 (nCTRL&ΔEGC=11) and 60 dpi (nCTRL&ΔEGC=9). Two-tailed Mann-Whitney Test (e), Two-way Anova (a, g-k). Mean±SD (a, j, k), Mean±SEM (e, g-i).
Extended Data Figure 5
Extended Data Figure 5. Cellular atlas of small intestine TM.
(a) Mean normalized expression of representative marker genes and proportion of expressing cells (indicated by dot size) in the cell clusters shown in (c). Clusters are labelled with post facto annotation based on known markers. (b) Sorting strategy for live TM cells. (c) UMAP of all sequenced cells from small intestine TM. The numbers of clusters in c correspond to the numbers in a. (d) UMAP analysis of integrated scRNAseq datasets of mesenchymal cells from the lamina propria (GSE142431) and the TM (present study; Fig. 3a, b). Annotation of cellular clusters matches those reported by Roulis et al. on the basis of respective marker genes. Note that cell populations from the TM overlap with those from the lamina propria. (e) Violin plot quantification of Pdgfra expression per single cell highlighting that, similar to those in the lamina propria, TM fibroblasts are divided into Pdgfrahigh and Pdgfralow cells. (f-i) Representative images of cross-section (f) or TM preparations (g-i) from the small intestine of Sox10|tdT mice immunostained for Pdpn to identify mesothelial cells (f, arrowhead) and lymphatic endothelial cells (g), Vegfr2 and Pdgfrb to identify endothelial cells and pericytes (arrowhead), respectively (h), and Cd3 and Iba1 to identify T cells and macrophages, respectively (i). Note the small number of T cells in TM relative to macrophages. Scale bars: 50 μm, insets: 25 μm. Images representative of n=5 animals analysed.
Extended Data Figure 6
Extended Data Figure 6. Glia-specific ablation of IFN-γ signalling induces a tissue-wide pro-inflammatory state of TM at steady state and modulates the response to H. poly infection.
(a-c) UMAP representation of mesothelial cells (a), fibroblasts (b) and muscularis macrophages (c) from naïve Ifngr2CTRL (black) and Ifngr2ΔEGC (orange) mice. (d) qRT-PCR analysis of Lcn2, Il1b, Saa3 and Il6 transcript levels in the TM from naïve Ifngr2CTRL and Ifngr2ΔEGC mice. nCTRL=12, nΔEGC=11. (e) Representative H&E stained intestinal cross-sections from naïve Ifngr2CTRL and Ifngr2ΔEGC mice. Empty and filled arrowheads in inset highlight reactive mesothelial cells and eosinophils, respectively. Scale bars = 50 μm, insets: 20 μm. Shown also is histology severity score (right) assessing inflammation in the lamina propria and tunica muscularis from naïve Ifngr2CTRL and Ifngr2ΔEGC mice. n=8. 2 experiments. (f) Intestinal paracellular permeability in naïve Ifngr2CTRL and Ifngr2ΔEGC mice. nCTRL=8, nΔEGC=7 (2 independent experiments). (g) Whole intestinal transit time in naïveIfngr2CTRL and Ifngr2ΔEGC mice. nCTRL=9, nΔEGC=8. (h) Fraction of cells per cluster in naïve and H. poly-infected Ifngr2CTRL and Ifngr2ΔEGC mice. (i) Violin plot visualisation of Ifng expression levels per single cell in indicated cell clusters. (j) Dot plot quantification of expression levels of Ifng vs Cd8a (left panel) and Ifng vs Cd4 (right panel) in the Other lymphoid cells, NK cells, T Cells 1, T Cells 2 and T Cells 3 clusters, indicating that Cd8a T cells are a major source of Ifng in the TM of H. poly-infected mice at 7 dpi. Two-tailed Mann-Whitney test (d, f). Unpaired two-tailed t-test (g). Mean±SEM.
Extended Data Figure 7
Extended Data Figure 7. Activation of the IFN-γ-Cxcl10 axis in TM precedes type II immune response and promotes tissue repair after helminth infection.
(a, b) qRT-PCR analysis of Il4 and Il13 transcripts in TM (a; nnaïve=8, n3dpi,7dpi,10dpi,14dpi=6, n5dpi,28dpi=7, n21dpi=3) and Ifng, Il4, Il13 and Arg1 transcripts in mucosa (b; nnaïve,7dpi,10dpi=6, n3dpi,5dpi,14dpi,21dpi,28dpi=3) of small intestine following H. poly infection. 2 experiments. (c, d) qRT-PCR time-course analysis of Gbp6 (c) and Gbp10 (d) transcript levels in TM after H. poly infection.nnaïve=8, n3 dpi,7 dpi,10 dpi,14 dpi=6, n5 dpi,28 dpi=7, n21 dpi=3. 2 experiments. (e) Flow cytometric quantification of IFN-γ-producing cells in the TM of H. poly-infected WT mice (3 dpi). nnaïve=7, n3dpi=9. 2 experiments. (f) qRT-PCR analysis of Cxcl10 transcripts in TM from H. poly-infected (7 dpi) WT and Ifngr1 -/- mice. n=10. 2 experiments. (g) Quantification of granulomas in the small intestine H. poly-infected (28 dpi) Ifngr1 -/- and Cxcl10 -/- mice. n=9. 2 experiments. (h) qRT-PCR analysis of Cxcl10 transcripts from rIFN-γ-treated cultures (24 hours) of EGCs from Cxcl10CTRL and Cxcl10ΔEGC mice. nControl=2, nrIFN-γ=3. (i) In situ hybridization for Cxcl10 in IFN-γ-treated (1 hour) myenteric plexus from the duodenum of Cxcl10CTRL and Cxcl10ΔEGC mice. Cxcl10+ EGCs indicated by empty arrowhead. Scale bar = 10 μm. (j) Quantification of Cxcl10+ EGCs in IFN-γ-treated (1 hour) TM preparations from Cxcl10CTRL and Cxcl10ΔEGC mice. nCTRL=3, nΔEGC=4. (k) Quantification of Cxcl10+ EGCs in the TM of H. poly-infected Cxcl10CTRL and Cxcl10ΔEGC mice (3 dpi). nCTRL =3, nΔEGC=6. (l, m) Quantification of adult worms (l) and eggs (m) in small intestine from H. poly-infected Cxcl10CTRL and Cxcl10ΔEGC mice (28 dpi). nCTRL=12, nΔEGC=13. 2 experiments. (n) Dot plot analysis of Cxcr3 vs Cd8a expression indicating that Cd8+ T cells in TM express Cxcr3. Two-tailed Mann-Whitney test (f, j, k). Kruskal-Wallis test (g). Unpaired two-tailed t-test (e, h). Mean±SEM.
Figure 1
Figure 1. Inflammatory injury induces IFN-γ signature in EGCs.
(a, b) TM preparations from the duodenum of naïve (a) and H. poly-infected (b) animals (7 dpi) immunostained for S100, Sox10 and Ki67. Arrowheads: Ki67+ EGCs. (c) Quantification of Ki67+ EGCs in the duodenum, ileum and colon of H. poly-infected animals (n=4). (d) Time-course analysis of EGC-proliferation after H. poly infection (nnaïve,3dpi,5dpi,14dpi= 3, n7dpi,10dpi= 4, data from one experiment, data at 7 dpi representative of 3 experiments). (e) Volcano plot showing mean log2-transformed fold change and significance (-log10(adjusted P value)) of differentially expressed genes in tdT+ cells from naïve and H. poly-infected Sox10|tdT animals (7 dpi). Coloured dots: genes associated with the GO terms “cell cycle” (turquoise) and “response to IFN-γ” (magenta). n=4. (f) Top GO terms associated with the differentially expressed genes in EGCs from H. poly infected mice. “Cell cycle” and “response to IFN-γ” terms colours correspond to colour of genes highlighted in (g). (g-l) UMAP of sequenced EGCs from the TM of naïve and H. poly infected mice (g-i) or human healthy colon (HC) and Ulcerative Colitis colon (UC) (j-l) (human dataset, GSE114374). Cells are color-coded according to Louvain clusters (g, j), experimental (h) or disease condition (k) and mean scaled expression of IFN-γ response-associated genes (i, l; selection based on GO term “response to IFN-γ”). (m) Intersection of genes differentially expressed by mouse (left, naïve versus H. poly-infected mice) and human (right, HC versus UC patients) EGCs. Bold: IFN-γ-target genes. Kruskal-Wallis test (c, d). Mean±SEM (c, d). Scale bars: 100 μm
Figure 2
Figure 2. IFN-γ-signaling in EGCs spromotes intestinal tissue repair following helminth infection.
(a) Experimental strategy. (b-g) Characterisation of the granulomatous response of intestines from H. poly-infected Ifngr2CTRL and Ifngr2ΔEGC mice. Representative images of the small intestine at 28 dpi (b); quantification of the number (c, n28dpi=11, n60dpi=15) and size (d, n=11) of granulomas; representative H&E stained sections through granulomas (e, f; arrows: aggregates of macrophages; filled arrowheads: viable and degenerate neutrophils and eosinophils; empty arrowheads: dense eosinophilic fibrillar material, major basic protein; asterisks: basophilic karyorrhectic and eosinophilic cytoplasmic debris, necrosis); histology severity score (g, nCTRL=9, nΔEGC=12). Two experiments. (h) Intestinal transit time at 60 dpi; nCTRL=8, nΔEGC=7. Two experiments. (i-l) Flow cytometric quantification of neutrophils (i), eosinophils (j), monocytes (k) and CD8+ T cells (l) at indicated time-points in the TM of H. poly-infected Ifngr2ΔEGC and Ifngr2CTRL mice. (n=4, one experiment, data on day 7 representative of 3 experiments. Two-tailed Mann-Whitney test (d, g), unpaired two-tailed t-test (h), Two-way ANOVA with Sidak’s multiple comparison test (c, i-l). Mean±SEM (c, g, h, i, j, k, l). Scale bars: c: 0.5 cm, e, f: 500 μm, (insets: 50 μm).
Figure 3
Figure 3. Tissue-wide regulation of immune homeostasis and immune responses in the TM by the IFN-γ-EGC signalling axis.
(a) Genotypes and experimental treatment of mice (color-coded) used for scRNAseq of the TM. (b, c) UMAP of TM cells from naïve Ifngr2CTRL (b) and Ifngr2ΔEGC (c) mice. Identity of cell clusters is indicated (left). (d) Quantification of differentially expressed genes in clusters from naïve Ifngr2CTRL versus Ifngr2ΔEGC mice. (e) GSEA showing selected significant hallmark list terms for inflammatory pathways in the indicated cell clusters from naïve Ifngr2CTRL and Ifngr2ΔEGC mice. (f-h) Violin plot quantification of selected differentially expressed genes in mesothelial cells (f), fibroblasts (g) and muscularis macrophages (h) from naïve Ifngr2CTRL and Ifngr2ΔEGC mice. (i, j) UMAP of TM cells from H. poly-infected Ifngr2CTRL (i) and Ifngr2ΔEGC (j) mice. (k) Quantification of differentially expressed genes in cell clusters from H. poly-infected Ifngr2CTRL versus Ifngr2ΔEGC mice. (l) Violin plot quantification of expression of Arg1, Retnla and Chil3 in muscularis macrophages from naïve and H. poly-infected Ifngr2CTRL and Ifngr2ΔEGC mice. (m) GSEA showing selected significant hallmark list term for IFN-γ response in the indicated cell clusters from H. poly-infected Ifngr2CTRL and Ifngr2ΔEGC mice. (n, o) Violin plot of mean scaled expression of IFN-γ response-associated genes (from the GO term “response to IFN-γ”; n) and Stat1 (o) across all UMAP clusters. (p) qRT-PCR of Ifng in H. poly-infected TM (7 dpi). Mean±SEM. n=8, two experiments. Wilcoxon test (f, g, h, l, n, o), two-tailed Mann-Whitney test (p).
Figure 4
Figure 4. Early activation of IFN-γ-EGC-Cxcl10 signalling regulates tissue repair after helminth infection.
(a, b)qRT-PCR kinetics of Ifng and Arg1 (a) and Cxcl10 (b) in H. poly-infected TM. Mean±SEM, a: nnaïve==8, n3dpi,7dpi,10dpi,14dpi=6, n5dpi,28dpi=7, n21dpi=3; b: nnaïve=11, n3dpi=6, n7dpi=12. Two experiments. (c-f) TM from naïve (c, d) and H. poly-infected (3 dpi) (e, f) Yeti (c, e) and Sox10|tdT (d, f) mice immunostained for GFP, Sox10, S100β and CD45 (c, e) or hybridised for Cxcl10 (d, f). Combined and single-spectrum images of open squares shown on the right (c, e: empty and filled arrowheads indicate an EGC and an IFN-γ-producing GFP+ cell, respectively, n=4; d, f: arrowhead indicates an EGC; n=5). (g) Combined GFP/CD45 immunostaining and Sox10/Cxcl10 hybridisation of TM from H. poly-infected (3 dpi) Yeti mice. Combined and single-spectrum images of open squares at the bottom. (h) Quantification of Cxcl10+ TM EGCs of H. poly-infected (3 dpi) Ifngr2CTRL and Ifngr2ΔEGC mice; n=4. (i-l) Granulomatous response of H. poly-infected (28 dpi) intestine from Cxcl10CTRL and Cxcl10ΔEGC mice. Quantification of granulomas (i, nCTRL =12, nΔEGC=13); sections through granulomas (j, k; arrows: high numbers of neutrophils, eosinophils with scattered lymphocytes within the submucosa; filled arrowheads: viable and degenerate neutrophils and eosinophils; empty arrowheads: dense eosinophilic fibrillar material-major basic protein; asterisks: basophilic karyorrhectic and eosinophilic cytoplasmic debris-necrosis), histology severity score (l, nCTRL =9, nΔEGC=14). Two experiments. (m, o) Quantification of Cxcl10 (m) and Ifng (o) induction in H. poly-infected (7 dpi) TM of Cxcl10CTRL and Cxcl10ΔEGC mice (n=10; two experiments). (n) Quantification of TM IFN-γ+CD8+ T cells after H. poly-infection (7dpi); n=5. Representative of two experiments. Two-tailed Mann-Whitney test (h, l, n). Unpaired two-tailed t-test (i, m, o).Two-way ANOVA with Sidak’s multiple comparison (b). Mean±SEM (a, b, h, i, l-o). Scale bars: c, e: 15 μm (insets 5 μm);d, f: 50 μm (insets 10 μm); g: 10 μm; j, k: 100 μm (insets 50 μm).

Comment in

  • Glia mend the gut.
    Bordon Y. Bordon Y. Nat Rev Immunol. 2021 Dec;21(12):760-761. doi: 10.1038/s41577-021-00651-7. Nat Rev Immunol. 2021. PMID: 34725459 No abstract available.
  • Immunoregulatory role of enteric glia.
    Ray K. Ray K. Nat Rev Gastroenterol Hepatol. 2021 Dec;18(12):832-833. doi: 10.1038/s41575-021-00542-1. Nat Rev Gastroenterol Hepatol. 2021. PMID: 34725497 No abstract available.
  • Enteric glia worm their way into gut immunity.
    Rao M, Bogunovic M. Rao M, et al. Immunity. 2021 Dec 14;54(12):2698-2700. doi: 10.1016/j.immuni.2021.11.014. Immunity. 2021. PMID: 34910939

References

    1. Kotas ME, Medzhitov R. Homeostasis, inflammation, and disease susceptibility. Cell. 2015;160:816–827. doi: 10.1016/j.cell.2015.02.010. - DOI - PMC - PubMed
    1. Turner JR. Intestinal mucosal barrier function in health and disease. Nat Rev Immunol. 2009;9:799–809. doi: 10.1038/nri2653. - DOI - PubMed
    1. Abreu MT. Toll-like receptor signalling in the intestinal epithelium: how bacterial recognition shapes intestinal function. Nat Rev Immunol. 2010;10:131–144. doi: 10.1038/nri2707. - DOI - PubMed
    1. Maloy KJ, Powrie F. Intestinal homeostasis and its breakdown in inflammatory bowel disease. Nature. 2011;474:298–306. doi: 10.1038/nature10208. - DOI - PubMed
    1. Klose CS, Artis D. Innate lymphoid cells as regulators of immunity, inflammation and tissue homeostasis. Nat Immunol. 2016;17:765–774. doi: 10.1038/ni.3489. - DOI - PubMed

Publication types

MeSH terms