. 2021 Dec;600(7887):86-92.
doi: 10.1038/s41586-021-04016-x. Epub 2021 Oct 20.

Late Quaternary dynamics of Arctic biota from ancient environmental genomics

Affiliations

Late Quaternary dynamics of Arctic biota from ancient environmental genomics

Yucheng Wang et al. Nature. 2021 Dec.

Erratum in

  • Author Correction: Late Quaternary dynamics of Arctic biota from ancient environmental genomics.
    Wang Y, Pedersen MW, Alsos IG, De Sanctis B, Racimo F, Prohaska A, Coissac E, Owens HL, Merkel MKF, Fernandez-Guerra A, Rouillard A, Lammers Y, Alberti A, Denoeud F, Money D, Ruter AH, McColl H, Larsen NK, Cherezova AA, Edwards ME, Fedorov GB, Haile J, Orlando L, Vinner L, Korneliussen TS, Beilman DW, Bjørk AA, Cao J, Dockter C, Esdale J, Gusarova G, Kjeldsen KK, Mangerud J, Rasic JT, Skadhauge B, Svendsen JI, Tikhonov A, Wincker P, Xing Y, Zhang Y, Froese DG, Rahbek C, Bravo DN, Holden PB, Edwards NR, Durbin R, Meltzer DJ, Kjær KH, Möller P, Willerslev E. Wang Y, et al. Nature. 2022 Mar;603(7903):E31. doi: 10.1038/s41586-022-04628-x. Nature. 2022. PMID: 35296866 Free PMC article. No abstract available.
  • Author Correction: Late Quaternary dynamics of Arctic biota from ancient environmental genomics.
    Wang Y, Pedersen MW, Alsos IG, De Sanctis B, Racimo F, Prohaska A, Coissac E, Owens HL, Merkel MKF, Fernandez-Guerra A, Rouillard A, Lammers Y, Alberti A, Denoeud F, Money D, Ruter AH, McColl H, Larsen NK, Cherezova AA, Edwards ME, Fedorov GB, Haile J, Orlando L, Vinner L, Korneliussen TS, Beilman DW, Bjørk AA, Cao J, Dockter C, Esdale J, Gusarova G, Kjeldsen KK, Mangerud J, Rasic JT, Skadhauge B, Svendsen JI, Tikhonov A, Wincker P, Xing Y, Zhang Y, Froese DG, Rahbek C, Bravo DN, Holden PB, Edwards NR, Durbin R, Meltzer DJ, Kjær KH, Möller P, Willerslev E. Wang Y, et al. Nature. 2022 Oct;610(7931):E5. doi: 10.1038/s41586-022-05359-9. Nature. 2022. PMID: 36163291 Free PMC article. No abstract available.

Abstract

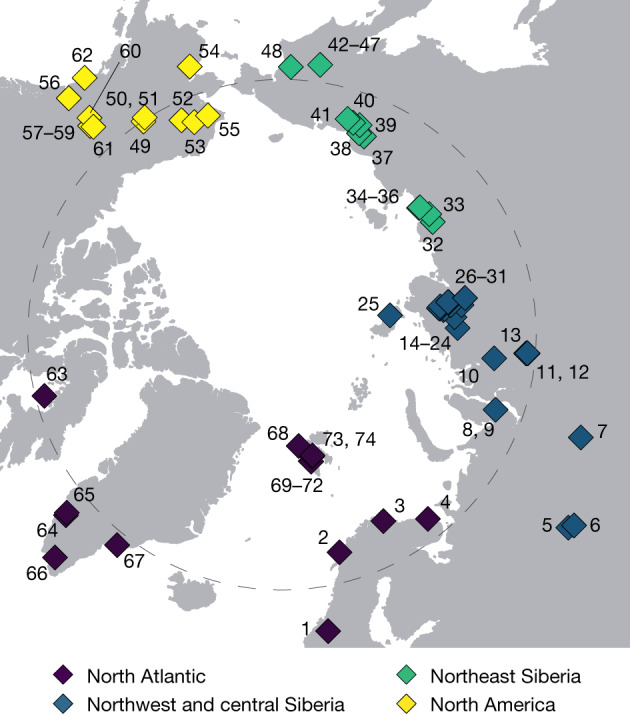
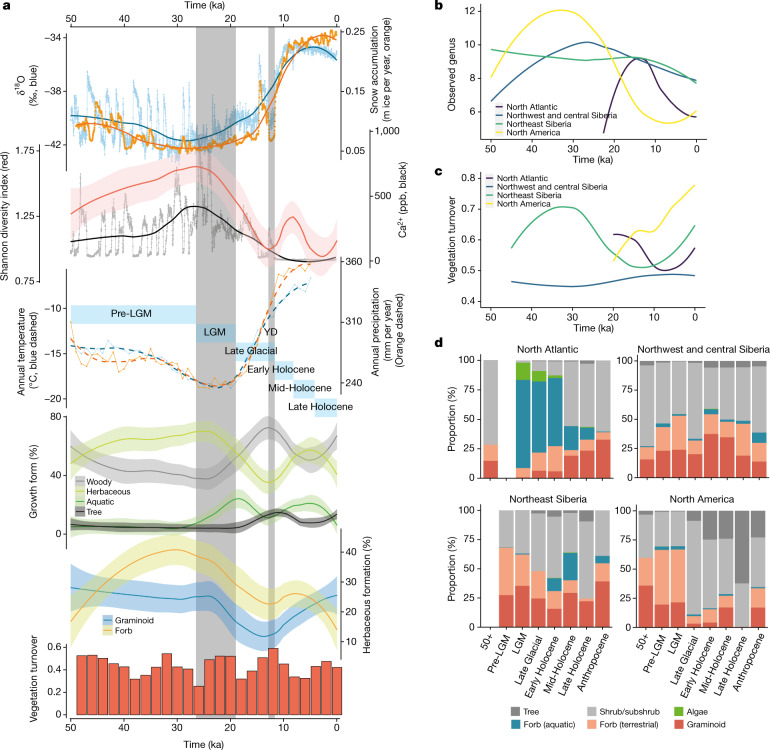
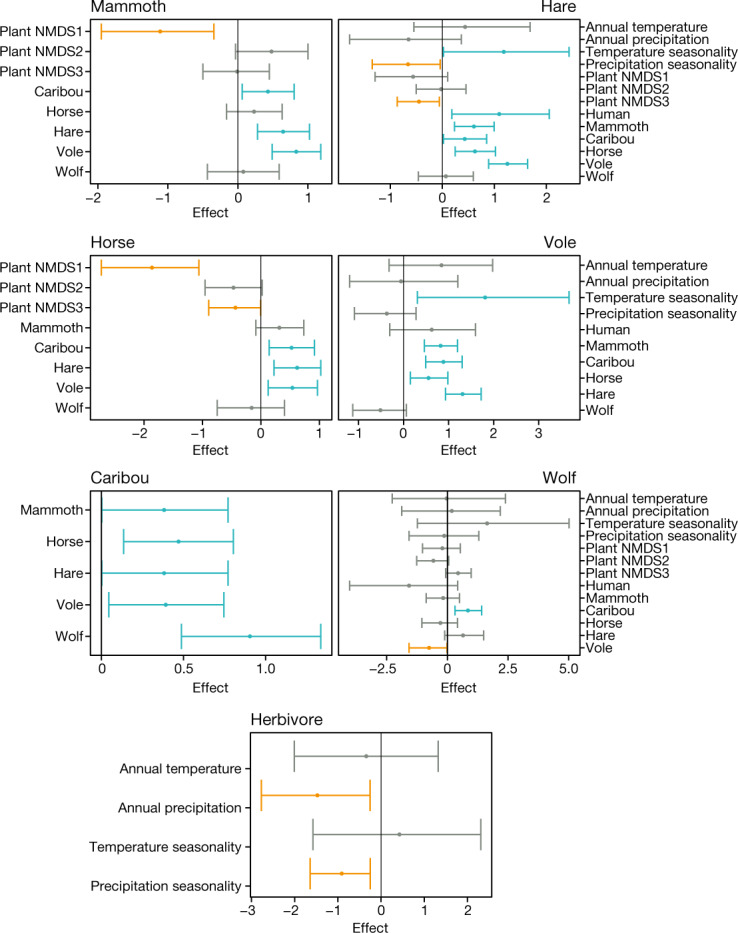
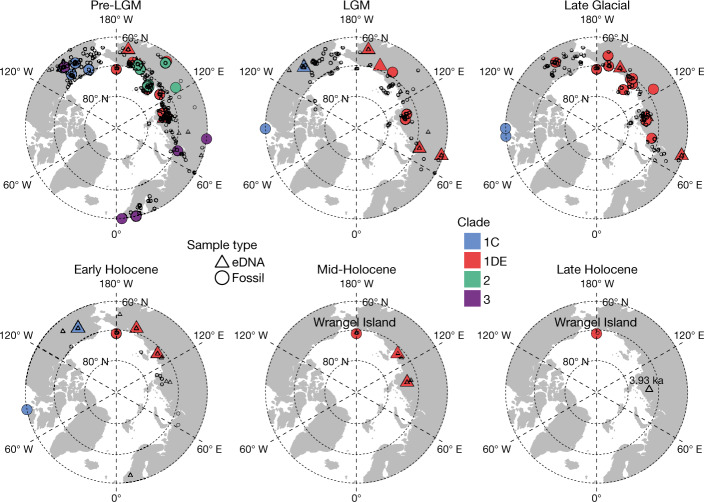
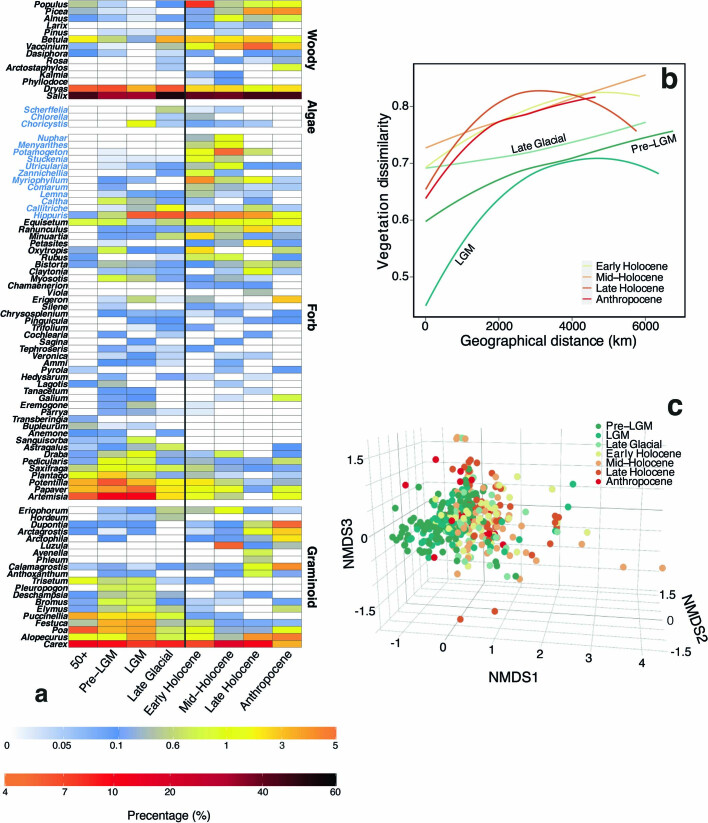
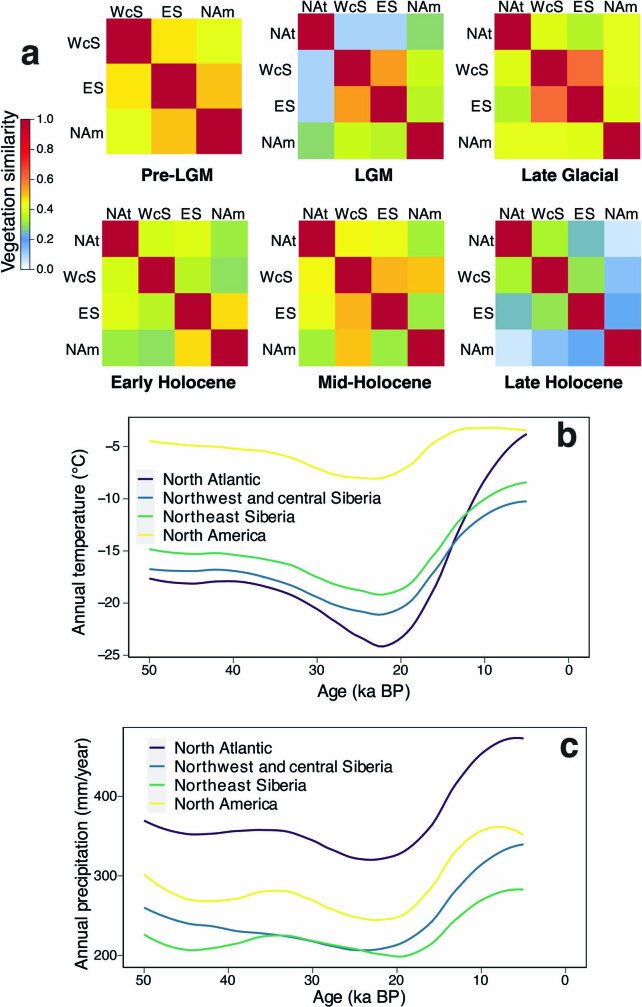
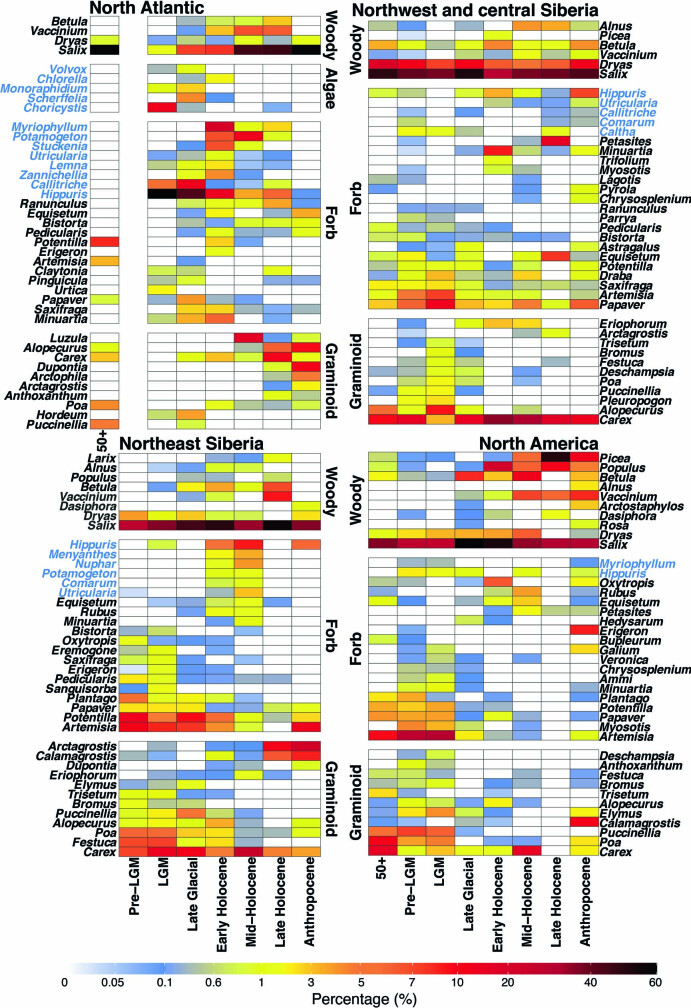
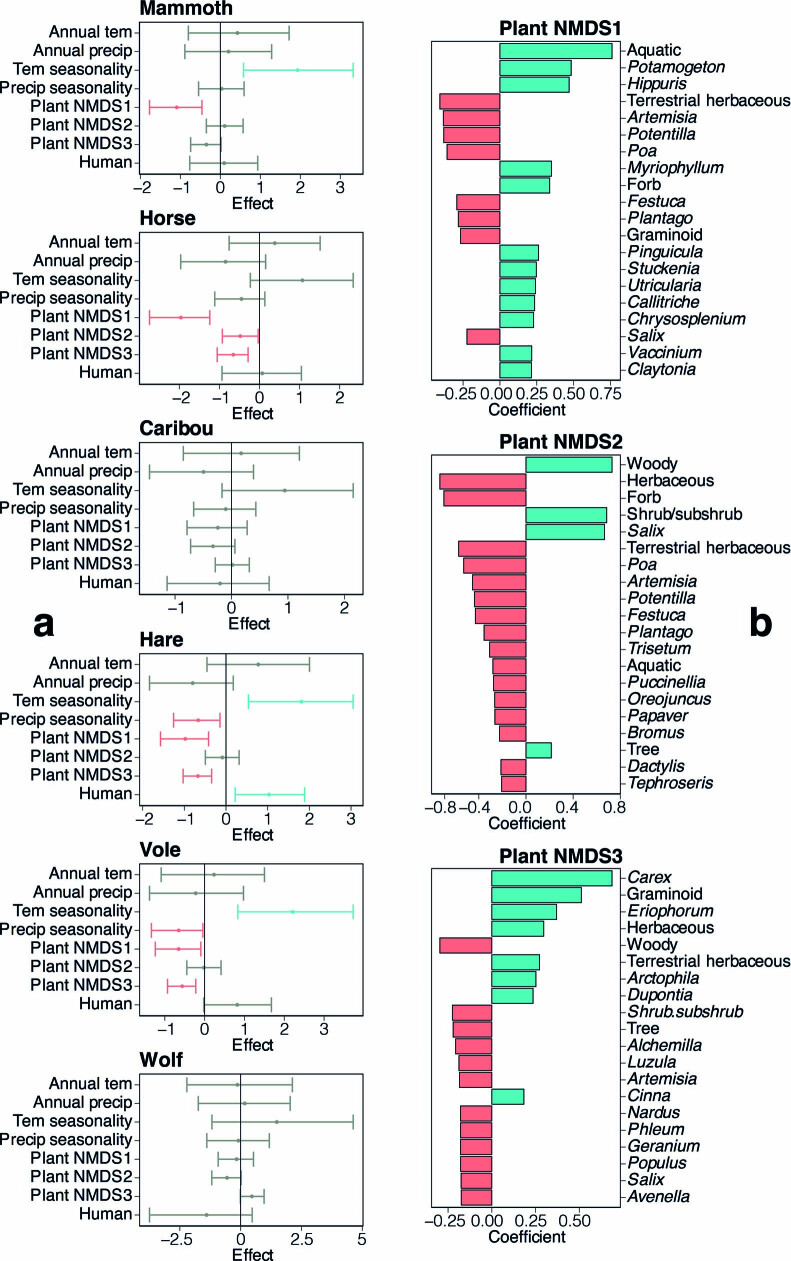
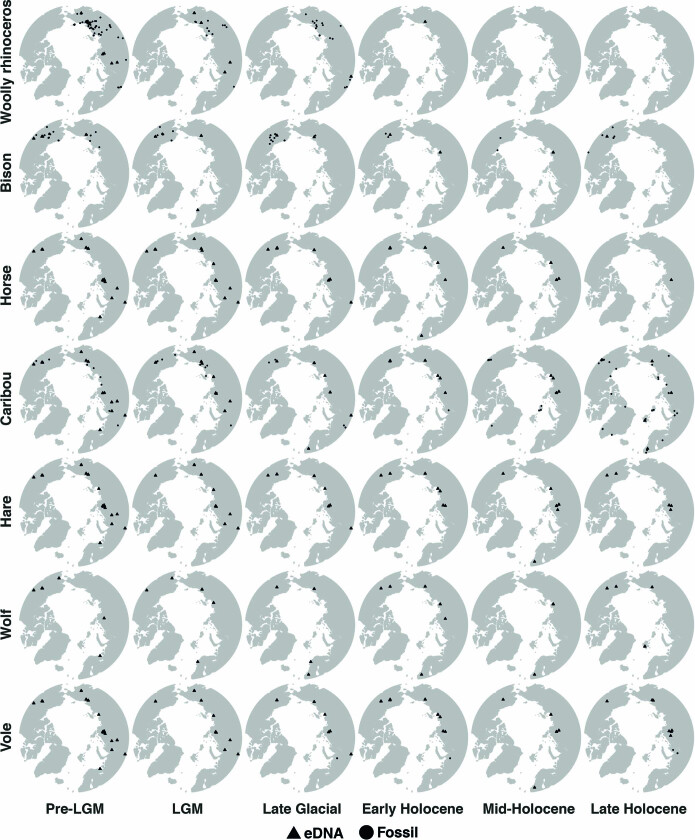
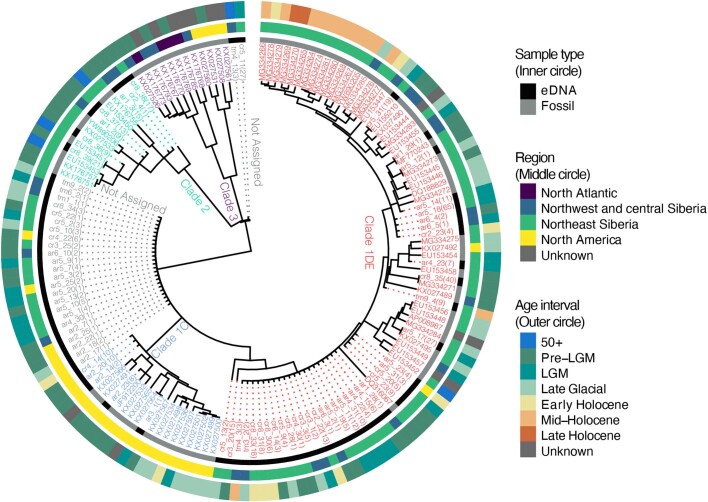
During the last glacial-interglacial cycle, Arctic biotas experienced substantial climatic changes, yet the nature, extent and rate of their responses are not fully understood1-8. Here we report a large-scale environmental DNA metagenomic study of ancient plant and mammal communities, analysing 535 permafrost and lake sediment samples from across the Arctic spanning the past 50,000 years. Furthermore, we present 1,541 contemporary plant genome assemblies that were generated as reference sequences. Our study provides several insights into the long-term dynamics of the Arctic biota at the circumpolar and regional scales. Our key findings include: (1) a relatively homogeneous steppe-tundra flora dominated the Arctic during the Last Glacial Maximum, followed by regional divergence of vegetation during the Holocene epoch; (2) certain grazing animals consistently co-occurred in space and time; (3) humans appear to have been a minor factor in driving animal distributions; (4) higher effective precipitation, as well as an increase in the proportion of wetland plants, show negative effects on animal diversity; (5) the persistence of the steppe-tundra vegetation in northern Siberia enabled the late survival of several now-extinct megafauna species, including the woolly mammoth until 3.9 ± 0.2 thousand years ago (ka) and the woolly rhinoceros until 9.8 ± 0.2 ka; and (6) phylogenetic analysis of mammoth environmental DNA reveals a previously unsampled mitochondrial lineage. Our findings highlight the power of ancient environmental metagenomics analyses to advance understanding of population histories and long-term ecological dynamics.


Conflict of interest statement

The authors declare no competing interests.

Figures

Fig. 1
Fig. 1. Site distribution (North Pole-centred view).
Samples (n = 535) from a total of 74 circumpolar sites were grouped into four geographical regions (Supplementary Information 2). The grey dashed circle indicates the Arctic Circle (66.5° N). Site IDs are labelled on the map. The corresponding information is provided in Supplementary Data 1.
Fig. 2
Fig. 2. Climate and vegetation changes over the past 50 kyr.
a, Pan-Arctic climate changes and vegetation variations. LGM (26.5−19 ka) and Younger Dryas (YD) (12.9−11.7 ka) are indicated by grey bars. The six time intervals are indicated by light blue bars (Supplementary Information 2). The error bands denote s.e. From top to bottom (see Methods for detailed calculations): the Greenlandic ice-core δ18O ratio and snow accumulation rate; the plant Shannon diversity and the Greenlandic ice-core calcium concentration; the average modelled annual temperature and precipitation for all eDNA sampling sites; the proportion of plant growth forms; the proportion of the herbaceous plant growth forms; and the vegetation turnover rates. b, The number of observed genera in different regions. c, Regional vegetation turnovers. d, Regional vegetation morphological compositions. The sample sizes for each region and time interval are provided in Supplementary Information 2. Calculations are supplied in the Methods.
Fig. 3
Fig. 3. Spatiotemporal models to retrodict the explanatory factors for animal distribution.
The values indicate posterior parameter estimates of covariate effects for the models explaining the presence–absence of each animal’s eDNA. Only covariates included in the model with lowest Watanabe–Aikaike information criterion are shown (Methods). The dots represent the posterior means, and the whiskers represent the posterior 2.5% and 97.5% quantiles. Covariate effects of which the 2.5% and 97.5% quantiles are both negative (red), and effects of which the 2.5% and 97.5% quantiles are both positive (blue) are indicated.
Fig. 4
Fig. 4. Mammoth distribution and mitochondrial haplotypes.
A total of 78 mammoth mitochondrial genomes and 159 eDNA-identified mammoths (79 among them were assigned to mitochondrial haplotypes) are shown. Records of dated mammoth fossils are also plotted. All samples older than 26.5 ka were combined into the pre-LGM interval.
Extended Data Fig. 1
Circum-Arctic plant abundance variations and vegetation similarity clustering. a, Pan-Arctic plant abundance heatmap. b,  Spatial vegetation dissimilarities. Pairwise spatial beta-diversities (dissimilarities between every two plant communities) against the geographical distances between the two communities. c, Non-metric Multidimensional Scaling (NMDS, k=3) on vegetation communities.
Extended Data Fig. 2
Regional vegetation differences and climate changes. a, Vegetation similarities between each two regions. All identified plant genera across sites in a region during a time interval were merged as a plant assemblage. Spatial beta-diversity between every two assemblages were calculated and illustrated. NAt, North Atlantic; WcS, Northwest and central Siberia; ES, Northeast Siberia; Nam, North America. b and c, Modelled annual temperature and precipitation in different regions. Means of the modelled annual temperature and precipitation values (Methods) at all eDNA sampling sites within a region at each 1,000-year time step were calculated. The changing trends are illustrated.
Extended Data Fig. 3
Regional plant abundance heatmaps. Heatmaps show the relative abundances of the 40 abundant plant genera in each region.
Extended Data Fig. 4
Extended Data Fig. 4. Environmental explanatory factors for animal distribution, and plant NMDS components.
a, Posterior parameter estimates of covariate effects for the models explaining the presence/absence of each animal’s eDNA using climate, human presence and plant NMDS as explanatory variables. The dots represent the posterior means, and the whiskers represent the posterior 2.5% and 97.5% quantiles. The colour red denotes covariate effects whose 2.5% and 97.5% quantiles are both negative, while the colour blue denotes covariate effects 2.5% and 97.5% quantiles are both positive. b, The plant genera and morphological forms correlated to the 3 components of plant NMDS. Plant genera (morphological forms) are ranked by the p-value of t-test, and only the top 20 Pearson correlations are shown. The colour red denotes negative correlations while the colour blue denotes positive correlations.
Extended Data Fig. 5
Extended Data Fig. 5. Distribution chronologies for woolly rhinoceros, bison, horse, caribou, hare, wolf, and vole.
We combined our DNA results and the fossil records (available for woolly rhinoceros, bison, and caribou). Samples older than 26.5 ka were combined into Pre-LGM; samples younger than 4.2 ka were combined into the Late Holocene.
Extended Data Fig. 6
Extended Data Fig. 6. Mammoth mitochondrial phylogenetic tree.
For placed eDNA samples the number of supporting single-nucleotide polymorphisms is given in braces (Methods). IDs for the Wrangel Island population are underlined.

Comment in

  • When did mammoths go extinct?
    Miller JH, Simpson C. Miller JH, et al. Nature. 2022 Dec;612(7938):E1-E3. doi: 10.1038/s41586-022-05416-3. Epub 2022 Nov 30. Nature. 2022. PMID: 36450914 Free PMC article. No abstract available.

Similar articles

  • Pre-extinction Demographic Stability and Genomic Signatures of Adaptation in the Woolly Rhinoceros.
    Lord E, Dussex N, Kierczak M, Díez-Del-Molino D, Ryder OA, Stanton DWG, Gilbert MTP, Sánchez-Barreiro F, Zhang G, Sinding MS, Lorenzen ED, Willerslev E, Protopopov A, Shidlovskiy F, Fedorov S, Bocherens H, Nathan SKSS, Goossens B, van der Plicht J, Chan YL, Prost S, Potapova O, Kirillova I, Lister AM, Heintzman PD, Kapp JD, Shapiro B, Vartanyan S, Götherström A, Dalén L. Lord E, et al. Curr Biol. 2020 Oct 5;30(19):3871-3879.e7. doi: 10.1016/j.cub.2020.07.046. Epub 2020 Aug 13. Curr Biol. 2020. PMID: 32795436
  • Potential plant extinctions with the loss of the Pleistocene mammoth steppe.
    Courtin J, Stoof-Leichsenring KR, Lisovski S, Liu Y, Alsos IG, Biskaborn BK, Diekmann B, Melles M, Wagner B, Pestryakova L, Russell J, Huang Y, Herzschuh U. Courtin J, et al. Nat Commun. 2025 Jan 14;16(1):645. doi: 10.1038/s41467-024-55542-x. Nat Commun. 2025. PMID: 39809751 Free PMC article.
  • Species-specific responses of Late Quaternary megafauna to climate and humans.
    Lorenzen ED, Nogués-Bravo D, Orlando L, Weinstock J, Binladen J, Marske KA, Ugan A, Borregaard MK, Gilbert MT, Nielsen R, Ho SY, Goebel T, Graf KE, Byers D, Stenderup JT, Rasmussen M, Campos PF, Leonard JA, Koepfli KP, Froese D, Zazula G, Stafford TW Jr, Aaris-Sørensen K, Batra P, Haywood AM, Singarayer JS, Valdes PJ, Boeskorov G, Burns JA, Davydov SP, Haile J, Jenkins DL, Kosintsev P, Kuznetsova T, Lai X, Martin LD, McDonald HG, Mol D, Meldgaard M, Munch K, Stephan E, Sablin M, Sommer RS, Sipko T, Scott E, Suchard MA, Tikhonov A, Willerslev R, Wayne RK, Cooper A, Hofreiter M, Sher A, Shapiro B, Rahbek C, Willerslev E. Lorenzen ED, et al. Nature. 2011 Nov 2;479(7373):359-64. doi: 10.1038/nature10574. Nature. 2011. PMID: 22048313 Free PMC article.
  • Ancient and modern environmental DNA.
    Pedersen MW, Overballe-Petersen S, Ermini L, Sarkissian CD, Haile J, Hellstrom M, Spens J, Thomsen PF, Bohmann K, Cappellini E, Schnell IB, Wales NA, Carøe C, Campos PF, Schmidt AM, Gilbert MT, Hansen AJ, Orlando L, Willerslev E. Pedersen MW, et al. Philos Trans R Soc Lond B Biol Sci. 2015 Jan 19;370(1660):20130383. doi: 10.1098/rstb.2013.0383. Philos Trans R Soc Lond B Biol Sci. 2015. PMID: 25487334 Free PMC article. Review.
  • Past changes in Arctic terrestrial ecosystems, climate and UV radiation.
    Callaghan TV, Björn LO, Chernov Y, Chapin T, Christensen TR, Huntley B, Ims RA, Johansson M, Jolly D, Jonasson S, Matveyeva N, Panikov N, Oechel W, Shaver G. Callaghan TV, et al. Ambio. 2004 Nov;33(7):398-403. doi: 10.1579/0044-7447-33.7.398. Ambio. 2004. PMID: 15573568 Review.

Cited by

References

    1. Binney H, et al. Vegetation of Eurasia from the last glacial maximum to present: key biogeographic patterns. Quat. Sci. Rev. 2017;157:80–97. doi: 10.1016/j.quascirev.2016.11.022. - DOI
    1. Clark PU, et al. The Last Glacial Maximum. Science. 2009;325:710–714. doi: 10.1126/science.1172873. - DOI - PubMed
    1. Bigelow, N. H. Climate change and Arctic ecosystems: 1. Vegetation changes north of 55°N between the last glacial maximum, mid-Holocene, and present. J. Geophys. Res. 108, 10.1029/2002jd002558 (2003).
    1. Graham RW, et al. Timing and causes of mid-Holocene mammoth extinction on St. Paul Island, Alaska. Proc. Natl Acad. Sci. USA. 2016;113:9310–9314. doi: 10.1073/pnas.1604903113. - DOI - PMC - PubMed
    1. Stuart AJ. Late Quaternary megafaunal extinctions on the continents: a short review. Geol. J. 2015;50:338–363. doi: 10.1002/gj.2633. - DOI

Publication types

MeSH terms