. 2021 Oct;598(7882):634-640.
doi: 10.1038/s41586-021-04018-9. Epub 2021 Oct 20.

The origins and spread of domestic horses from the Western Eurasian steppes

Pablo Librado  1 Naveed Khan  1   2 Antoine Fages  1 Mariya A Kusliy  1   3 Tomasz Suchan  1   4 Laure Tonasso-Calvière  1 Stéphanie Schiavinato  1 Duha Alioglu  1 Aurore Fromentier  1 Aude Perdereau  5 Jean-Marc Aury  6 Charleen Gaunitz  1 Lorelei Chauvey  1 Andaine Seguin-Orlando  1 Clio Der Sarkissian  1 John Southon  7 Beth Shapiro  8   9 Alexey A Tishkin  10 Alexey A Kovalev  11 Saleh Alquraishi  12 Ahmed H Alfarhan  12 Khaled A S Al-Rasheid  12 Timo Seregély  13 Lutz Klassen  14 Rune Iversen  15 Olivier Bignon-Lau  16 Pierre Bodu  16 Monique Olive  16 Jean-Christophe Castel  17 Myriam Boudadi-Maligne  18 Nadir Alvarez  19   20 Mietje Germonpré  21 Magdalena Moskal-Del Hoyo  4 Jarosław Wilczyński  22 Sylwia Pospuła  22 Anna Lasota-Kuś  23 Krzysztof Tunia  23 Marek Nowak  24 Eve Rannamäe  25 Urmas Saarma  26 Gennady Boeskorov  27 Lembi Lōugas  28 René Kyselý  29 Lubomír Peške  30 Adrian Bălășescu  31 Valentin Dumitrașcu  31 Roxana Dobrescu  31 Daniel Gerber  32   33 Viktória Kiss  34 Anna Szécsényi-Nagy  32 Balázs G Mende  32 Zsolt Gallina  35 Krisztina Somogyi  36 Gabriella Kulcsár  34 Erika Gál  34 Robin Bendrey  37 Morten E Allentoft  38   39 Ghenadie Sirbu  40 Valentin Dergachev  41 Henry Shephard  42 Noémie Tomadini  43 Sandrine Grouard  43 Aleksei Kasparov  44 Alexander E Basilyan  45 Mikhail A Anisimov  46 Pavel A Nikolskiy  45 Elena Y Pavlova  46 Vladimir Pitulko  44 Gottfried Brem  47 Barbara Wallner  47 Christoph Schwall  48 Marcel Keller  49   50 Keiko Kitagawa  51   52   53 Alexander N Bessudnov  54 Alexander Bessudnov  44 William Taylor  55 Jérome Magail  56 Jamiyan-Ombo Gantulga  57 Jamsranjav Bayarsaikhan  58   59 Diimaajav Erdenebaatar  60 Kubatbeek Tabaldiev  61 Enkhbayar Mijiddorj  60 Bazartseren Boldgiv  62 Turbat Tsagaan  57 Mélanie Pruvost  18 Sandra Olsen  63 Cheryl A Makarewicz  64   65 Silvia Valenzuela Lamas  66 Silvia Albizuri Canadell  67 Ariadna Nieto Espinet  68 Ma Pilar Iborra  69 Jaime Lira Garrido  70   71 Esther Rodríguez González  72 Sebastián Celestino  72 Carmen Olària  73 Juan Luis Arsuaga  71   74 Nadiia Kotova  75 Alexander Pryor  76 Pam Crabtree  77 Rinat Zhumatayev  78 Abdesh Toleubaev  78 Nina L Morgunova  79 Tatiana Kuznetsova  80   81 David Lordkipanize  82   83 Matilde Marzullo  84 Ornella Prato  84 Giovanna Bagnasco Gianni  84 Umberto Tecchiati  84 Benoit Clavel  43 Sébastien Lepetz  43 Hossein Davoudi  85 Marjan Mashkour  43   85 Natalia Ya Berezina  86 Philipp W Stockhammer  87   88 Johannes Krause  50   87 Wolfgang Haak  50   87   89 Arturo Morales-Muñiz  90 Norbert Benecke  91 Michael Hofreiter  92 Arne Ludwig  93   94 Alexander S Graphodatsky  3 Joris Peters  95   96 Kirill Yu Kiryushin  10 Tumur-Ochir Iderkhangai  60 Nikolay A Bokovenko  44 Sergey K Vasiliev  97 Nikolai N Seregin  10 Konstantin V Chugunov  98 Natalya A Plasteeva  99 Gennady F Baryshnikov  100 Ekaterina Petrova  101 Mikhail Sablin  100 Elina Ananyevskaya  101 Andrey Logvin  102 Irina Shevnina  102 Victor Logvin  103 Saule Kalieva  103 Valeriy Loman  104 Igor Kukushkin  104 Ilya Merz  105 Victor Merz  105 Sergazy Sakenov  106 Victor Varfolomeyev  104 Emma Usmanova  104 Viktor Zaibert  107 Benjamin Arbuckle  108 Andrey B Belinskiy  109 Alexej Kalmykov  109 Sabine Reinhold  91 Svend Hansen  91 Aleksandr I Yudin  110 Alekandr A Vybornov  111 Andrey Epimakhov  112   113 Natalia S Berezina  114 Natalia Roslyakova  111 Pavel A Kosintsev  99   115 Pavel F Kuznetsov  111 David Anthony  116   117 Guus J Kroonen  118   119 Kristian Kristiansen  120   121 Patrick Wincker  6 Alan Outram  76 Ludovic Orlando  122
Affiliations

The origins and spread of domestic horses from the Western Eurasian steppes

Pablo Librado et al. Nature. 2021 Oct.

Abstract

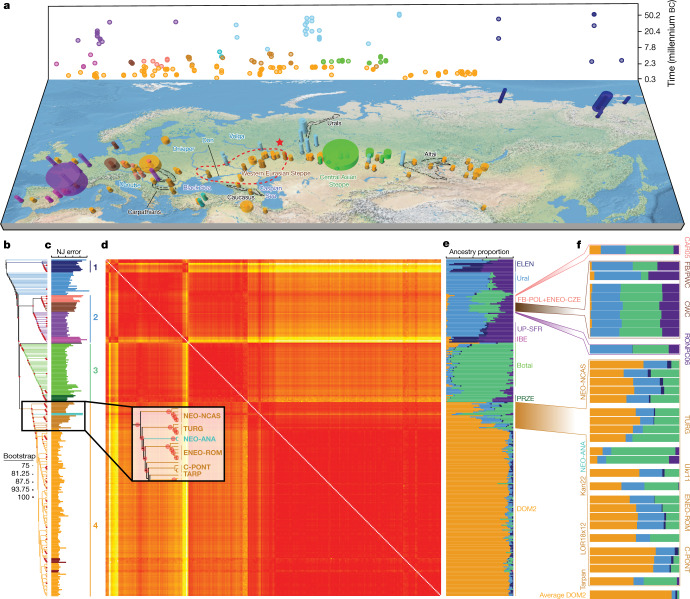
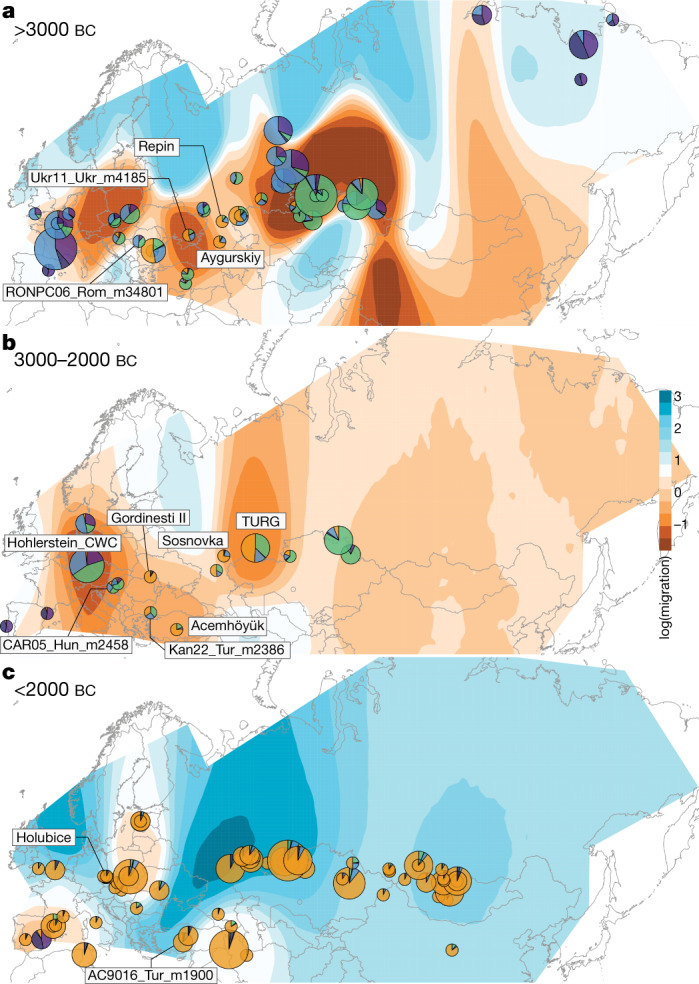
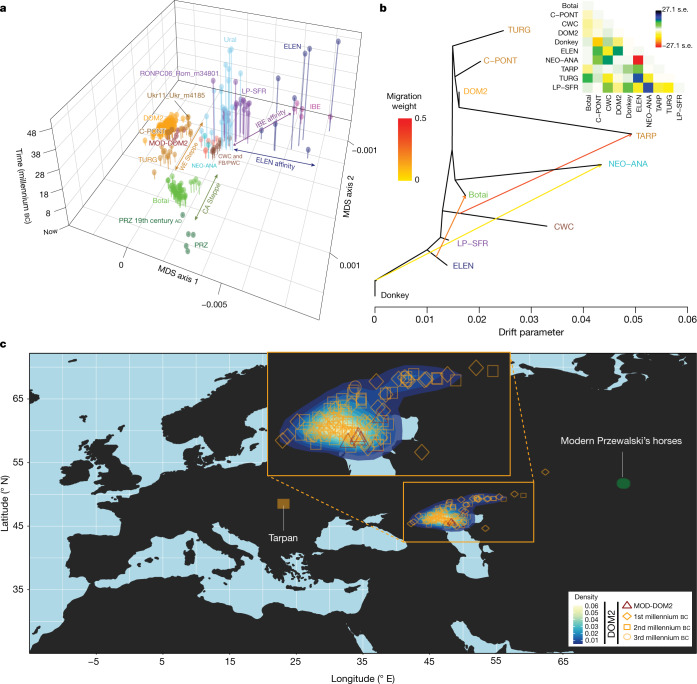
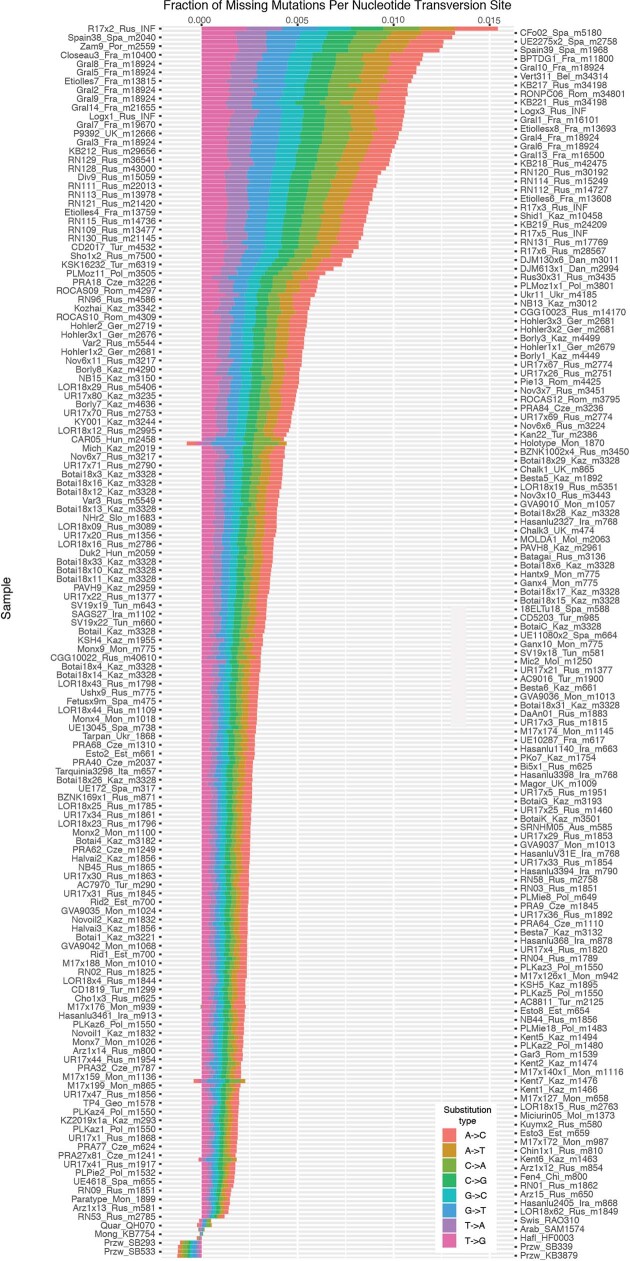
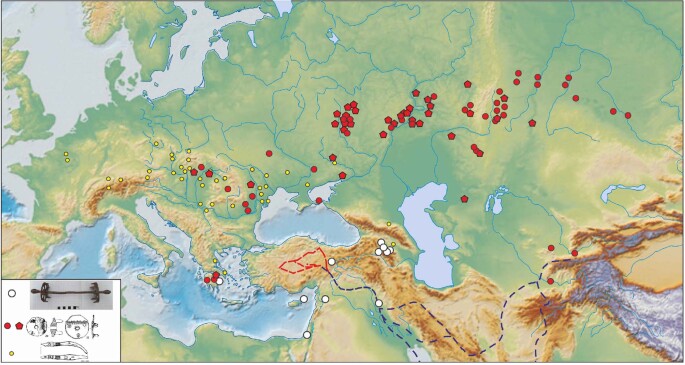
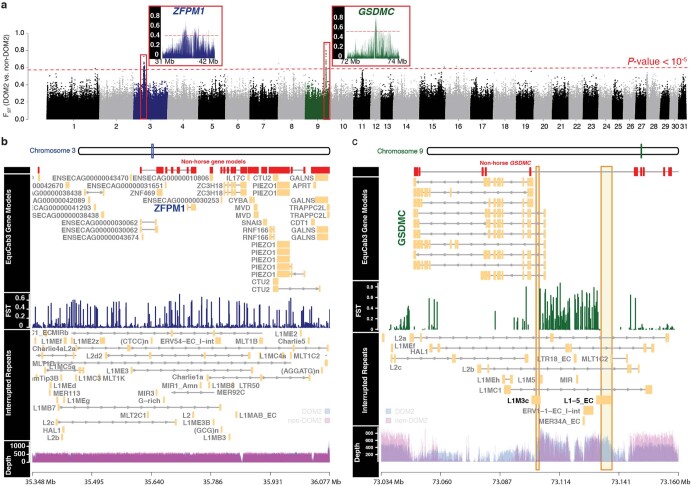
Domestication of horses fundamentally transformed long-range mobility and warfare1. However, modern domesticated breeds do not descend from the earliest domestic horse lineage associated with archaeological evidence of bridling, milking and corralling2-4 at Botai, Central Asia around 3500 BC3. Other longstanding candidate regions for horse domestication, such as Iberia5 and Anatolia6, have also recently been challenged. Thus, the genetic, geographic and temporal origins of modern domestic horses have remained unknown. Here we pinpoint the Western Eurasian steppes, especially the lower Volga-Don region, as the homeland of modern domestic horses. Furthermore, we map the population changes accompanying domestication from 273 ancient horse genomes. This reveals that modern domestic horses ultimately replaced almost all other local populations as they expanded rapidly across Eurasia from about 2000 BC, synchronously with equestrian material culture, including Sintashta spoke-wheeled chariots. We find that equestrianism involved strong selection for critical locomotor and behavioural adaptations at the GSDMC and ZFPM1 genes. Our results reject the commonly held association7 between horseback riding and the massive expansion of Yamnaya steppe pastoralists into Europe around 3000 BC8,9 driving the spread of Indo-European languages10. This contrasts with the scenario in Asia where Indo-Iranian languages, chariots and horses spread together, following the early second millennium BC Sintashta culture11,12.


Conflict of interest statement

The authors declare no competing interests.

Figures

Fig. 1
Fig. 1. Ancient horse remains and their genomic affinities.
a, Temporal and geographic sampling. The red star indicates the location of the two TURG horses (late Yamnaya context) showing genetic continuity with DOM2. The dashed line indicates the inferred homeland of DOM2 horses in the lower Volga-Don region. Colours refer to regions and/or time periods delineating genetically close horses. The radius of each cylinder is proportional to the number of samples analysed (for <10 specimens; radius constant above this), and the height refers to the time range covered. b, Neighbour-joining phylogenomic tree (100 bootstrap pseudo-replicates). Samples are coloured according to a and the main phylogenetic clusters are numbered from 1 to 4. c, Fold difference between neighbour-joining-based and raw pairwise genetic distances. d, Pairwise distance matrix of Struct-f4 genetic affinities between samples. Increasing genetic affinities are indicated by a yellow-to-red gradient. e, Struct-f4 ancestry component profiles. f, Ancestry profiles of selected key horse groups and samples. PRZE, Przewalski; UP-SFR, Upper Palaeolithic Southern France.
Fig. 2
Fig. 2. Horse geographic and genetic affinities.
ac, EEMS-predicted migration barriers and average ancestry components found in each archaeological site from before 3000 bc (a), during the third millennium bc (b) and after around 2000 bc (c). The size of the pie charts is proportional to the number of samples analysed in a given location (<10, constant above). Pie chart colours refer to K = 6 ancestry components, averaged per location. Regions inferred as geographic barriers are shown in shades of brown, and regions affected by migrations are shown in shades of blue. The base map was obtained from rworldmap.
Fig. 3
Fig. 3. Population genetic affinities, evolutionary history and geographic origins.
a, Multi-dimensional scaling plot of f4-based genetic affinities. The age of the samples is indicated along the vertical axis. CA, Central Asia. b, Horse evolutionary history inferred by OrientAGraph with three migration edges and nine lineages representing key genomic ancestries (coloured as in Fig 1a). The model explains 99.99% of the total variance. The triangular pairwise matrix provides model residuals. The external branch leading to donkey was set to zero to improve visualization. c, LOCATOR predictions of the geographic region where the ancestors of DOM2, tarpan and modern Przewalski’s horses lived. The tarpan and modern Przewalski’s horses do not descend from the same ancestral population as modern domestic horses. The map was drawn using the maps R package.
Extended Data Fig. 1
Extended Data Fig. 1. Proportion of missing derived mutations at sites representing nucleotide transversions.
Proportions are provided relative to the genome of a modern Icelandic (P5782) horse (Spearman correlation coefficient between total transversion errors and time, R=−0.77 p-value =0).
Extended Data Fig. 2
Extended Data Fig. 2. Struct-f4 validation.
a, Simulated demographic model. A single migration pulse is assumed to have occurred 150 generations ago from population E into B. The magnitude of the migration represents 5% to 25% of the effective size of population B. The model was also simulated in the absence of migration (i.e. m=0%). Five individuals are simulated per population considered, except for the outgroup where only one individual was considered. b, Correlation of the expected levels of gene-flow with the predicted E-ancestry component in individuals i belonging to population B, as well as with the average Z-scores of the f4(A, Bi; E, Outgroup) configurations, which reflects the stochasticity resulting from the simulations, prior to any inference. Each point represents a simulated individual. Colors indicate the 10 independent simulation replicates carried out. c, Predicted ancestry profiles in the absence (m=0%) and with gene flow (m=25% and K=7, as per the number of internal nodes immediately ancestral to the 10 extant populations).
Extended Data Fig. 3
Extended Data Fig. 3. Mobility and demographic shifts.
a–c, Correlation between observed pairwise genetic distances between demes as inferred by EEMS and Haversine geographic distances prior to ~3,000 BCE (a), during the third millennium BCE (b) and after ~2,000 BCE (c). d, Isolation-by-distance patterns through time inferred from autosomal (red) and X-chromosomal (blue) variation. e–f, Bayesian Skyline plots reconstructed from mtDNA (e) and Y-chromosomal variation (f). The third millennium BCE is highlighted in blue. The red line indicates the median of the 95% confidence range, shown in grey.
Extended Data Fig. 4
Extended Data Fig. 4. Individual ancestry profiles.
a, NJ-tree shown in Fig 1b with sample labels as defined in Supplementary Table 1. b, Struct-f4 individual ancestry profiles. c, Model likelihood. A total of K=4 to K=9 ancestral populations are assumed. LnL = natural log-likelihood.
Extended Data Fig. 5
Extended Data Fig. 5. OrientAGraph population histories and genetic distances to the domestic donkey.
a–e, OrientAGraph models and residuals assuming M=0 to M=5 migration edges and considering nine lineages representing key genomic ancestries (colored as in Fig 1a). M=3 is shown in Fig 3b. f, Pairwise genetic distances between a given horse and the domestic donkey plotted as a function of the age of the horse specimen considered.
Extended Data Fig. 6
Extended Data Fig. 6. Inter-regional trade and chariot networks, marked by horse cheek pieces, connecting Bronze Age steppe societies, mineral rich Caucasian societies and the Old Assyrian trade network during the period 1,950-1,750 BCE.
Documented Near Eastern trade routes are marked with stippled lines (after, supplemented with data from, and Pavel F. Kuznetsov).
Extended Data Fig. 7
Extended Data Fig. 7. DOM2 selection signatures.
a, Manhattan plot of FST-differentiation index between DOM2 and non-DOM2 horses along the 31 EquCab3 autosomes. FST outliers are highlighted using an empirical P-value threshold of 10−5 (red dashed line). The two outlier regions on chromosomes 3 and 9 are highlighted within red frames. b, FST-differentiation index and genomic tracks around the ZFPM1 gene. Depth represents the accumulated number of reads per position within DOM2 (blue) and non-DOM2 (magenta) genomes. c, Same as Panel b at GSDMC.
Extended Data Fig. 8
Extended Data Fig. 8. Normalized read coverage supporting the presence of causative alleles for coat coloration variation.
Each column represents a particular genome position where genetic polymorphisms associated or causative for coat coloration patterns have been described. The exact EquCab3 genome coordinates are indicated in the locus label. Specimens (rows) are ordered according to their phylogenetic relationships, as shown in Fig 1b. The color gradient is proportional to the fraction of reads carrying the causative variant. Loci that are not covered following trimming and rescaling of individual BAM sequence alignment files are indicated with a white cross.

References

    1. Kelekna, P. The Horse in Human History (Cambridge Univ. Press, 2009).
    1. Outram AK, et al. The earliest horse harnessing and milking. Science. 2009;323:1332–1335. doi: 10.1126/science.1168594. - DOI - PubMed
    1. Gaunitz C, et al. Ancient genomes revisit the ancestry of domestic and Przewalski’s horses. Science. 2018;360:111–114. doi: 10.1126/science.aao3297. - DOI - PubMed
    1. Olsen, S. L. in Horses and Humans: The Evolution of Human Equine Relationships (eds Olsen S. L.et al.) 81–113 (Archaeopress, 2006).
    1. Fages A, et al. Tracking five millennia of horse management with extensive ancient genome time series. Cell. 2019;177:1419–1435.e31. doi: 10.1016/j.cell.2019.03.049. - DOI - PMC - PubMed

Publication types