. 2021 Nov;599(7884):302-307.
doi: 10.1038/s41586-021-04049-2. Epub 2021 Oct 20.

Low glycaemic diets alter lipid metabolism to influence tumour growth

Affiliations

Low glycaemic diets alter lipid metabolism to influence tumour growth

Evan C Lien et al. Nature. 2021 Nov.

Abstract

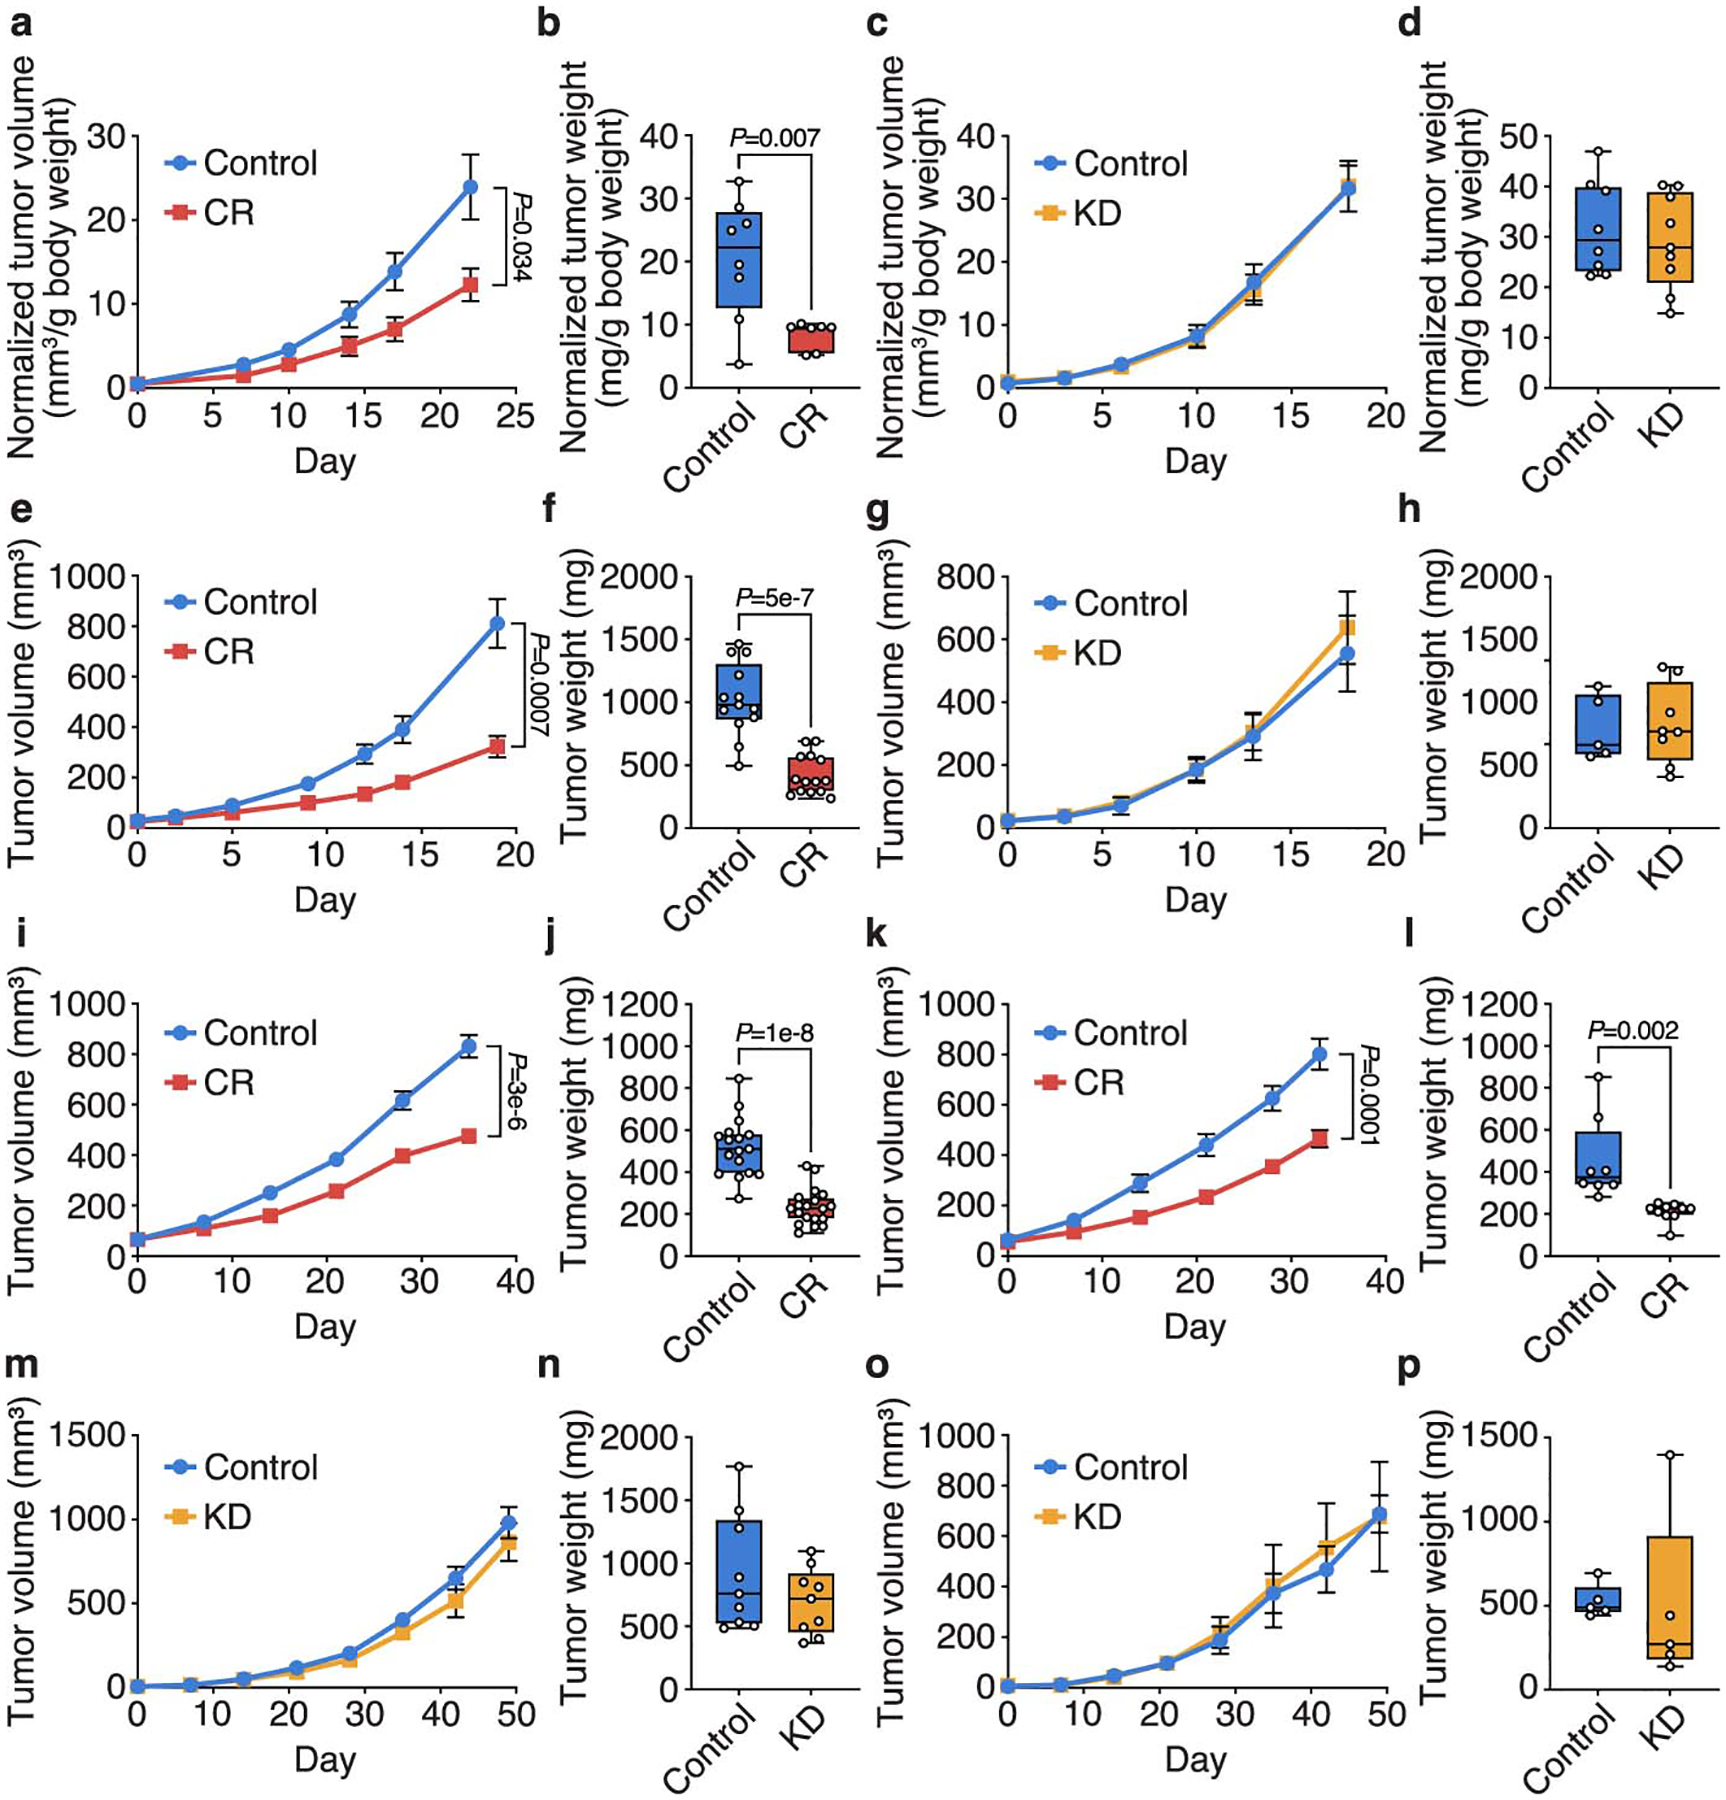
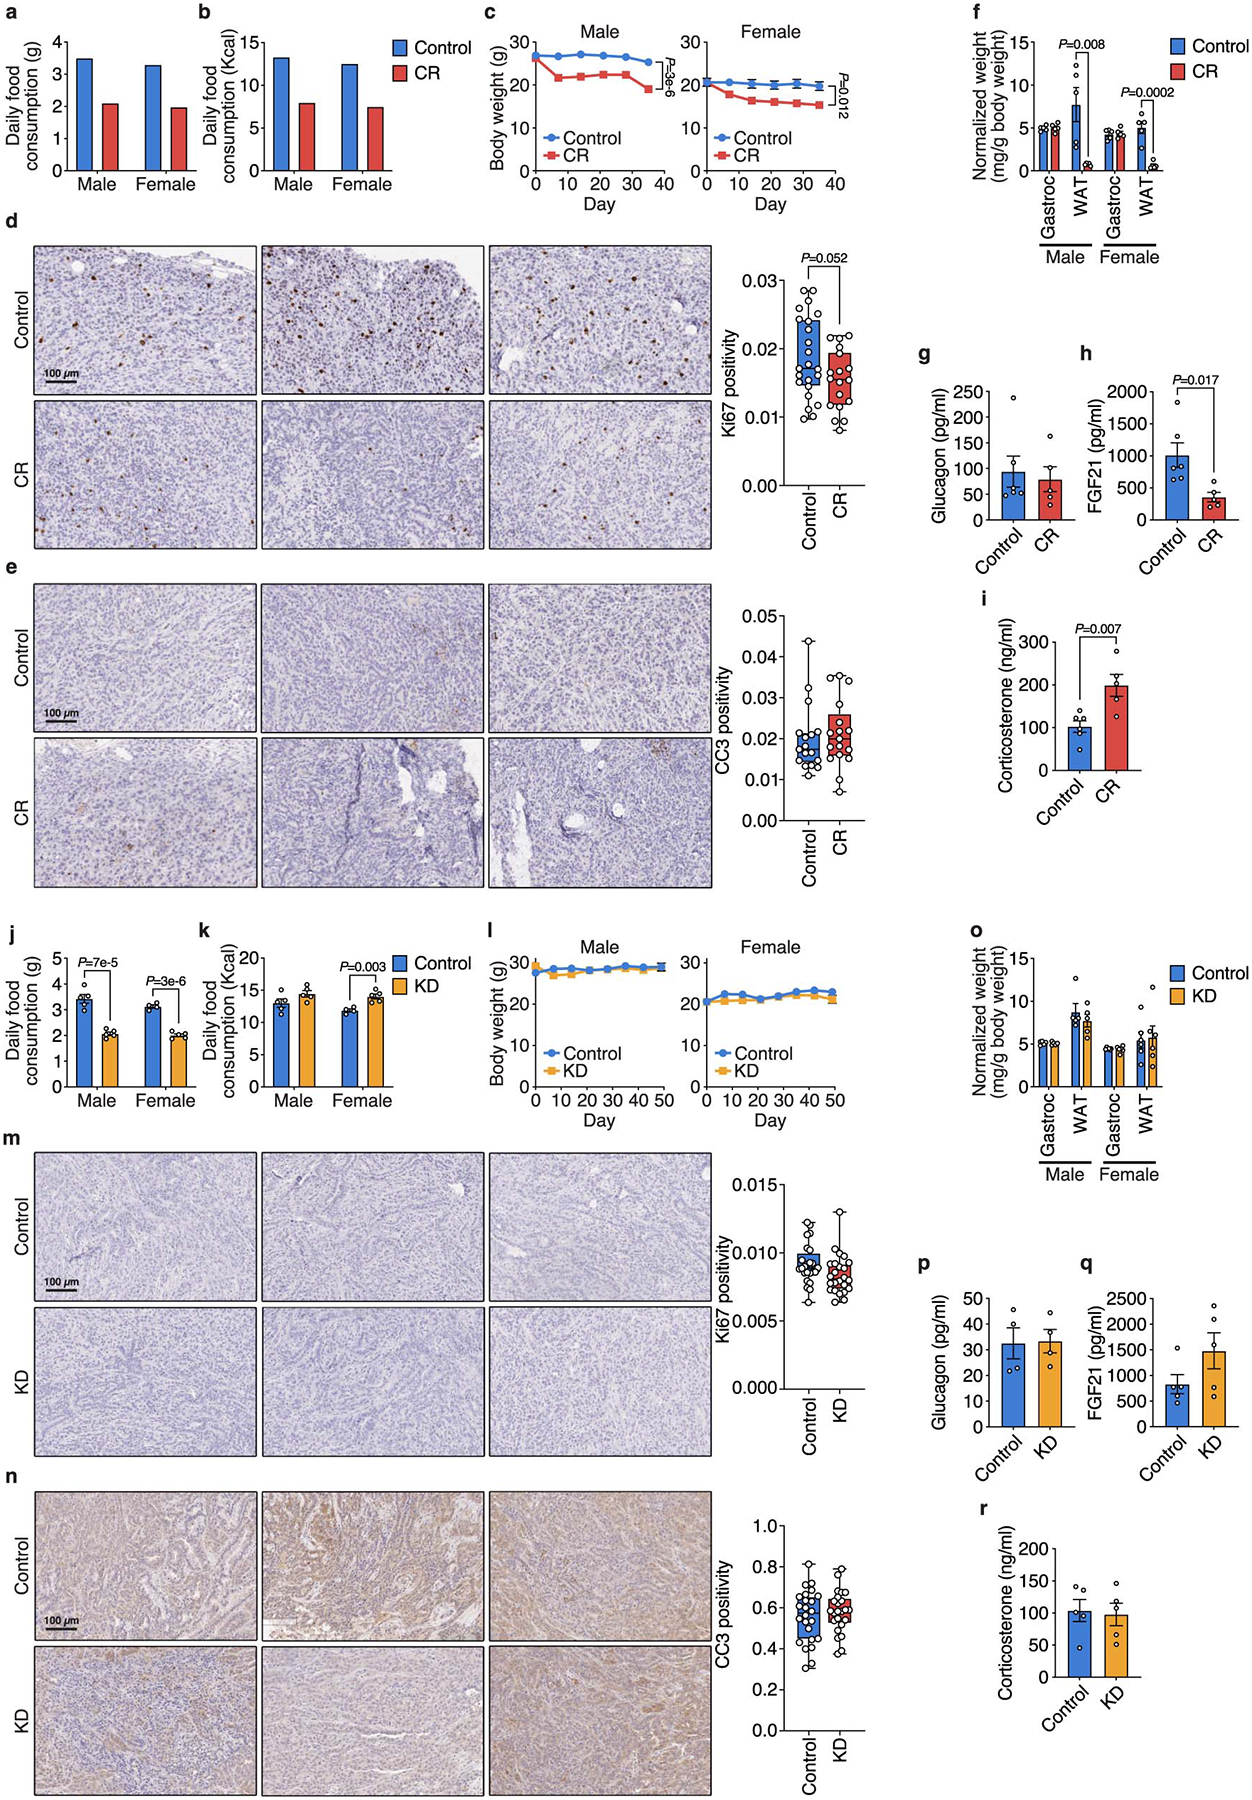
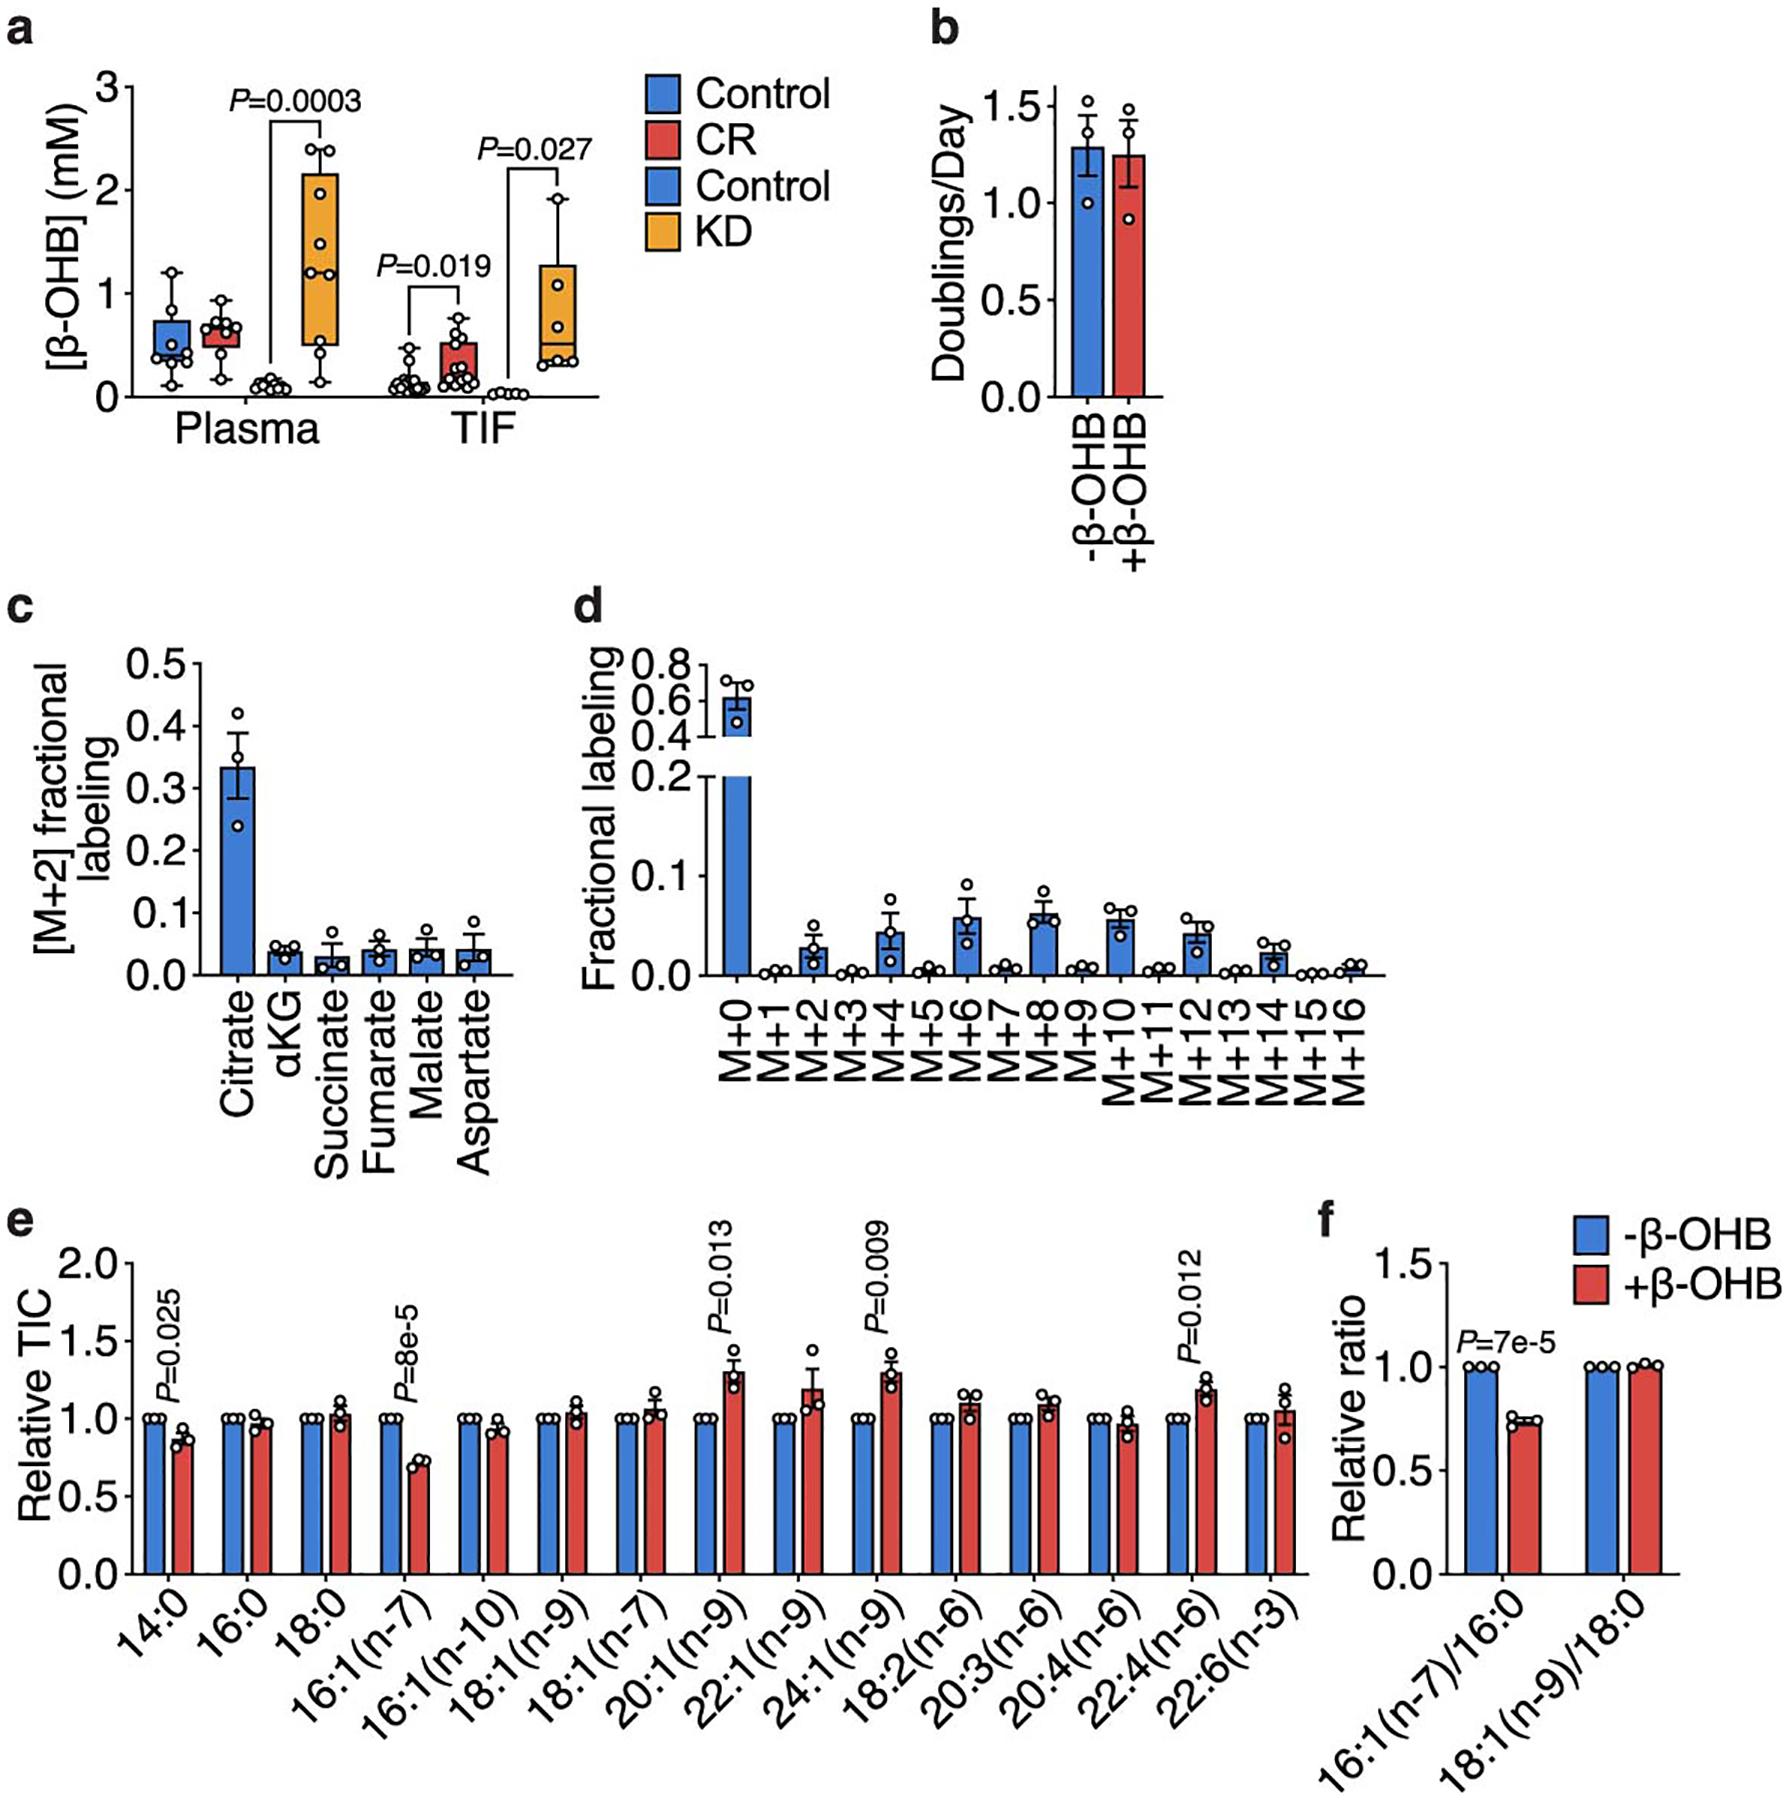
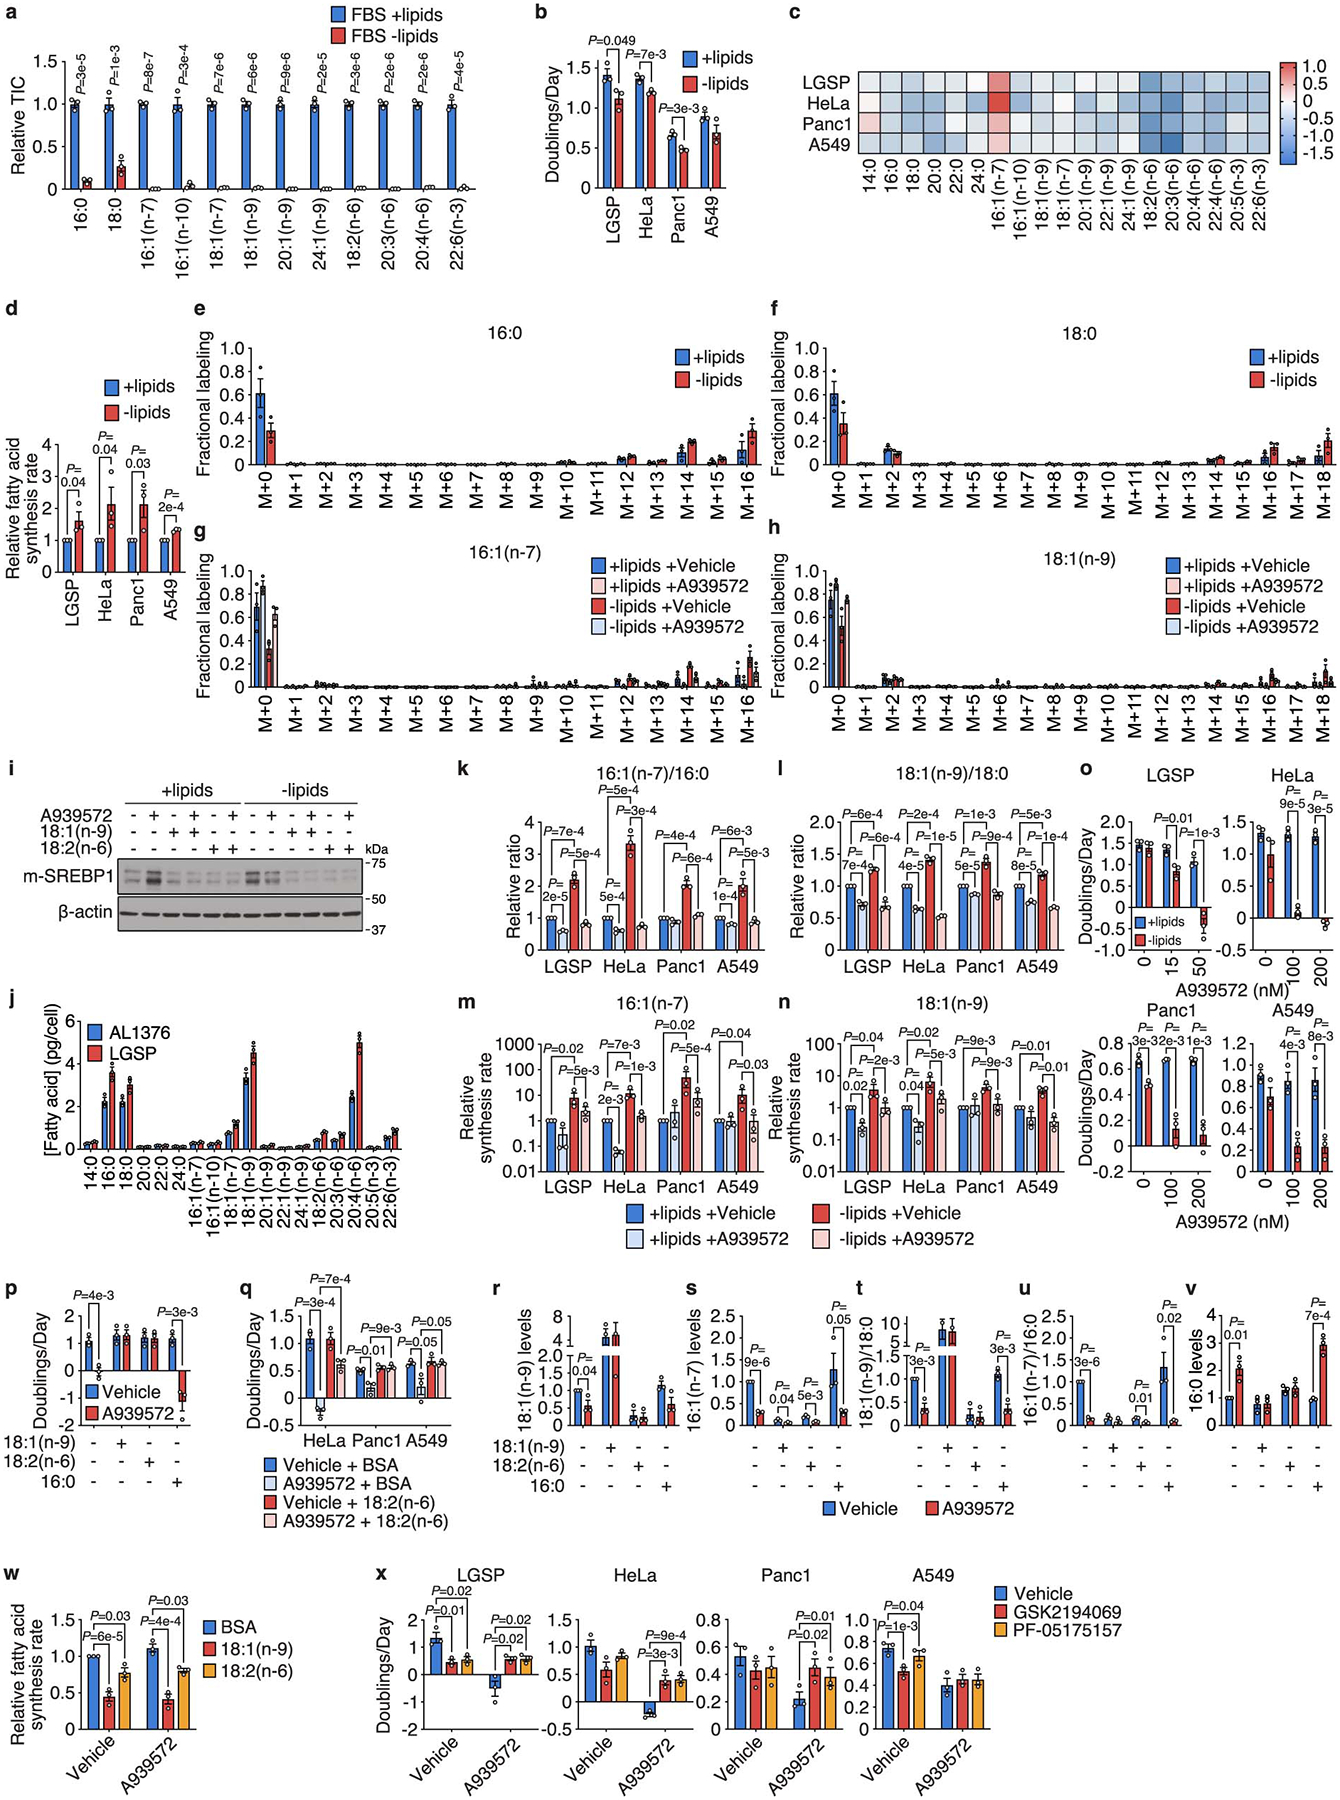
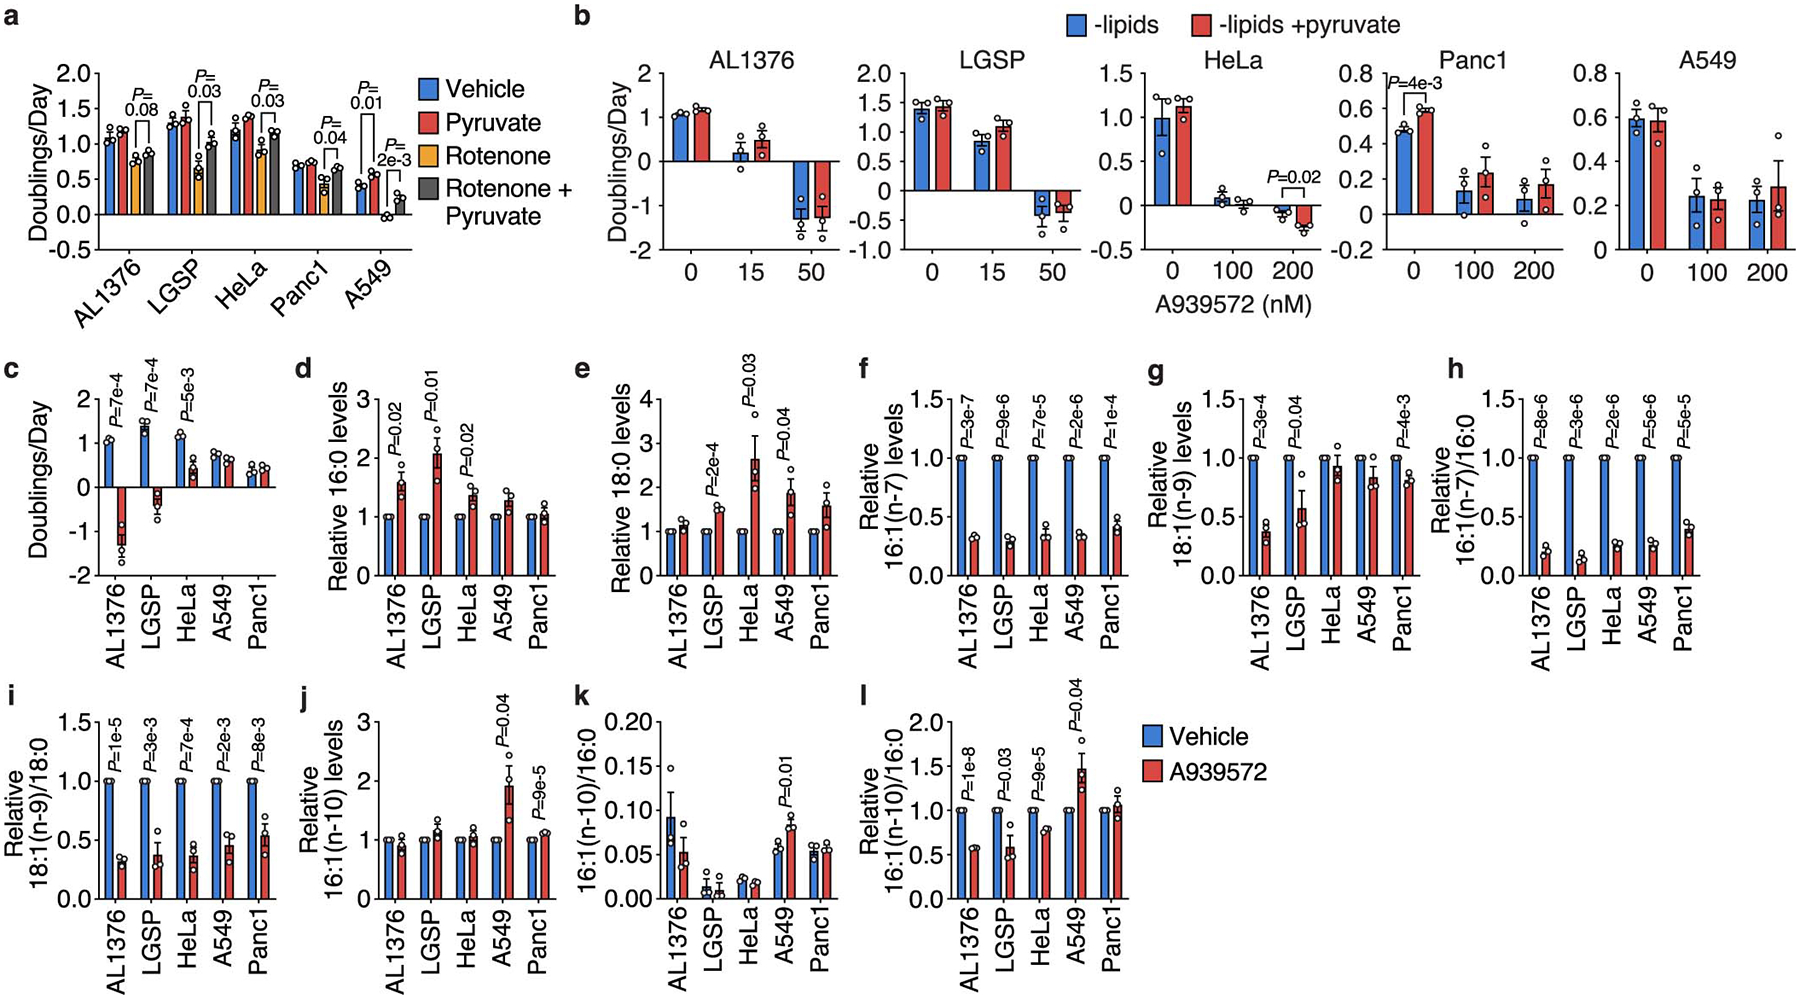
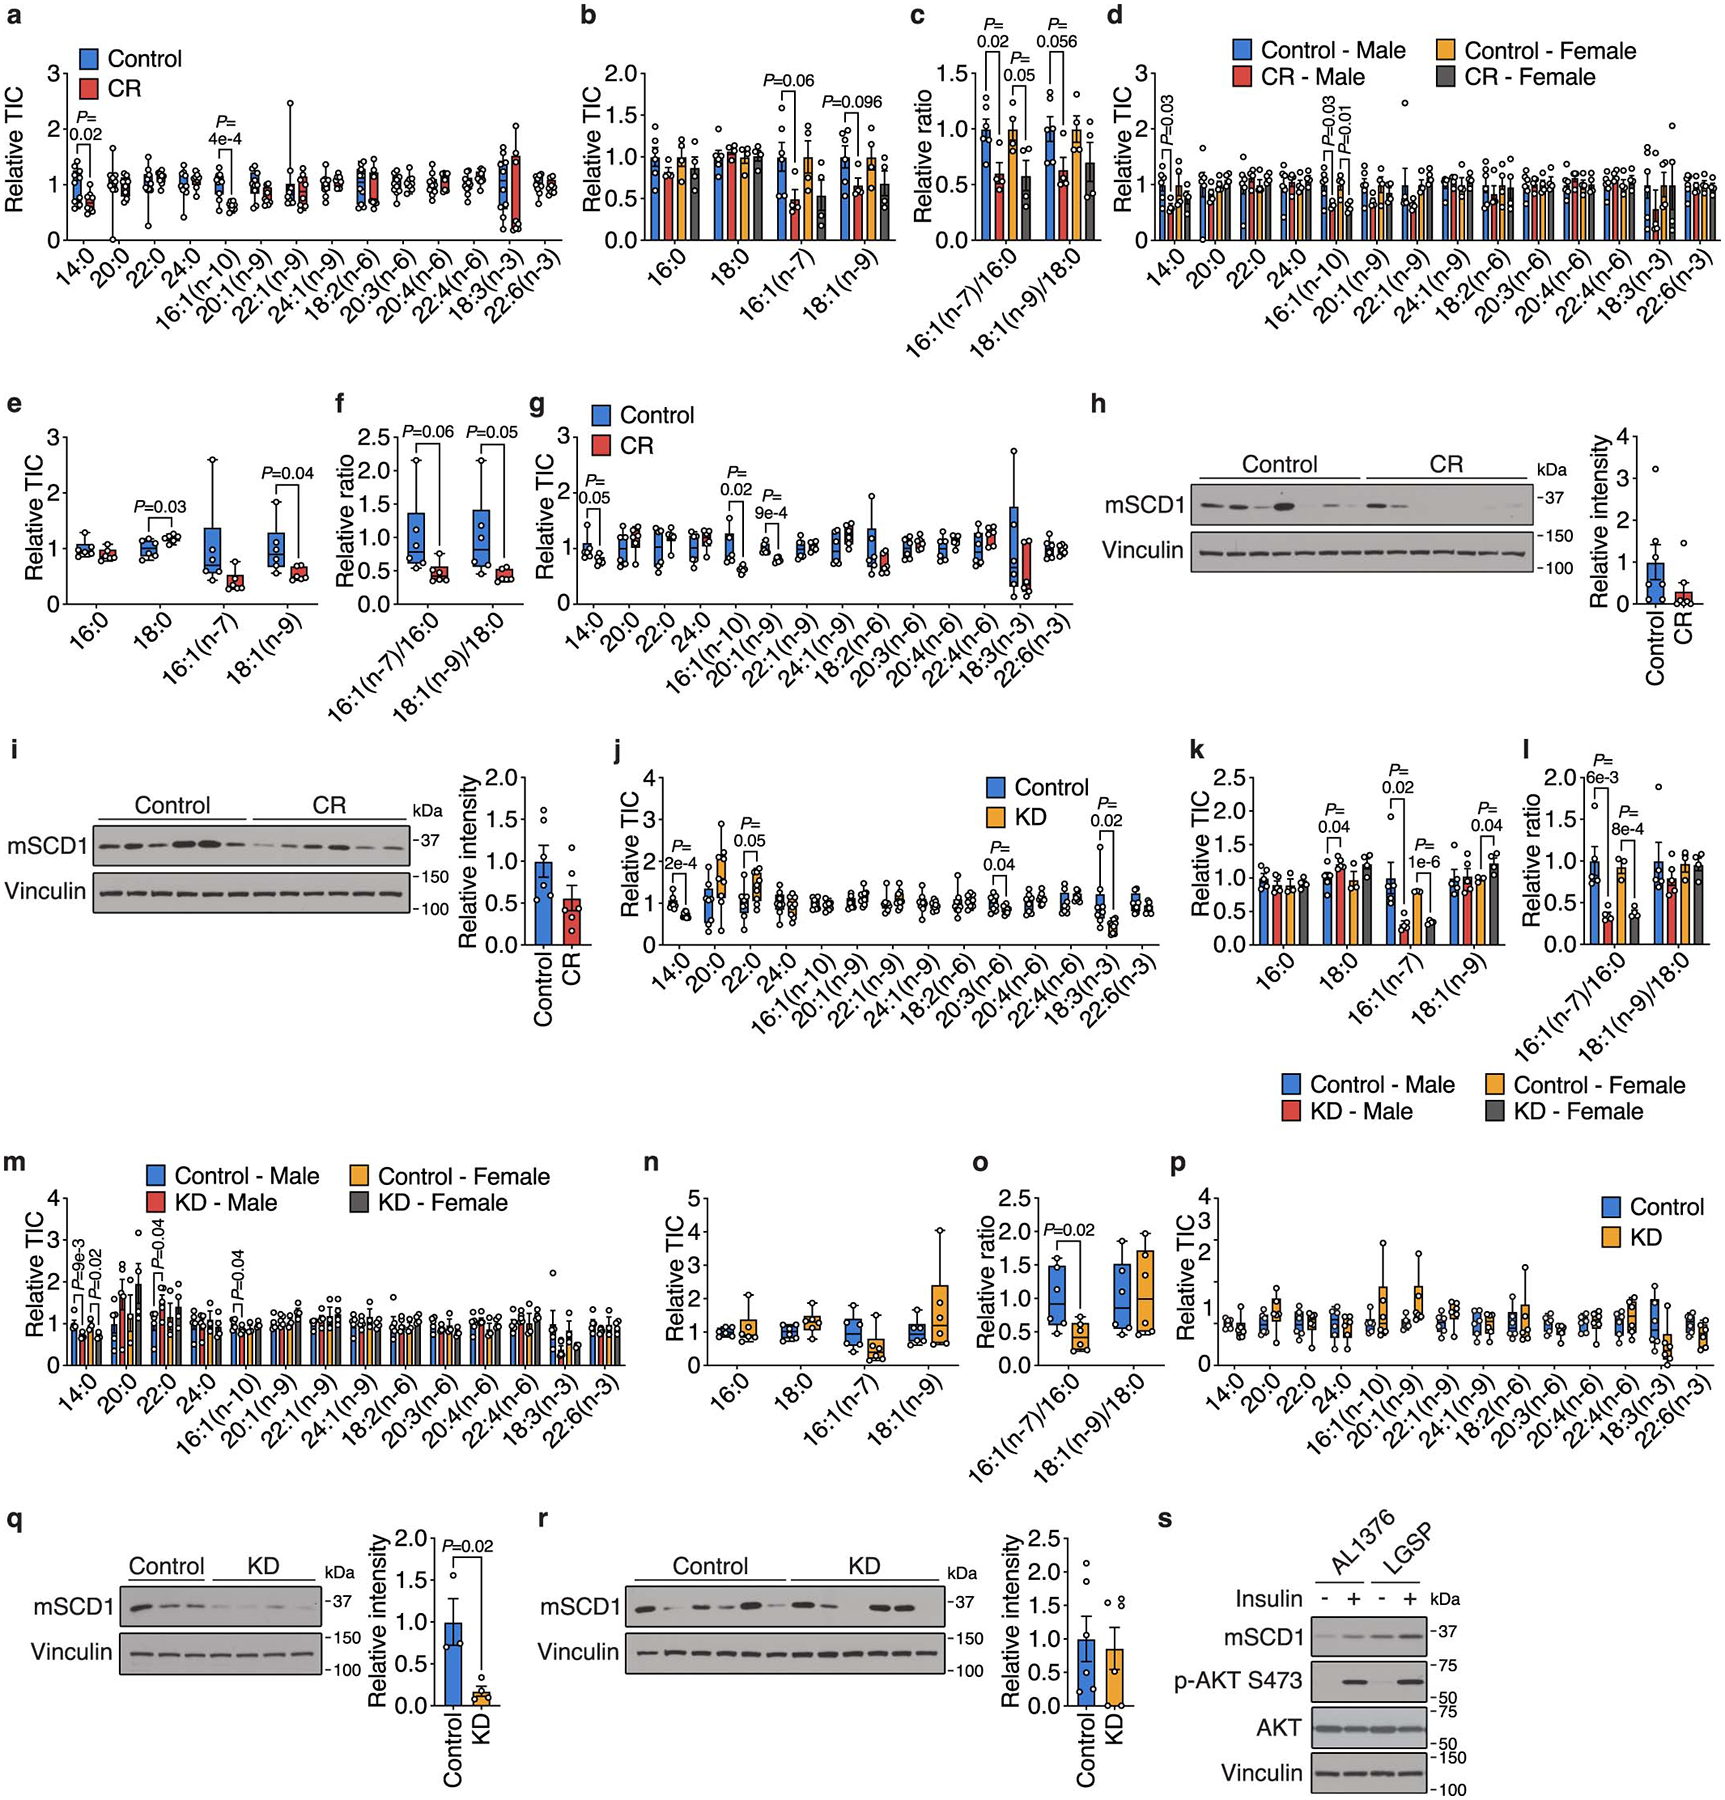
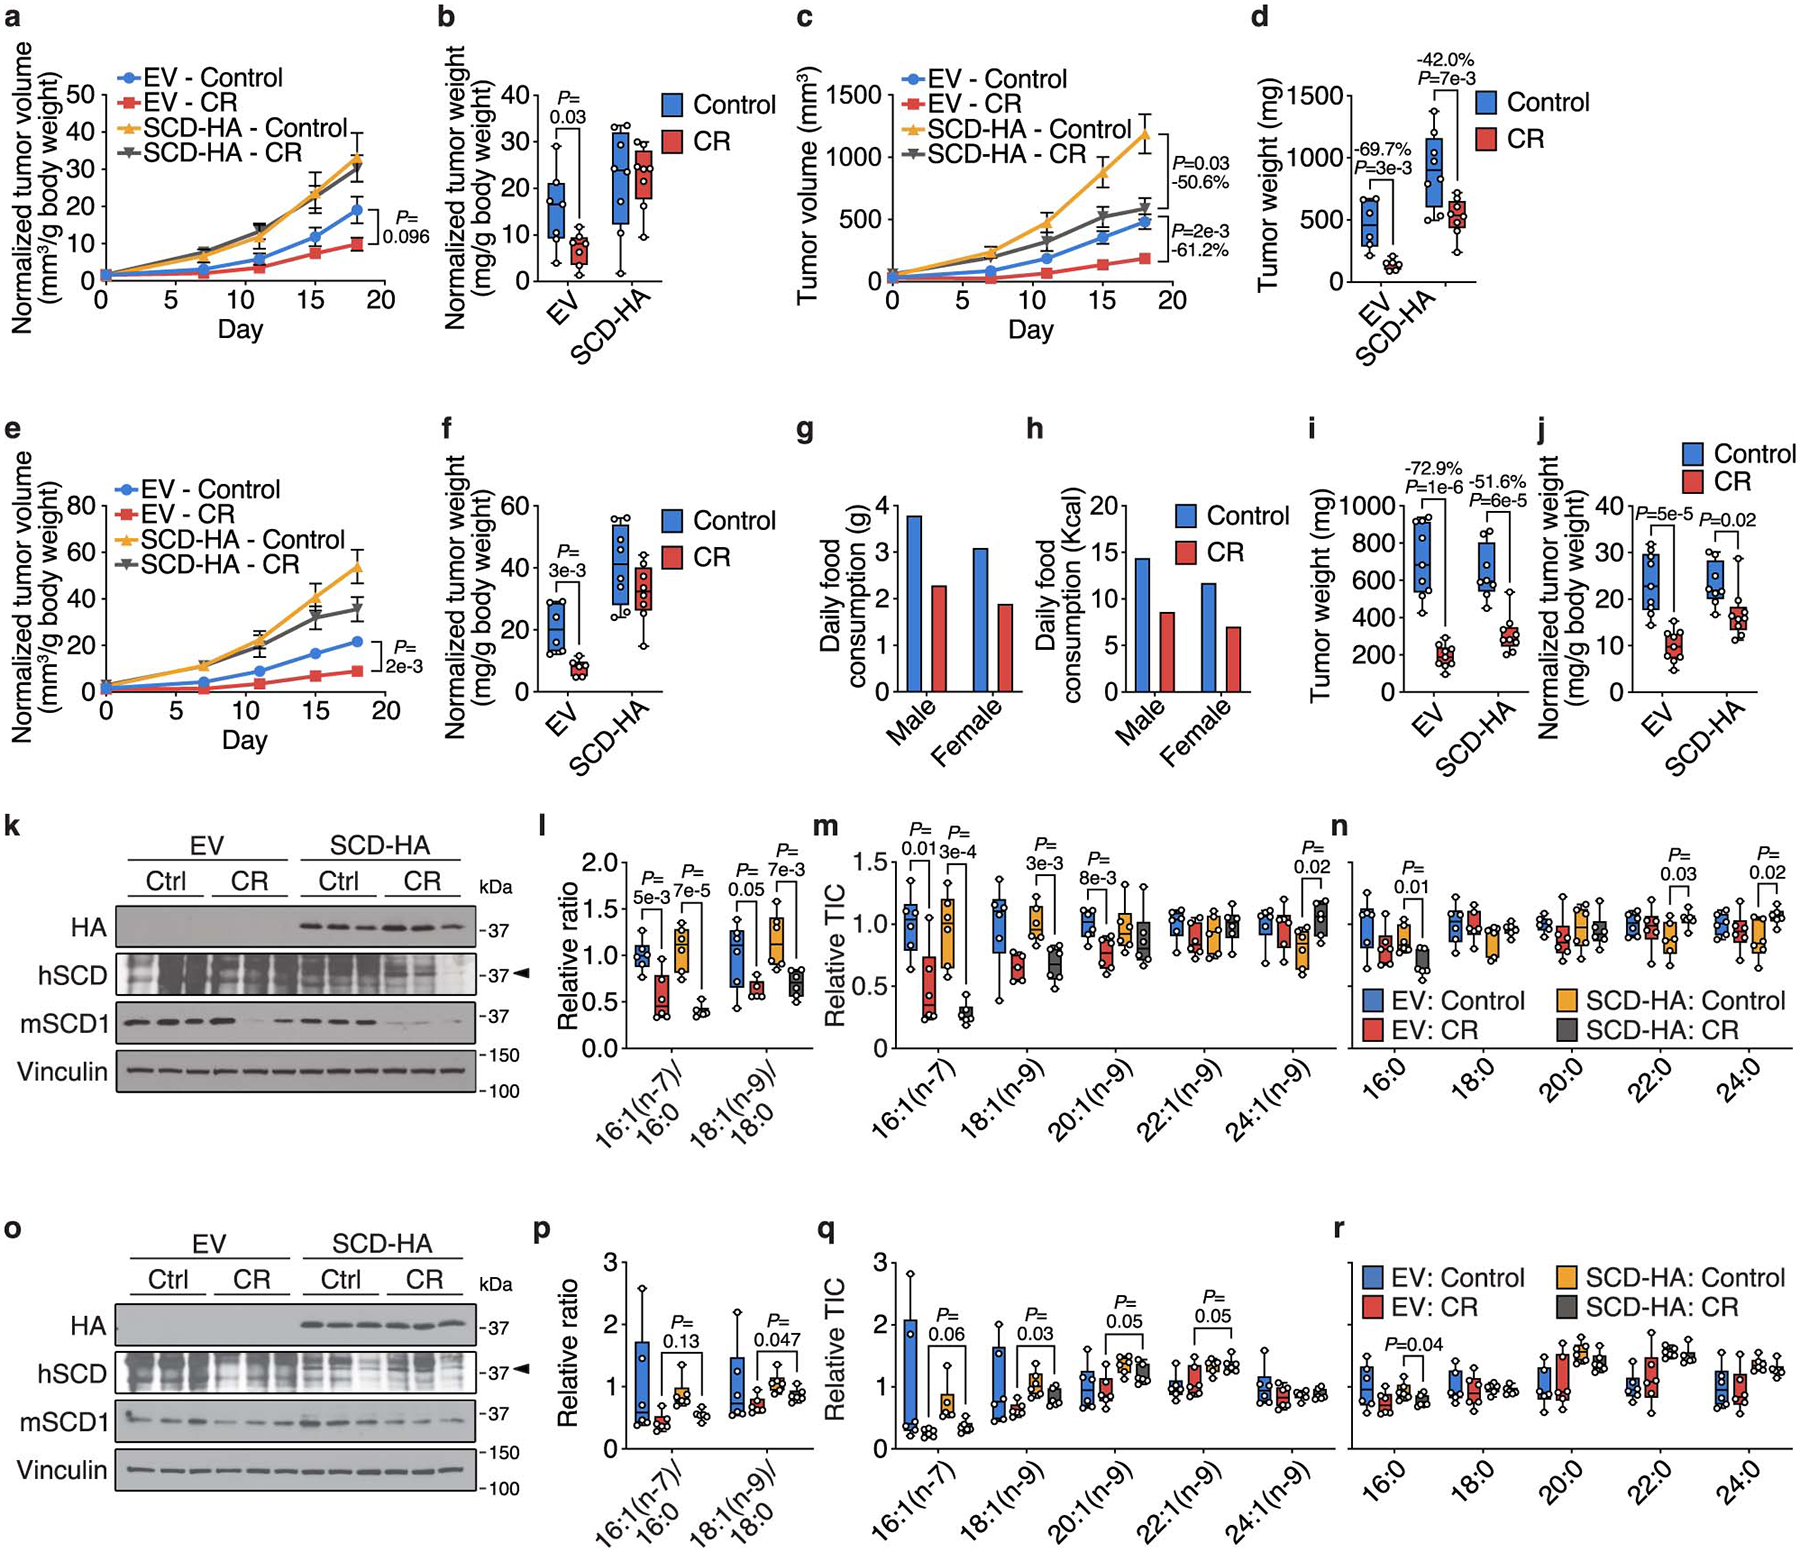
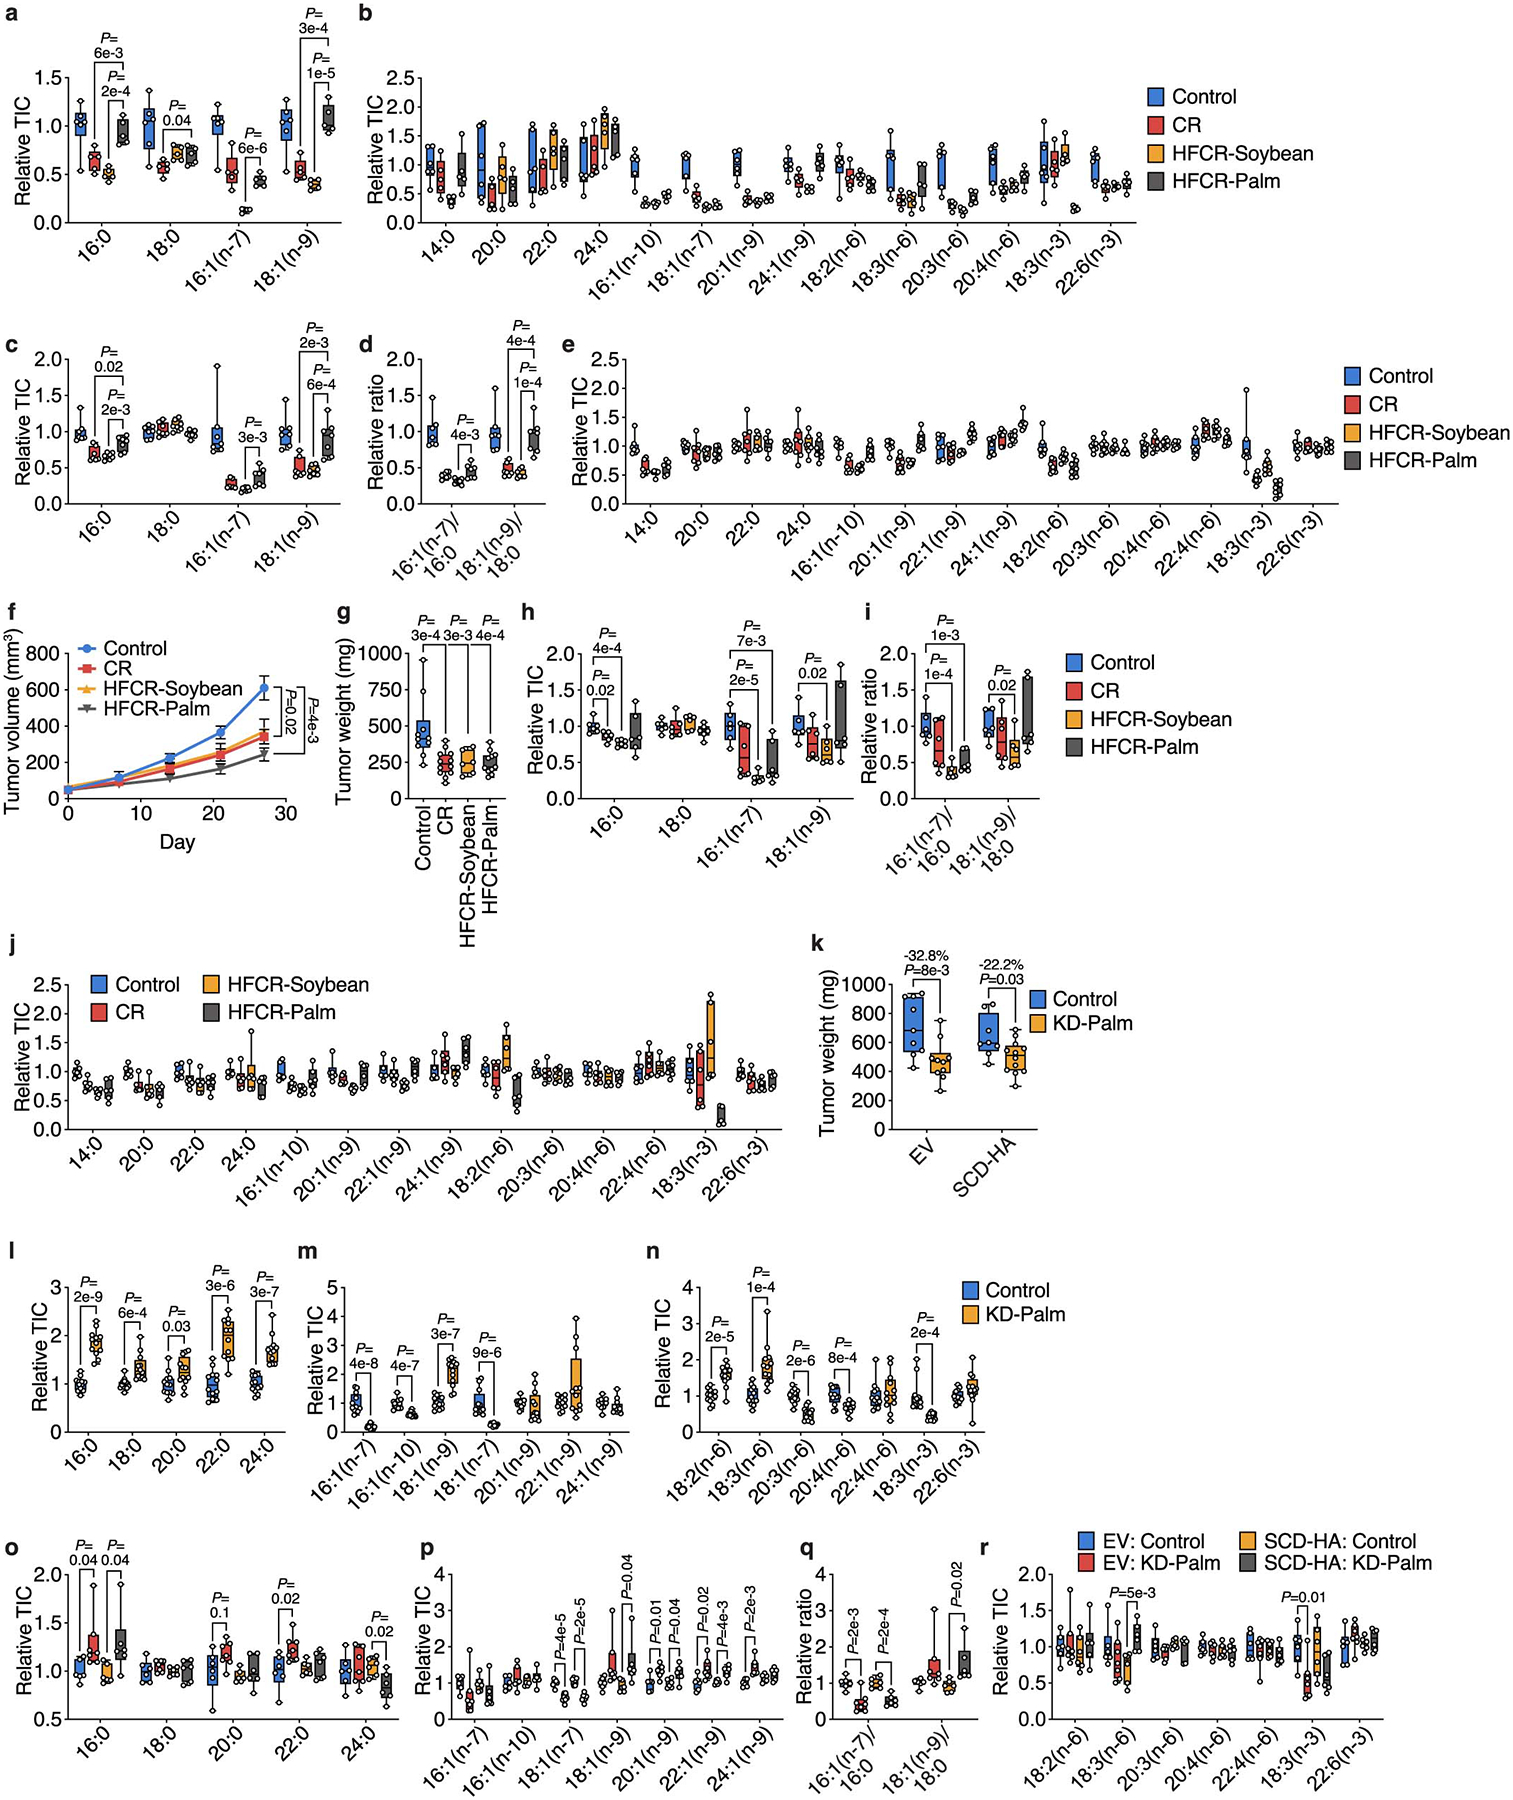
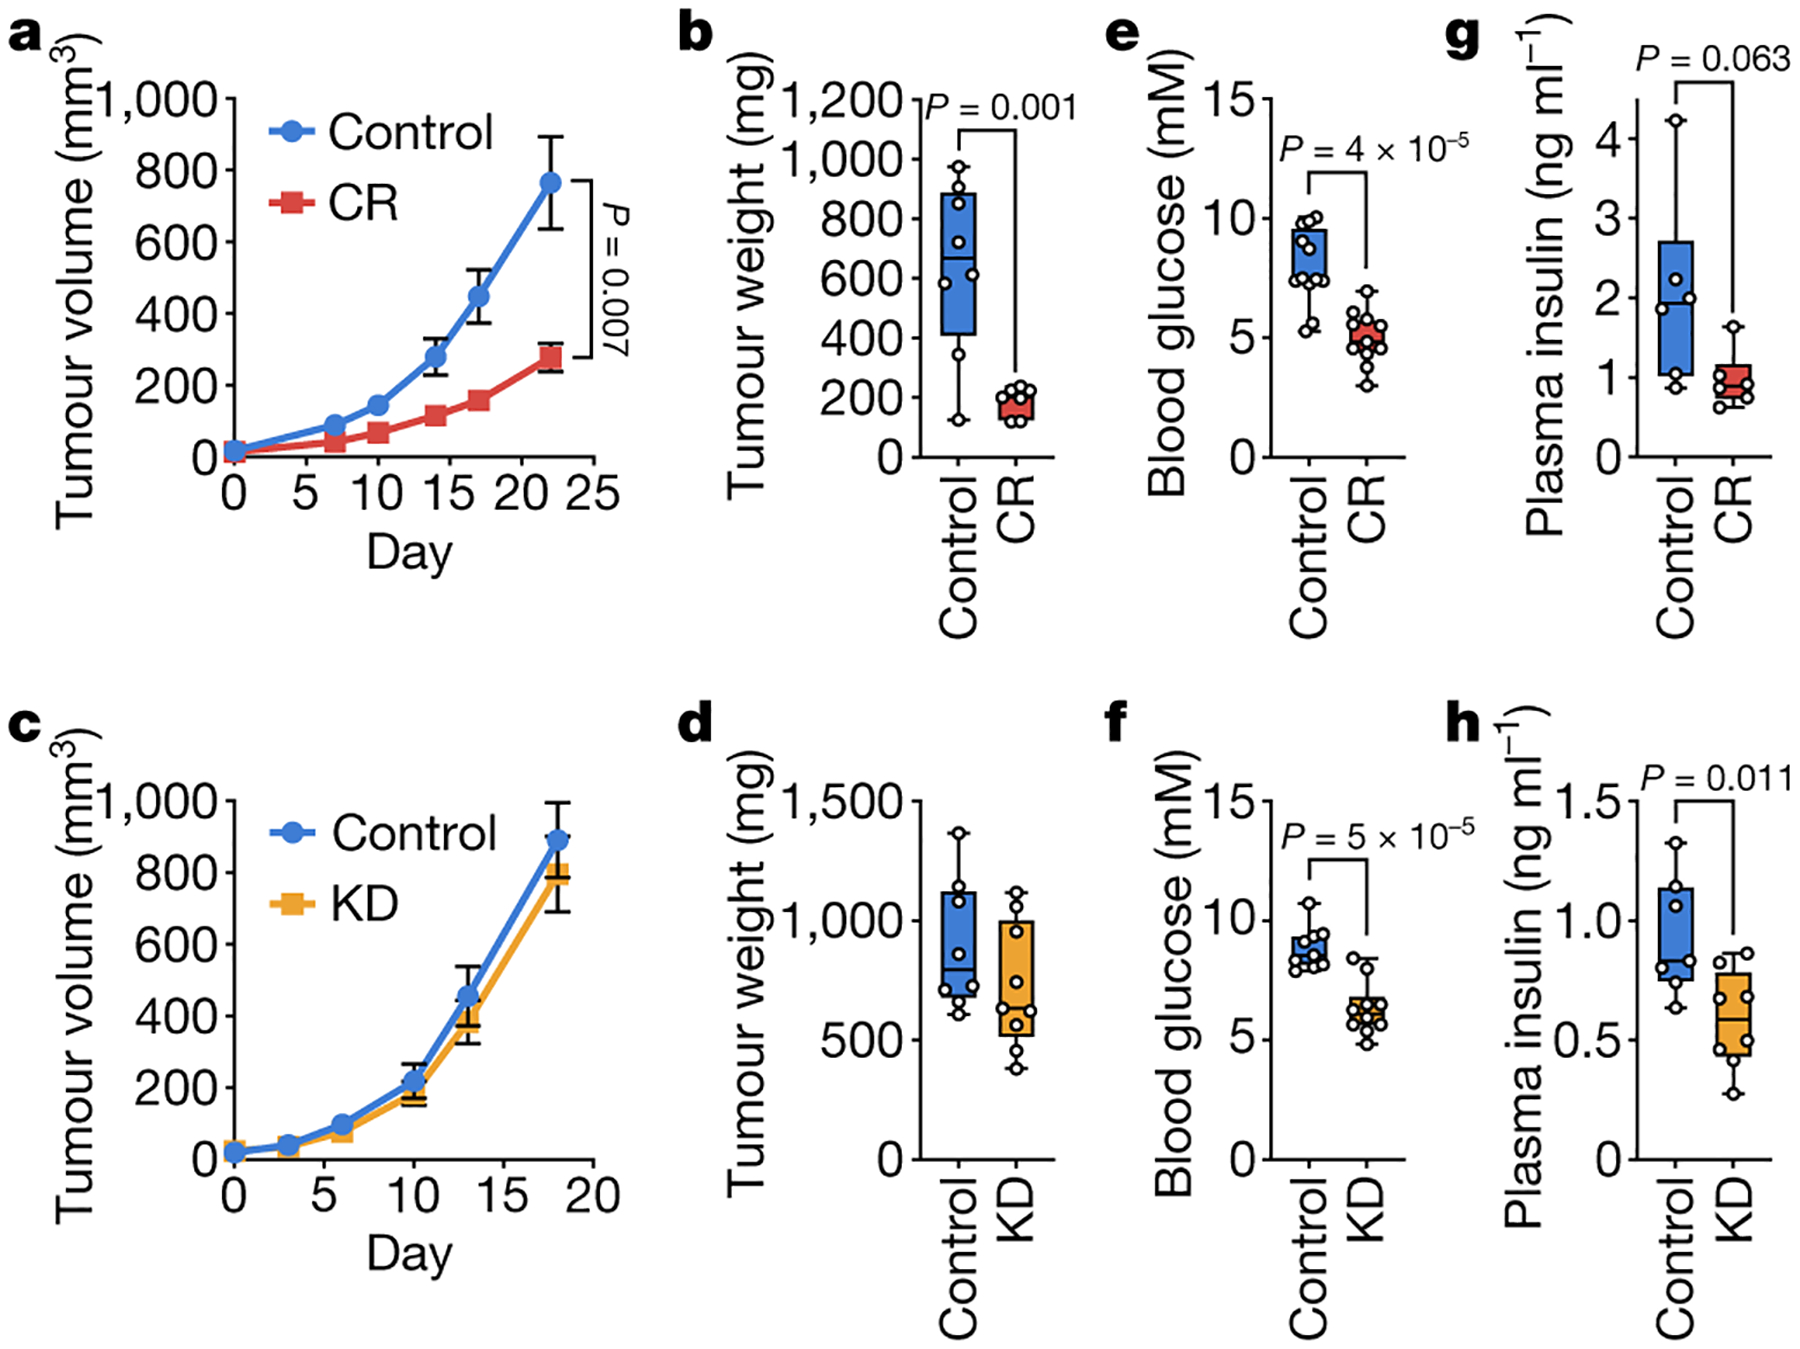
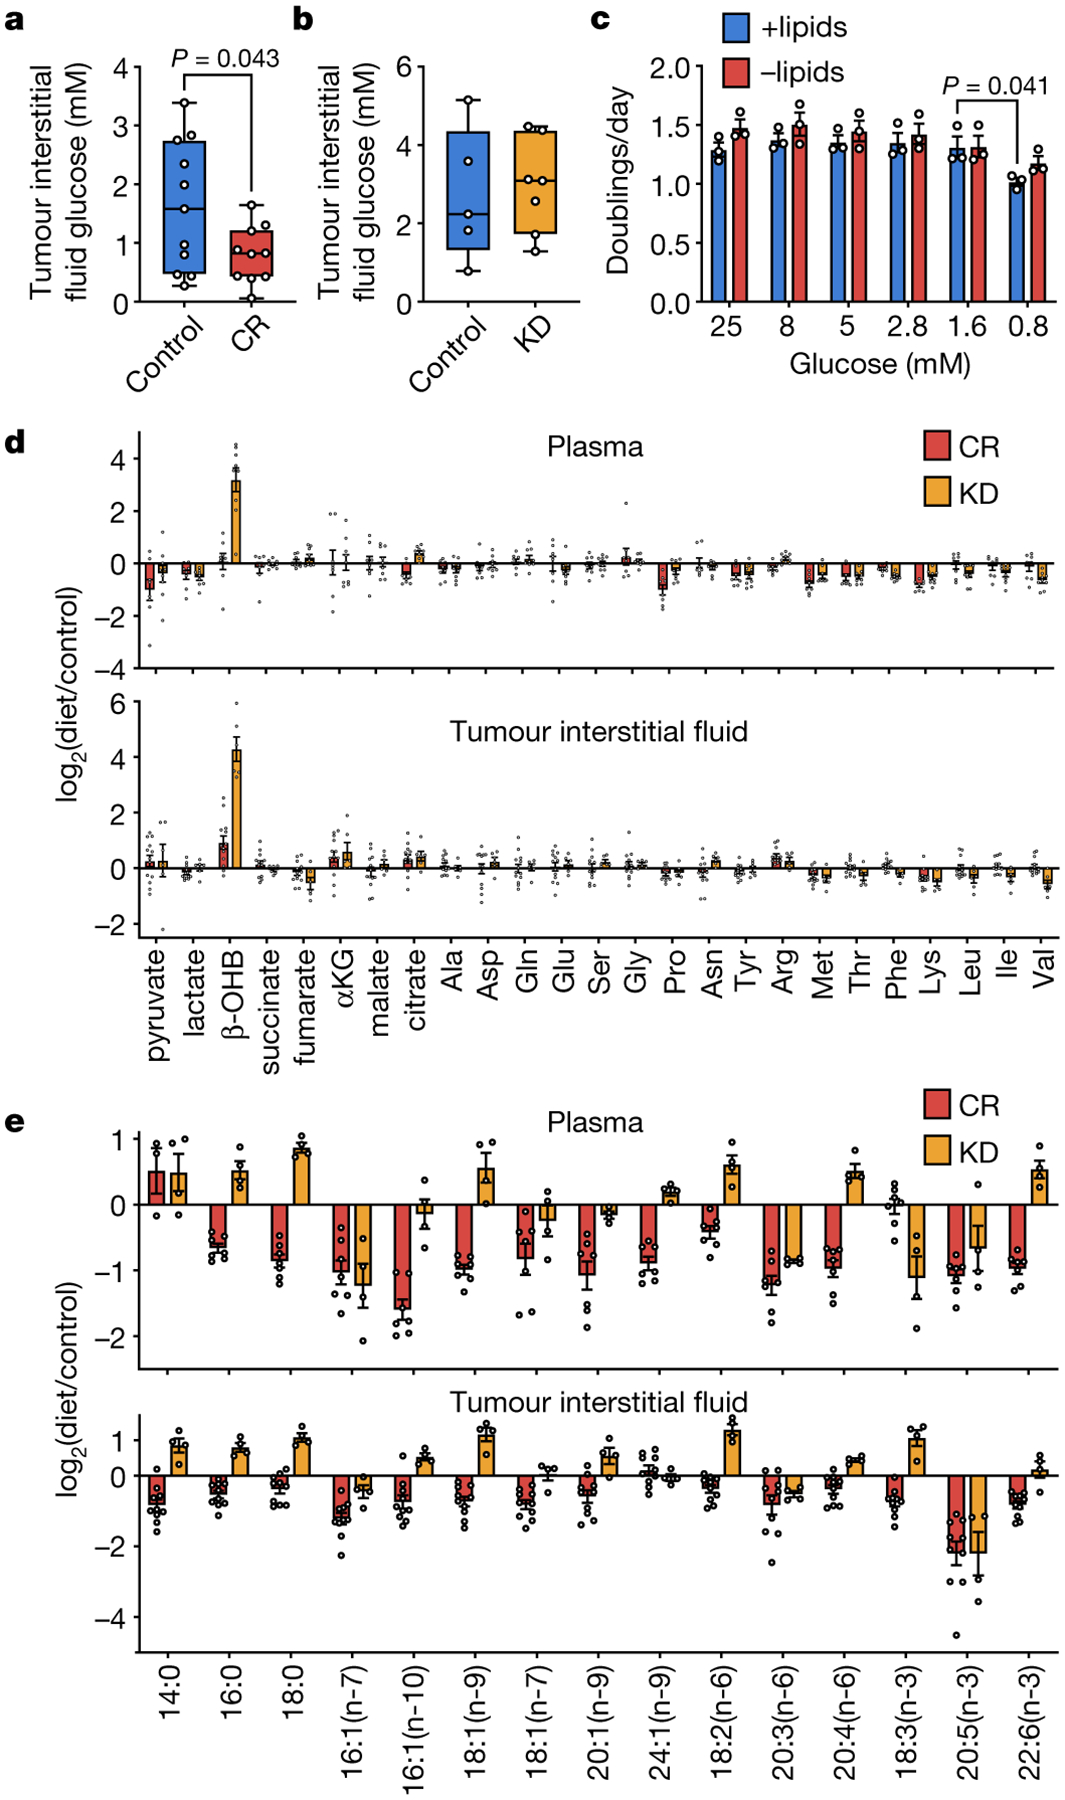
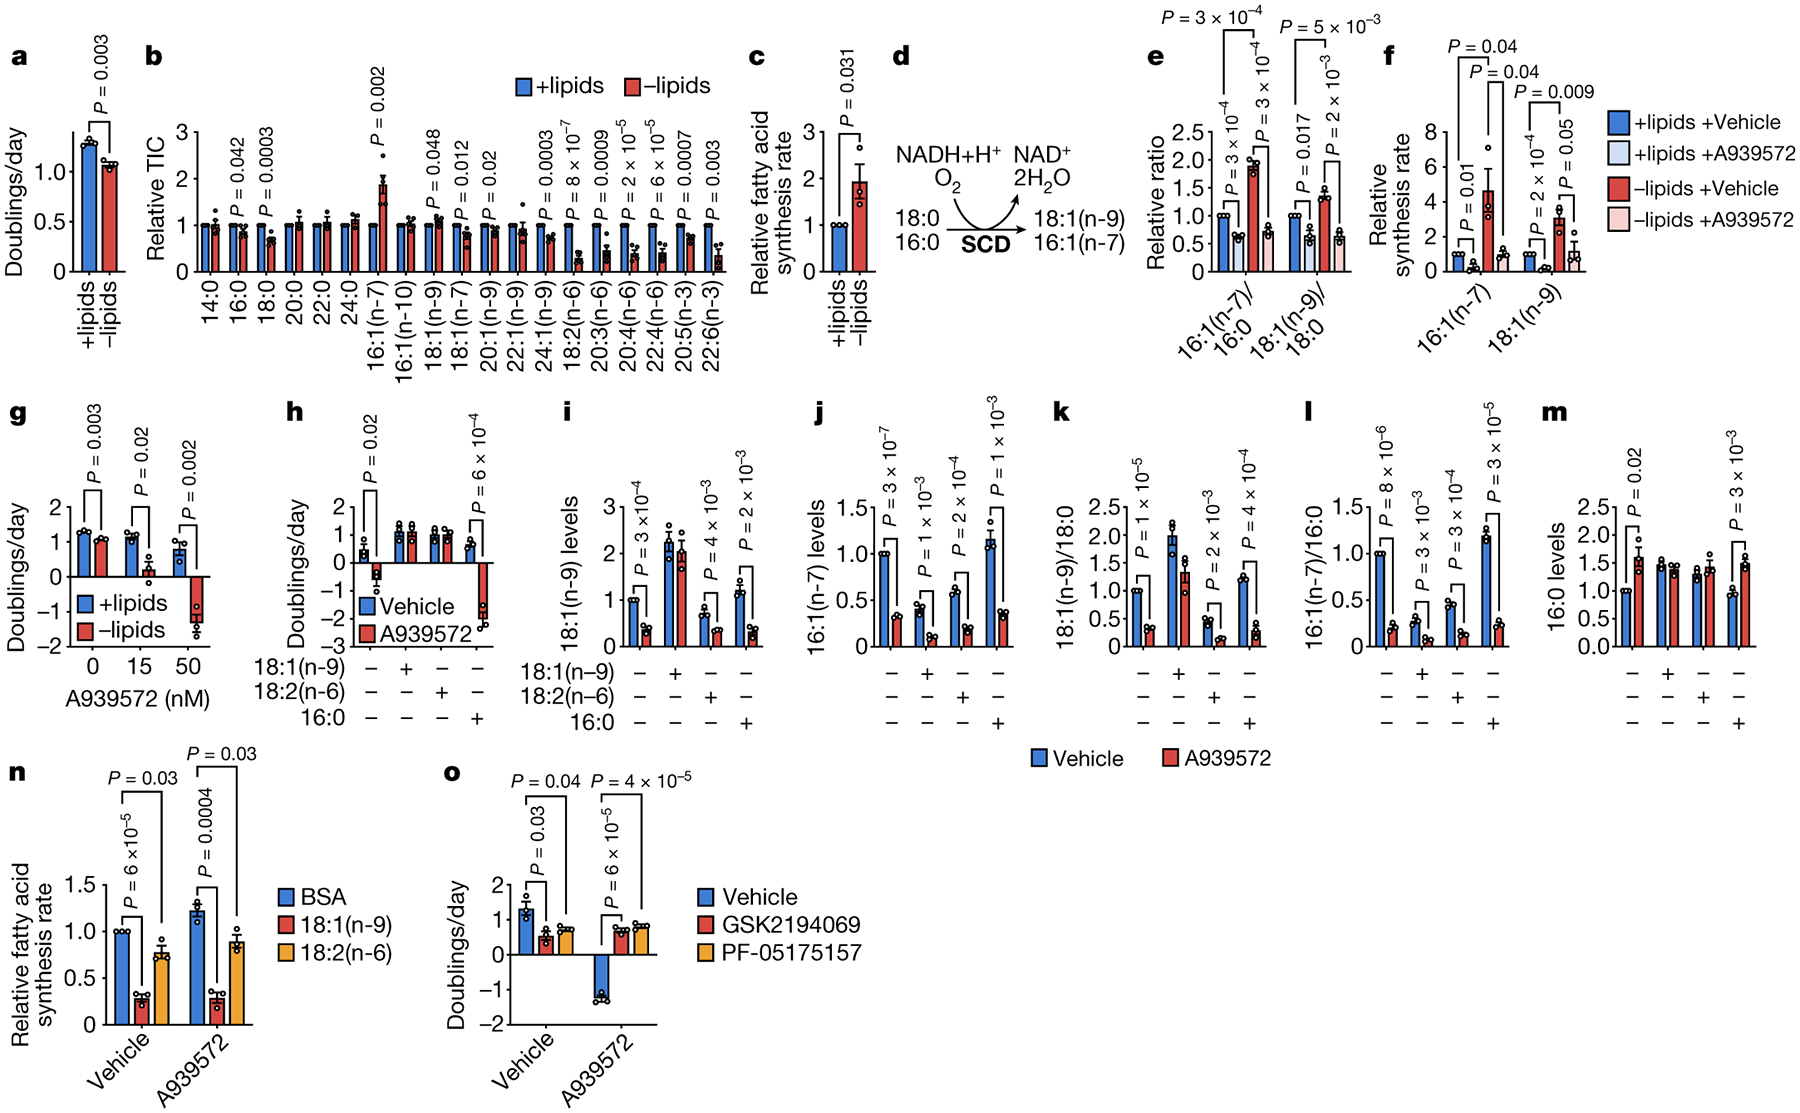
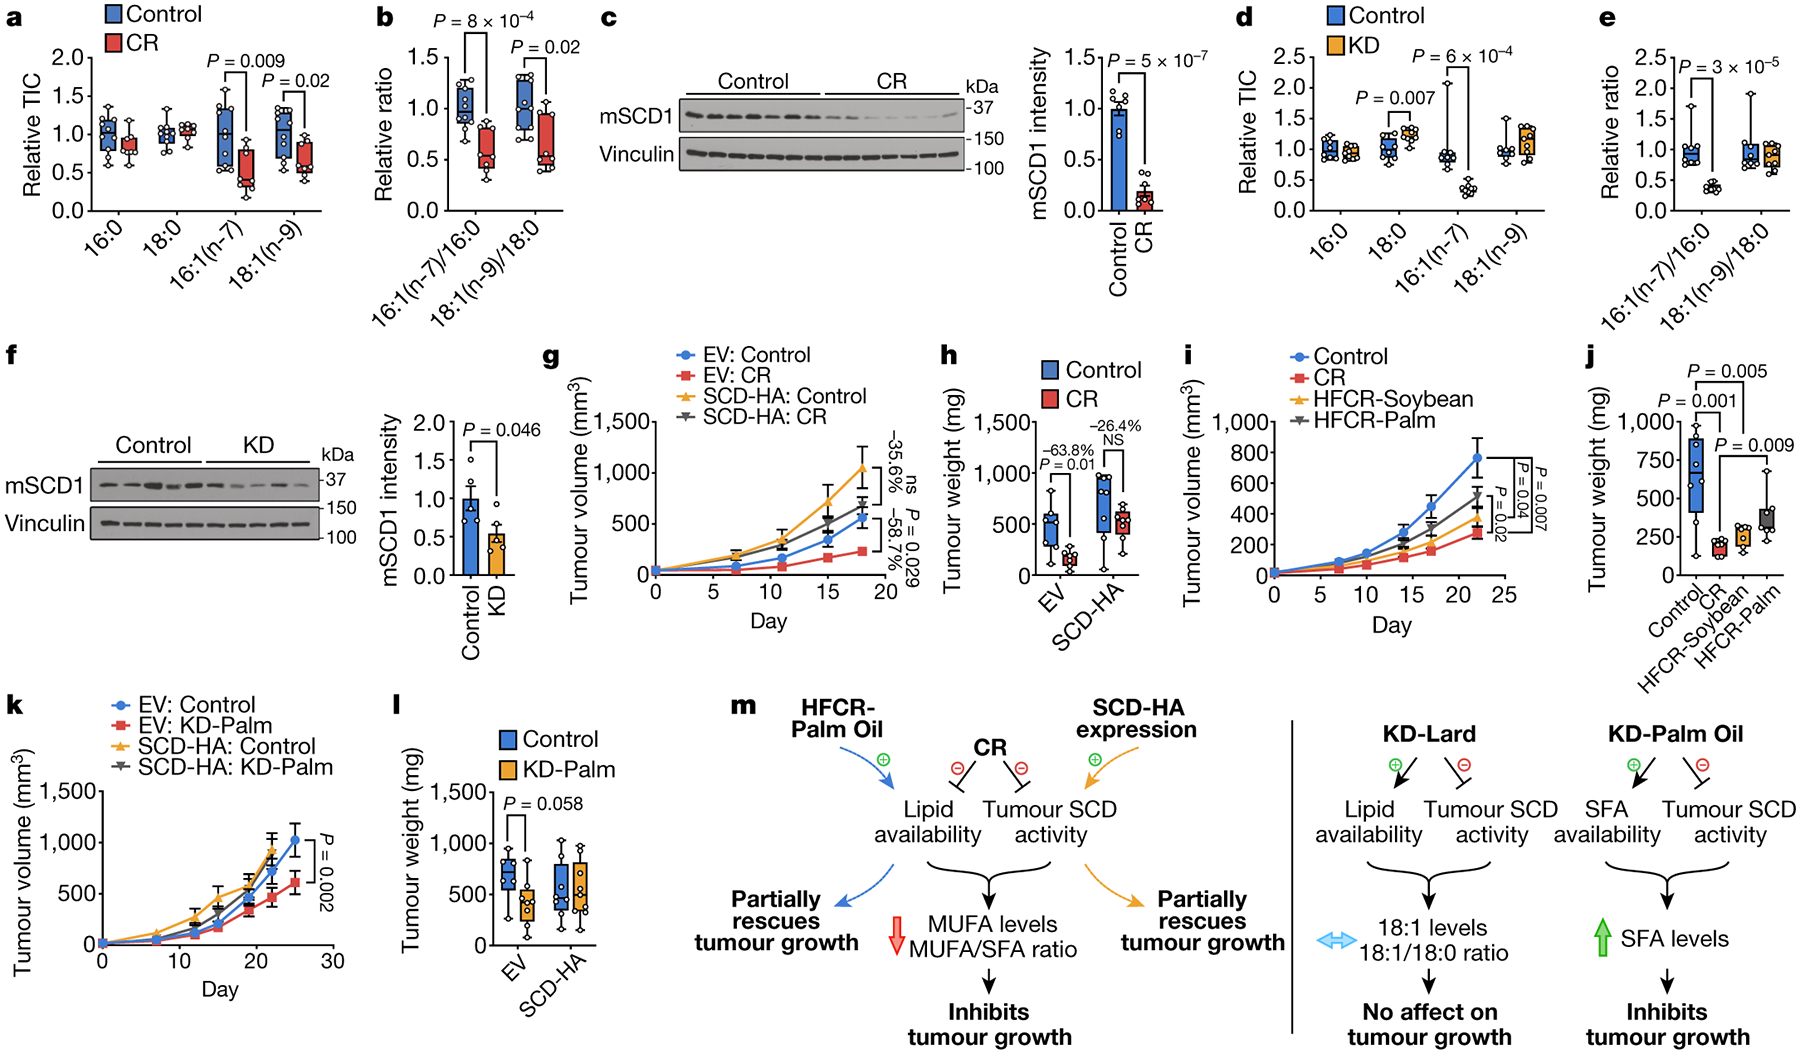
Dietary interventions can change metabolite levels in the tumour microenvironment, which might then affect cancer cell metabolism to alter tumour growth1-5. Although caloric restriction (CR) and a ketogenic diet (KD) are often thought to limit tumour progression by lowering blood glucose and insulin levels6-8, we found that only CR inhibits the growth of select tumour allografts in mice, suggesting that other mechanisms contribute to tumour growth inhibition. A change in nutrient availability observed with CR, but not with KD, is lower lipid levels in the plasma and tumours. Upregulation of stearoyl-CoA desaturase (SCD), which synthesises monounsaturated fatty acids, is required for cancer cells to proliferate in a lipid-depleted environment, and CR also impairs tumour SCD activity to cause an imbalance between unsaturated and saturated fatty acids to slow tumour growth. Enforcing cancer cell SCD expression or raising circulating lipid levels through a higher-fat CR diet confers resistance to the effects of CR. By contrast, although KD also impairs tumour SCD activity, KD-driven increases in lipid availability maintain the unsaturated to saturated fatty acid ratios in tumours, and changing the KD fat composition to increase tumour saturated fatty acid levels cooperates with decreased tumour SCD activity to slow tumour growth. These data suggest that diet-induced mismatches between tumour fatty acid desaturation activity and the availability of specific fatty acid species determine whether low glycaemic diets impair tumour growth.


Figures

Extended Data Figure 1.
Extended Data Figure 1.. Caloric restriction, but not the ketogenic diet, impairs growth of tumor allografts.
a-d, Normalized tumor volumes (a,c) and normalized tumor weights (b,d) of subcutaneous AL1376 PDAC allografts in male mice exposed to CR or a control diet (a,b), or the KD or a control diet (c,d). Tumor volumes and weights normalized to animal body weight are shown. (a,b) Control n = 5 mice, CR n = 4 mice; (c,d) Control n = 5 mice, KD n = 5 mice. e-h, Tumor volumes (e,g) and tumor weights (f,h) of subcutaneous AL1376 PDAC allografts in female mice exposed to CR or a control diet (e,f), or the KD or a control diet (g,h). (e,f) Control n = 8 mice, CR n = 8 mice; (g,h) Control n = 4 mice, KD n = 4 mice. i-l, Tumor volumes (i,k) and tumor weights (j,l) of subcutaneous LGSP non-small cell lung cancer (NSCLC) allografts in male (i,j) and female (k,l) mice exposed to CR or a control diet. (i,j) Control n = 10 mice, CR n = 11 mice; (k,l) Control n = 5 mice, CR n = 5 mice. m-p, Tumor volumes (m,o) and tumor weights (n,p) of subcutaneous LGSP NSCLC allografts in male (m,n) and female (o,p) mice exposed to KD or a control diet. (m,n) Control n = 5 mice, KD n = 5 mice; (o,p) Control n = 3 mice, KD n = 3 mice. Data are presented as box-and-whisker plots displaying median, interquartile range (boxes), and minima and maxima (whiskers) (b,d,f,h,j,l,n,p) or mean ± SEM (a,c,e,g,i,k,m,o). Comparisons were made using a two-tailed Student’s t-test (b,d,f,h,j,l,n,p) or two-way repeated measures analysis of variance (ANOVA) (a,c,e,g,i,k,m,o).
Extended Data Figure 2.
Extended Data Figure 2.. Caloric restriction and the ketogenic diet have distinct effects on whole-body physiology.
a, b, Daily food consumption by weight (a) and daily caloric consumption (b) of the control diet and CR by male and female mice. c, Body weights of male and female mice exposed to CR or a control diet. Male Control n = 10, Male CR n = 11, Female Control n = 5, Female CR n = 5. d, e, Ki67 (d) and cleaved caspase 3 (CC3) (e) immunohistochemical staining in subcutaneous AL1376 tumors from mice exposed to a control or CR diet. n = 3 tumors per group. 5–8 independent fields from each tumor were quantified: Control n = 23, CR n = 18 (d); n = 17 per group (e). f, Weights of gastrocnemius muscle (Gastroc) and white adipose tissue (WAT) in male and female mice exposed to CR or a control diet. Tissue weights normalized to animal body weight are shown. n = 5 per group. g-i, Plasma glucagon (g), FGF21 (h), and corticosterone (i) levels in male mice exposed to CR or a control diet. Control n = 6, CR n = 5. j, k, Daily food consumption by weight (j) and daily caloric consumption (k) of the control diet and KD by male and female mice. Male Control n = 5, Male KD n = 5, Female Control n = 4, Female KD n = 5. l, Body weights of male and female mice exposed to KD or a control diet. Male Control n = 5, Male KD n = 5, Female Control n = 3, Female KD n = 3. m, n, Ki67 (m) and CC3 (n) immunohistochemical staining in subcutaneous AL1376 tumors from mice exposed to a control diet or the KD. n = 3 tumors per group. 5–8 independent fields from each tumor were quantified: n = 24 per group (m, n). o, Weights of Gastroc and WAT in male and female mice exposed to KD or a control diet. Tissue weights normalized to animal body weight are shown. Male Control n = 5, Male KD n = 5, Female Control n = 6, Female KD n = 6. p-r, Plasma glucagon (p), FGF21 (q), and corticosterone (r) levels in male mice exposed to KD or a control diet. (p) n = 4 per group; (q-r) n = 5 per group. Data are presented as mean ± SEM (a-c,f-l,o-r) or box-and-whisker plots displaying median, interquartile range (boxes), and minima and maxima (whiskers) (d,e,m,n). Comparisons were made using a two-tailed Student’s t-test.
Extended Data Figure 3.
Extended Data Figure 3.. β-OHB is metabolized by PDAC cells.
a, Concentrations of β-OHB in plasma and tumor interstitial fluid (TIF) from mice implanted with subcutaneous AL1376 tumors exposed to a control diet, CR, or the KD. Plasma Control (CR cohort) n = 8, Plasma CR n = 8, Plasma Control (KD cohort) n = 10, Plasma KD n = 9, TIF Control (CR cohort) n = 16, TIF CR n = 13, TIF Control (KD cohort) n = 5, TIF KD n = 6. b, Doubling times of AL1376 cells cultured in media with or without 5 mM β-OHB. c, Fractional labeling of [M+2] TCA cycle metabolites from AL1376 cells cultured in the presence of 5 mM [U-13C]-β-OHB for 24 h. d, Mass isotopologue distribution of labeled palmitate from AL1376 cells cultured in the presence of 5 mM [U-13C]-β-OHB for 24 h. e, f, The indicated fatty acid levels (e) and MUFA/SFA ratios (f) measured in AL1376 cells cultured in media with or without 5 mM β-OHB for 24 h. Data are presented as box-and-whisker plots displaying median, interquartile range (boxes), and minima and maxima (whiskers) (a) or mean ± SEM (b-f). Unless otherwise indicated, n = 3 biologically independent replicates, and comparisons were made using a two-tailed Student’s t-test.
Extended Data Figure 4.
Extended Data Figure 4.. Increased stearoyl-CoA desaturase activity is required for cancer cells to adapt to exogenous lipid limitation.
a, Levels of the indicated fatty acids in lipidated and de-lipidated fetal bovine serum (FBS). b, Doubling times of the specified cells cultured in media containing lipidated versus de-lipidated serum. c, Fold changes in levels of the indicated fatty acids in cells cultured in de-lipidated versus lipidated media for 24 h. d, Relative fatty acid synthesis rates in the indicated cells cultured in lipidated versus de-lipidated media. A one-tailed Student’s t-test was used for comparison between groups. e, f, Representative mass isotopologue distributions (MIDs) of 16:0 (e) and 18:0 (f) from AL1376 cells labeled with [U-13C]-glucose and [U-13C]-glutamine for 24 h in lipidated versus de-lipidated media. g, h, Representative MIDs of 16:1(n-7) (g) and 18:1(n-9) (h) from AL1376 cells labeled with [U-13C]-glucose and [U-13C]-glutamine for 24 h in lipidated versus de-lipidated media containing 50 nM A939572. MIDs above M+12 are predominantly observed, consistent with a majority of lipogenic acetyl-CoA being derived from glucose and glutamine. i, Immunoblot for the mature activated form of SREBP1 (m-SREBP1) and β-actin in lysates from AL1376 cells cultured in lipidated versus de-lipidated media for 24 h, with or without 50 nM A939572, 50 μM 18:1(n-9), or 50 μM 18:2(n-6). Data is representative of three biologically independent experiments. j, Absolute fatty acid concentrations in AL1376 and LGSP cells cultured in lipidated media. k, l, Ratios of 16:1(n-7)/16:0 (k) and 18:1(n-9)/18:0 (l) in cells cultured in lipidated versus de-lipidated media with or without the SCD inhibitor A939572 (LGSP: 50 nM; HeLa, Panc1, A549: 200 nM) for 24 h. m, n, 16:1(n-7) (m) and 18:1(n-9) (n) synthesis rates in cells cultured in lipidated versus de-lipidated media with or without A939572 (LGSP: 50 nM; HeLa, Panc1, A549: 200 nM) for 24 h as indicated. A one-tailed ratio paired t-test was used for comparison between groups. o, Doubling times of the specified cells cultured in lipidated versus de-lipidated media with the indicated concentrations of A939572. p, Doubling times of LGSP cells cultured in de-lipidated media with or without 50 nM A939572, BSA, 100 μM 18:1(n-9), 100 μM 18:2(n-6), or 15 μM 16:0. q, Doubling times of cells cultured in de-lipidated media containing 200 nM A939572, BSA, or 25 μM 18:2(n-6). r-v, 18:1(n-9) (r), 16:1(n-7) (s), 18:1(n-9)/18:0 (t), 16:1(n-7)/16:0 (u), and 16:0 (v) levels in LGSP cells cultured in de-lipidated media with or without 50 nM A939572, BSA, 100 μM 18:1(n-9), 100 μM 18:2(n-6), or 15 μM 16:0 for 48 h. w, Relative fatty acid synthesis rates in LGSP cells cultured in de-lipidated media containing 50 nM A939572, BSA, 100 μM 18:1(n-9), or 100 μM 18:2(n-6). x, Doubling times of cells cultured in de-lipidated media containing A939572 (LGSP: 50 nM; HeLa, Panc1, A549: 200 nM), the FASN inhibitor GSK2194069 (LGSP: 0.3 μM; HeLa, A549: 0.015 μM; Panc1: 0.05 μM), or the ACC inhibitor PF-05175157 (LGSP: 10 μM; HeLa: 0.3 μM; Panc1: 1 μM; A549: 0.5 μM). A paired two-tailed Student’s t-test was used for comparison between groups in Panc1 and A549 cells. All data are presented as mean ± SEM; unless otherwise indicated, n = 3 biologically independent replicates, and a two-tailed Student’s t-test was used for comparison between groups unless otherwise noted above.
Extended Data Figure 5.
Extended Data Figure 5.. Determining whether SCD inhibition affects cancer cell proliferation via NAD+ limitation or changes to cellular fatty acid levels.
a, Doubling times of the indicated cell lines cultured in de-lipidated media with or without 1 mM pyruvate and rotenone (AL1376: 400 nM; LGSP, A549: 100 nM; HeLa, Panc1: 50 nM). b, Doubling times of the indicated cell lines cultured in de-lipidated media containing the indicated concentrations of the SCD inhibitor A939572 and 1 mM pyruvate. c, Doubling times of the indicated cell lines cultured in de-lipidated media with or without 50 nM A939572. d-i, Relative levels of 16:0 (d), 18:0 (e), 16:1(n-7) (f), 18:1(n-9) (g), 16:1(n-7)/16:0 (h), and 18:1(n-9)/18:0 (i) in the indicated cell lines cultured in de-lipidated media with or without 50 nM A939572. j-l, Relative levels of 16:1(n-10) (j), normalized levels of 16:1(n-10)/16:0 (k), and relative levels of 16:1(n-10)/16:0 (l) in the indicated cell lines cultured in de-lipidated media with or without 50 nM A939572. All data are presented as mean ± SEM; n = 3 biologically independent replicates. A two-tailed Student’s t-test was used for comparison between groups.
Extended Data Figure 6.
Extended Data Figure 6.. Caloric restriction and the ketogenic diet alter fatty acid composition and SCD activity in tumors.
a, The indicated fatty acid levels measured in subcutaneous AL1376 tumors from mice exposed to a control or CR diet. Control n = 10, CR n = 8. b-d, The indicated fatty acid levels (b,d) and MUFA/SFA ratios (c) measured in subcutaneous AL1376 tumors from male or female mice exposed to a control or CR diet. Male Control n = 6, Male CR n = 4, Female Control n = 4, Female CR n = 4. e-g, The indicated fatty acid levels (e,g) and MUFA/SFA ratios (f) measured in subcutaneous LGSP tumors from male mice exposed to a control or CR diet. Control n = 6, CR n = 6. h-i, Immunoblot and quantification for mouse Scd1 (mSCD1) and vinculin in subcutaneous AL1376 tumors from female mice (h, n = 7 per group) or subcutaneous LGSP tumors from male mice (i, n = 6 per group) exposed to a control or CR diet. j, The indicated fatty acid levels measured in subcutaneous AL1376 tumors from mice exposed to a control diet or KD. Control n = 8, KD n = 9. k-m, The indicated fatty acid levels (k,m) and MUFA/SFA ratios (l) measured in subcutaneous AL1376 tumors from male or female mice exposed to a control diet or KD. Male Control n = 5, Male KD n = 5, Female Control n = 3, Female KD n = 4. n-p, The indicated fatty acid levels (n,p) and MUFA/SFA ratios (o) measured in subcutaneous LGSP tumors from male mice exposed to a control diet or KD. Control n = 6, KD n = 6. q-r, Immunoblot and quantification for mSCD1 and vinculin in subcutaneous AL1376 tumors from female mice (q, Control n = 3, KD n = 4) or subcutaneous LGSP tumors from male mice (r, n = 6 per group) exposed to a control diet or KD. s, AL1376 and LGSP cells were serum-starved in the presence of 1% Lipid Mixture for 16 h followed by insulin stimulation (100 nM) for 3 h. Lysates were immunobloted for mSCD1, p-AKT S473, AKT, and vinculin. Data is representative of three biologically independent experiments. Data are presented as box-and-whisker plots displaying median, interquartile range (boxes), and minima and maxima (whiskers) (a,e-g,j,n-p) or mean ± SEM (b-d,h-i,k-m,q-r). Comparisons were made using a two-tailed Student’s t-test.
Extended Data Figure 7.
Extended Data Figure 7.. Exogenous SCD expression partially rescues tumor growth inhibition by caloric restriction.
a, b, Tumor volumes (a) and tumor weights (b) normalized to animal body weight of subcutaneous AL1376 tumors expressing EV or SCD-HA in male mice exposed to a control or CR diet. EV: Control n = 4 mice, EV: CR n = 4 mice, SCD-HA: Control n = 4 mice, SCD-HA: CR n = 4 mice. c, d, Tumor volumes (c) and tumor weights (d) of subcutaneous AL1376 tumors expressing EV or SCD-HA in female mice exposed to a control or CR diet. EV: Control n = 4 mice, EV: CR n = 4 mice, SCD-HA: Control n = 4 mice, SCD-HA: CR n = 4 mice. e, f, Tumor volumes (e) and tumor weights (f) normalized to animal body weight of subcutaneous AL1376 tumors expressing EV or SCD-HA in female mice exposed to a control or CR diet. EV: Control n = 4 mice, EV: CR n = 4 mice, SCD-HA: Control n = 4 mice, SCD-HA: CR n = 4 mice. g, h, Daily food consumption by weight (g) and daily caloric consumption (h) of the control diet and CR by male and female mice. i, j, Tumor weights (i) and tumor weights normalized to animal body weight (j) of subcutaneous LGSP tumors expressing EV or SCD-HA in mice exposed to a control or CR diet. EV: Control n = 6 mice, EV: CR n = 5 mice, SCD-HA: Control n = 6 mice, SCD-HA: CR n = 6 mice. k, Immunoblot for HA, human SCD (hSCD), mouse Scd1 (mSCD1), and vinculin in subcutaneous AL1376 tumors expressing an empty vector (EV) or SCD-HA from mice exposed to a control or CR diet for 18 days. l-n, The indicated MUFA/SFA ratios (l) and fatty acid levels (m-n) measured in subcutaneous AL1376 tumors expressing EV or SCD-HA from mice exposed to a control or CR diet for 18 days. EV: Control n = 6, EV: CR n = 6, SCD-HA: Control n = 6, SCD-HA: CR n = 6. o, Immunoblot for HA, hSCD, mSCD1, and vinculin in subcutaneous AL1376 tumors expressing an empty vector (EV) or SCD-HA from mice exposed to a control or CR diet for 7 days. p-r, The indicated MUFA/SFA ratios (p) and fatty acid levels (q-r) measured in subcutaneous AL1376 tumors expressing EV or SCD-HA from mice exposed to a control or CR diet for 7 days. EV: Control n = 6, EV: CR n = 6, SCD-HA: Control n = 6, SCD-HA: CR n = 6. Data are presented as box-and-whisker plots displaying median, interquartile range (boxes), and minima and maxima (whiskers) (b,d,f,i-j,l-n,p-r) or mean ± SEM (a,c,e,g,h). Comparisons were made using two-way repeated measures analysis of variance (ANOVA) (a,c,e) or a two-tailed Student’s t-test (b,d,f,i-j,l-n,p-r).
Extended Data Figure 8.
Extended Data Figure 8.. Changing the fat composition of caloric restriction and the ketogenic diet alters tumor growth and tumor fatty acid composition.
a, b, The indicated fatty acid levels measured in plasma from mice exposed to a control diet, CR, high fat caloric restriction diet consisting of soybean oil (HFCR-Soybean), and high fat caloric restriction diet consisting of palm oil (HFCR-Palm). Control n = 6, CR n = 5, HFCR-Soybean n = 5, HFCR-Palm n = 5. c-e, The indicated fatty acid levels (c,e) and MUFA/SFA ratios (d) measured in subcutaneous AL1376 tumors from mice exposed to a control diet, CR, HFCR-Soybean, or HFCR-Palm. Control n = 7, CR n = 7, HFCR-Soybean n = 7, HFCR-Palm n = 7. f, g, Tumor volumes (f) and tumor weights (g) of subcutaneous LGSP tumors in mice exposed to a control diet, CR, HFCR-Soybean, or HFCR-Palm. Control n = 5 mice, CR n = 6 mice, HFCR-Soybean n = 5 mice, HFCR-Palm n = 6 mice. h-j, The indicated fatty acid levels (h,j) and MUFA/SFA ratios (i) measured in subcutaneous LGSP tumors from mice exposed to a control diet, CR, HFCR-Soybean, or HFCR-Palm. Control n = 6, CR n = 6, HFCR-Soybean n = 6, HFCR-Palm n = 6. k, Tumor weights of subcutaneous LGSP tumors expressing an empty vector (EV) or SCD-HA in mice exposed to a control or KD diet consisting of palm oil (KD-Palm). EV: Control n = 6 mice, EV: KD-Palm n = 6 mice, SCD-HA: Control n = 6 mice, SCD-HA: KD-Palm n = 6 mice. l-n, The indicated fatty acid levels measured in plasma from mice exposed to a control diet or KD-Palm. Control n = 12, KD-Palm n = 12. o-r, The indicated fatty acid levels (o,p,r) and MUFA/SFA ratios (q) measured in subcutaneous AL1376 tumors expressing an EV or SCD-HA from mice exposed to a control diet or KD-Palm. EV: Control n = 6, EV: KD-Palm n = 7, SCD-HA: Control n = 6, SCD-HA: KD-Palm n = 6. Data are presented as box-and-whisker plots displaying median, interquartile range (boxes), and minima and maxima (whiskers) (a-e, g-r) or mean ± SEM (f). Comparisons were made using a two-tailed Student’s t-test (a-e, h-r), a two-way repeated measures analysis of variance (ANOVA) (f), or a one-way ANOVA (g).
Figure 1.
Figure 1.. Caloric restriction, but not the ketogenic diet, impairs growth of PDAC allograft tumors.
a-d, Tumor volumes (a,c) and endpoint tumor weights (b,d) of subcutaneous AL1376 PDAC allografts in male mice exposed to (a,b) CR or a control diet, or (c,d) the KD or a control diet. (a,b) Control n = 5 mice, CR n = 4 mice; (c,d) Control n = 5 mice, KD n = 5 mice. e-h, Effects of control diets, CR, or the KD on (e,f) blood glucose levels or (g,h) fasting plasma insulin levels. (e) Control n = 12, CR n = 11; (f) Control n = 9, KD n = 10; (g) Control n = 6, CR n = 6; (h) Control n = 7, KD n = 8. Data are presented as mean ± SEM (a,c) or as box-and-whisker plots displaying median, interquartile range (boxes), and minima and maxima (whiskers) (b,d,e-h). Comparisons were made using two-way repeated measures analysis of variance (ANOVA) (a,c) or a two-tailed Student’s t-test (b,d,e-h).
Figure 2.
Figure 2.. Caloric restriction and the ketogenic diet differentially alter nutrient levels in the plasma and tumor interstitial fluid.
a, b, Glucose concentration in tumor interstitial fluid from subcutaneous AL1376 tumors in mice exposed to (a) CR or a control diet, or (b) the KD or a control diet. (a) Control n = 11, CR n = 10; (b) Control n = 5, KD n = 7. c, Doubling times of AL1376 cells cultured in lipidated versus de-lipidated media containing the indicated glucose concentrations. n = 3 biologically independent replicates per group. d, Fold change in specified metabolite levels induced by CR or the KD relative to the control diet measured in the plasma (upper) or tumor interstitial fluid (lower). Plasma: CR n = 8, KD n = 9; Tumor interstitial fluid: CR n = 13, KD n = 6. e, Fold changes in specified fatty acid levels induced by CR or the KD relative to the control diet measured in the plasma (upper) or tumor interstitial fluid (lower). Plasma: CR n = 7, KD n = 4; Tumor interstitial fluid: CR n = 10, KD n = 4. Data are presented as box-and-whisker plots displaying median, interquartile range (boxes), and minima and maxima (whiskers) (a-b) or as mean ± SEM (c-e). Comparisons were made using a two-tailed Student’s t-test (a-c).
Figure 3.
Figure 3.. Increased stearoyl-CoA desaturase activity is required for cancer cells to adapt to exogenous lipid limitation.
a, Doubling times of AL1376 cells cultured in lipidated versus de-lipidated media. b, Fatty acid levels in AL1376 cells cultured in lipidated versus de-lipidated media for 24 h. n = 5 biologically independent replicates. c, Relative fatty acid synthesis rates in AL1376 cells cultured in lipidated versus de-lipidated media. A one-tailed Student’s t-test was used for comparison between groups. d, Schematic of the reaction catalyzed by stearoyl-CoA desaturase (SCD). e, f, MUFA/SFA ratios (e) and synthesis rates of 16:1(n-7) and 18:1(n-9) (f) in AL1376 cells cultured in lipidated versus de-lipidated media, with or without 50 nM of the SCD inhibitor A939572 for 24 h. g, Doubling times of AL1376 cells cultured in lipidated versus de-lipidated media with the indicated concentrations of A939572. h, Doubling times of AL1376 cells cultured in de-lipidated media with or without 50 nM A939572, BSA, 50 μM 18:1(n-9), 50 μM 18:2(n-6), or 15 μM 16:0. i-m, 18:1(n-9) (i), 16:1(n-7) (j), 18:1(n-9)/18:0 (k), 16:1(n-7)/16:0 (l), and 16:0 (m) levels measured in AL1376 cells cultured in de-lipidated media with or without 50 nM A939572, BSA, 50 μM 18:1(n-9), 50 μM 18:2(n-6), or 15 μM 16:0 for 48 h as indicated. n, Relative fatty acid synthesis rates in AL1376 cells cultured in de-lipidated media with or without 50 nM A939572, BSA, 50 μM 18:1(n-9), or 50 μM 18:2(n-6). o, Doubling times of AL1376 cells cultured in de-lipidated media containing 50 nM A939572, 0.3 μM of the FASN inhibitor GSK2194069, or 10 μM of the ACC inhibitor PF-05175157. All data are presented as mean ± SEM; unless otherwise indicated, n = 3 biologically independent replicates, and a two-tailed Student’s t-test was used for comparison between groups.
Figure 4.
Figure 4.. Low glycemic diets impair tumor SCD, which interacts with changes in lipid availability to impact tumor growth.
a, b, The indicated fatty acid levels (a) and MUFA/SFA ratios (b) measured in subcutaneous AL1376 tumors from mice exposed to a control or CR diet. Control n = 10, CR n = 8. c, Immunoblot and quantification for mouse Scd1 (mSCD1) and vinculin in subcutaneous AL1376 tumors from male mice exposed to a control or CR diet. n = 7 per group. d, e, The indicated fatty acid levels (d) and MUFA/SFA ratios (e) measured in subcutaneous AL1376 tumors from mice exposed to a control or KD diet. Control n = 8, KD n = 9. f, Immunoblot and quantification for mSCD1 and vinculin in subcutaneous AL1376 tumors from male mice exposed to a control or KD diet. n = 5 per group. g, h, Tumor volumes (g) and weights (h) of subcutaneous AL1376 tumors expressing an empty vector (EV) or SCD-HA in male mice exposed to a control or CR diet. n = 4 per group. i, j, Tumor volumes (i) and weights (j) of subcutaneous AL1376 tumors in mice exposed to a control diet, CR, or high fat CR diets consisting of soybean oil (HFCR-Soybean) or palm oil (HFCR-Palm). Control n = 5 mice, CR n = 4 mice, HFCR-Soybean n = 4 mice, HFCR-Palm n = 4 mice. k, l, Tumor volumes (k) and weights (l) of subcutaneous AL1376 tumors expressing EV or SCD-HA in mice exposed to a control or KD diet consisting of palm oil (KD-Palm). EV: Control n = 4 mice, EV: KD-Palm n = 5 mice, SCD-HA: Control n = 6 mice, SCD-HA: KD-Palm n = 6 mice. m, Model summarizing how low glycemic diets alter lipid metabolism to impact tumor growth. Data are presented as box-and-whisker plots displaying median, interquartile range (boxes), and minima and maxima (whiskers) (a,b,d,e,h,j,l) or mean ± SEM (c,f,g,i,k). Comparisons were made using a two-tailed Student’s t-test (a-f,h,j,l) or two-way repeated measures analysis of variance (ANOVA) (g,i,k).

Comment in

Similar articles

Cited by

  • Metabolic adaptations in prostate cancer.
    Pujana-Vaquerizo M, Bozal-Basterra L, Carracedo A. Pujana-Vaquerizo M, et al. Br J Cancer. 2024 Nov;131(8):1250-1262. doi: 10.1038/s41416-024-02762-z. Epub 2024 Jul 5. Br J Cancer. 2024. PMID: 38969865 Free PMC article. Review.
  • Targeting mitochondrial metabolism for precision medicine in cancer.
    Sainero-Alcolado L, Liaño-Pons J, Ruiz-Pérez MV, Arsenian-Henriksson M. Sainero-Alcolado L, et al. Cell Death Differ. 2022 Jul;29(7):1304-1317. doi: 10.1038/s41418-022-01022-y. Epub 2022 Jul 13. Cell Death Differ. 2022. PMID: 35831624 Free PMC article. Review.
  • Oncogenic Fatty Acid Metabolism Rewires Energy Supply Chain in Gastric Carcinogenesis.
    Won Y, Jang B, Lee SH, Reyzer ML, Presentation KS, Kim H, Caldwell B, Zhang C, Lee HS, Lee C, Trinh VQ, Tan MCB, Kim K, Caprioli RM, Choi E. Won Y, et al. Gastroenterology. 2024 May;166(5):772-786.e14. doi: 10.1053/j.gastro.2024.01.027. Epub 2024 Jan 24. Gastroenterology. 2024. PMID: 38272100 Free PMC article.
  • Obesity, white adipose tissue and cancer.
    Solsona-Vilarrasa E, Vousden KH. Solsona-Vilarrasa E, et al. FEBS J. 2025 May;292(9):2189-2207. doi: 10.1111/febs.17312. Epub 2024 Nov 4. FEBS J. 2025. PMID: 39496581 Free PMC article. Review.
  • Developing dietary interventions as therapy for cancer.
    Taylor SR, Falcone JN, Cantley LC, Goncalves MD. Taylor SR, et al. Nat Rev Cancer. 2022 Aug;22(8):452-466. doi: 10.1038/s41568-022-00485-y. Epub 2022 May 25. Nat Rev Cancer. 2022. PMID: 35614234 Free PMC article. Review.

References

    1. Lien EC & Vander Heiden MG A framework for examining how diet impacts tumour metabolism. Nat Rev Cancer 19, 651–661 (2019). - PubMed
    1. Sullivan MR et al. Increased Serine Synthesis Provides an Advantage for Tumors Arising in Tissues Where Serine Levels Are Limiting. Cell Metab 29, 1410–1421.e4 (2019). - PMC - PubMed
    1. Sullivan MR et al. Quantification of microenvironmental metabolites in murine cancers reveals determinants of tumor nutrient availability. Elife 8, e44235 (2019). - PMC - PubMed
    1. Maddocks ODK et al. Modulating the therapeutic response of tumours to dietary serine and glycine starvation. Nature 544, 372–376 (2017). - PubMed
    1. Gao X et al. Dietary methionine influences therapy in mouse cancer models and alters human metabolism. Nature (2019). - PMC - PubMed

Publication types

MeSH terms