. 2021 Oct 5:928:A16.
doi: 10.1017/jfm.2021.802. eCollection 2021 Dec 10.

Force balance in rapidly rotating Rayleigh-Bénard convection

Affiliations

Force balance in rapidly rotating Rayleigh-Bénard convection

Andrés J Aguirre Guzmán et al. J Fluid Mech. .

Abstract

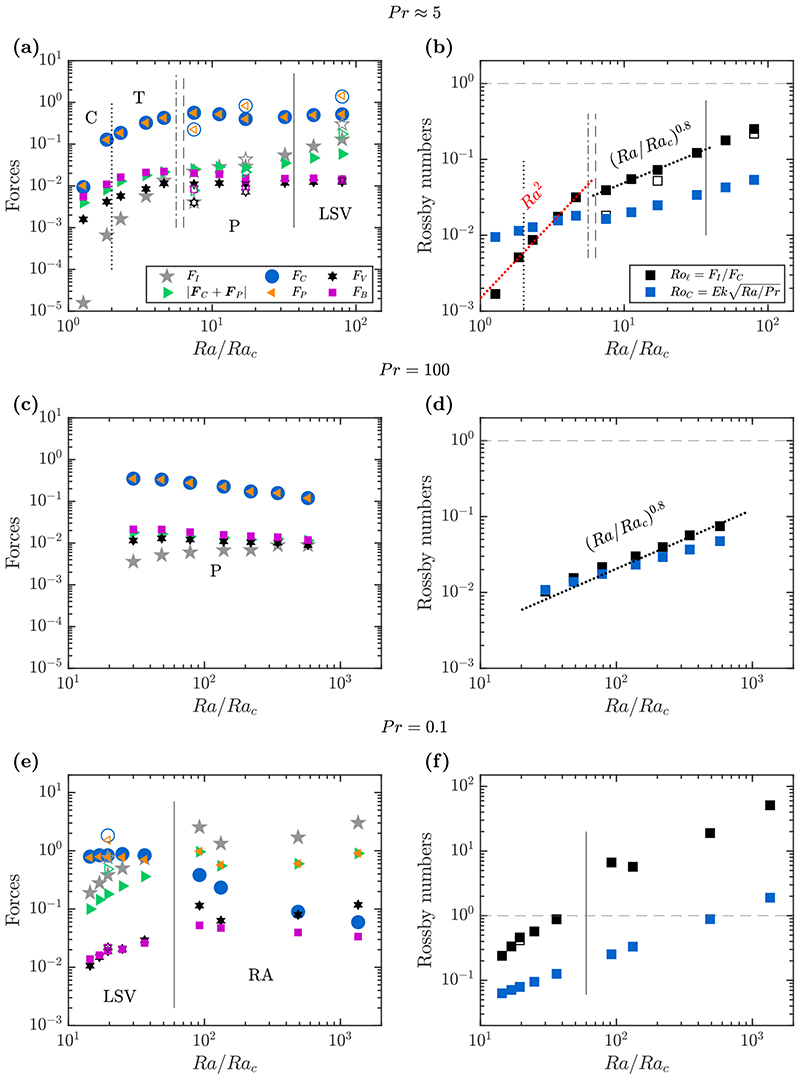
The force balance of rotating Rayleigh-Bénard convection regimes is investigated using direct numerical simulation on a laterally periodic domain, vertically bounded by no-slip walls. We provide a comprehensive view of the interplay between governing forces both in the bulk and near the walls. We observe, as in other prior studies, regimes of cells, convective Taylor columns, plumes, large-scale vortices (LSVs) and rotation-affected convection. Regimes of rapidly rotating convection are dominated by geostrophy, the balance between Coriolis and pressure-gradient forces. The higher-order interplay between inertial, viscous and buoyancy forces defines a subdominant balance that distinguishes the geostrophic states. It consists of viscous and buoyancy forces for cells and columns, inertial, viscous and buoyancy forces for plumes, and inertial forces for LSVs. In rotation-affected convection, inertial and pressure-gradient forces constitute the dominant balance; Coriolis, viscous and buoyancy forces form the subdominant balance. Near the walls, in geostrophic regimes, force magnitudes are larger than in the bulk; buoyancy contributes little to the subdominant balance of cells, columns and plumes. Increased force magnitudes denote increased ageostrophy near the walls. Nonetheless, the flow is geostrophic as the bulk. Inertia becomes increasingly more important compared to the bulk, and enters the subdominant balance of columns. As the bulk, the near-wall flow loses rotational constraint in rotation-affected convection. Consequently, kinetic boundary layers deviate from the expected behaviour from linear Ekman boundary layer theory. Our findings elucidate the dynamical balances of rotating thermal convection under realistic top/bottom boundary conditions, relevant to laboratory settings and large-scale natural flows.


Conflict of interest statement

Declaration of interests. The authors report no conflict of interest.

Figures

Figure 1
Figure 1
Temperature fluctuations for selected cases in the observed flow regimes. In the captions, CTCs stands for convective Taylor columns, LSVs for large-scale vortices, RA for rotation-affected convection, Pr is Prandtl number and Ra/Rac is flow supercriticality. Owing to the low Ek ~ 10−7 considered for all cases, the domain aspect ratio Γ = W/H = O(Ek 1/3) (W and H are its width and height) is smaller than unity, i.e. the computational domains are narrower than they are tall. Thus, for clarity, the domains are stretched horizontally by a factor 1/Γ. The colour scale is chosen to highlight the flow features. Red denotes above-average temperature and blue is for below-average temperature.
Figure 2
Figure 2
Horizontal kinetic energy, scaled by volume-averaged total energy, for LSV cases in figures 1(d) and 1(g). As before, the domains are stretched horizontally by a factor 1/Γ for clarity. Both plots have the same colour scale.
Figure 3
Figure 3
Force balance (left column) and local Rossby number Ro (right column), both at mid-height, as a function of supercriticality Ra/Rac for simulations at (a,b) Pr ≈ 5, (c,d) 100, and (e,f) 0.1. The convective Rossby number RoC=EkRa/Pr is plotted along with Ro for comparison. Filled and open symbols correspond to simulations with no-slip and stress-free boundary conditions, respectively. Vertical dotted lines denote our estimated transition between cells (C) and convective Taylor columns (T). Vertical dash-dotted and dashed lines are the predicted transitions between convective Taylor columns (T) and plumes (P) in Cheng et al. (2015) and Nieves et al. (2014), respectively. Vertical solid lines are our estimated transitions between plumes and large-scale vortices (LSVs; at Pr ≈ 5), and between LSVs and rotation-affected (RA) convection (at Pr = 0.1). Horizontal dashed lines indicate Ro, RoC = 1, the red dotted line is the predicted scaling in King et al. (2013), and the (thick) black dotted lines result from the least-squares fit of cases with plumes at Pr ≈ 5.
Figure 4
Figure 4
(a) Horizontal and (b) vertical force balance at mid-height as a function of the flow supercriticality Ra/Rac, for simulations at Pr ≈ 5. Vertical lines are as in figure 3.
Figure 5
Figure 5
Root-mean-square (RMS) of horizontal and vertical velocities, u RMS and w RMS, respectively, at mid-height z = 0.5. Filled and open symbols correspond to simulations with no-slip and stress-free boundary conditions, respectively. Red, green and blue symbols are results from simulations at Pr ≈ 5, 100 and 0.1, respectively. Colour-coded vertical lines and regime labels are as in figure 3.
Figure 6
Figure 6
Force balance (left column) and local Rossby number Ro (right column), both at the kinetic boundary layer, as a function of Ra/Rac for simulations at (a,b) Pr ≈ 5, (c,d) 100 and (e,f) 0.1. Filled and open symbols correspond to simulations with no-slip and stress-free boundary conditions, respectively. Vertical and horizontal lines, as well as regime labels, are as in figure 3.
Figure 7
Figure 7
(a) Horizontal and (b) vertical force balance at the kinetic boundary layer as a function of the flow supercriticality Ra/Rac, for simulations at Pr ≈ 5. Vertical lines are as in figure 3.
Figure 8
Figure 8
Schematic figure of geostrophic convection near a bottom no-slip wall. Vertical flux w A cross in a column/plume of cross-sectional area A cross is fed by a boundary-layer flux uA cyl through a cylindrical area A cyl.
Figure 9
Figure 9
Root-mean-square (RMS) of horizontal and vertical velocities, u RMS and w RMS, at the bottom kinetic boundary layer (z = δu; dark-coloured symbols) and at the top kinetic boundary layer (z = 1 − δu; light-coloured symbols). Filled and open symbols correspond to simulations with no-slip and stress-free boundary conditions, respectively. Red, green and blue symbols are results from simulations at Pr ≈ 5, 100 and 0.1, respectively. Colour-coded vertical lines are as in figure 3.
None

References

    1. Aguirre Guzman AJ, Madonia M, Cheng JS, Ostilla-Mónico R, Clercx HJH, Kunnen RPJ. Competition between Ekman plumes and vortex condensates in rapidly rotating thermal convection. Phys Rev Lett. 2020;125(21):214501. - PubMed
    1. Ahlers G, Grossmann S, Lohse D. Heat transfer and large scale dynamics in turbulent Rayleigh-Bénard convection. Rev Mod Phys. 2009;81(2):503.
    1. Aubert J. Steady zonal flows in spherical shell dynamos. J Fluid Mech. 2005;542:53.
    1. Aubert J. Approaching Earth’s core conditions in high-resolution geodynamo simulations. Geophys J Int. 2019;219(Supplement_1):S137–S151.
    1. Aubert J, Brito D, Nataf HC, Cardin P, Masson JP. A systematic experimental study of rapidly rotating spherical convection in water and liquid gallium. Phys Earth Planet Inter. 2001;128(1-4):51–74.

LinkOut - more resources