

Genome-Wide Identification and Function of Aquaporin Genes During Dormancy and Sprouting Periods of Kernel-Using Apricot (Prunus armeniaca L.)
- PMID: 34671366
- PMCID: PMC8520955
- DOI: 10.3389/fpls.2021.690040
Genome-Wide Identification and Function of Aquaporin Genes During Dormancy and Sprouting Periods of Kernel-Using Apricot (Prunus armeniaca L.)
Abstract
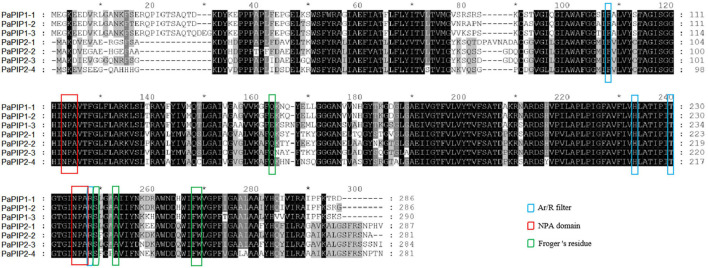
Aquaporins (AQPs) are essential channel proteins that play a major role in plant growth and development, regulate plant water homeostasis, and transport uncharged solutes across biological membranes. In this study, 33 AQP genes were systematically identified from the kernel-using apricot (Prunus armeniaca L.) genome and divided into five subfamilies based on phylogenetic analyses. A total of 14 collinear blocks containing AQP genes between P. armeniaca and Arabidopsis thaliana were identified by synteny analysis, and 30 collinear blocks were identified between P. armeniaca and P. persica. Gene structure and conserved functional motif analyses indicated that the PaAQPs exhibit a conserved exon-intron pattern and that conserved motifs are present within members of each subfamily. Physiological mechanism prediction based on the aromatic/arginine selectivity filter, Froger's positions, and three-dimensional (3D) protein model construction revealed marked differences in substrate specificity between the members of the five subfamilies of PaAQPs. Promoter analysis of the PaAQP genes for conserved regulatory elements suggested a greater abundance of cis-elements involved in light, hormone, and stress responses, which may reflect the differences in expression patterns of PaAQPs and their various functions associated with plant development and abiotic stress responses. Gene expression patterns of PaAQPs showed that PaPIP1-3, PaPIP2-1, and PaTIP1-1 were highly expressed in flower buds during the dormancy and sprouting stages of P. armeniaca. A PaAQP coexpression network showed that PaAQPs were coexpressed with 14 cold resistance genes and with 16 cold stress-associated genes. The expression pattern of 70% of the PaAQPs coexpressed with cold stress resistance genes was consistent with the four periods [Physiological dormancy (PD), ecological dormancy (ED), sprouting period (SP), and germination stage (GS)] of flower buds of P. armeniaca. Detection of the transient expression of GFP-tagged PaPIP1-1, PaPIP2-3, PaSIP1-3, PaXIP1-2, PaNIP6-1, and PaTIP1-1 revealed that the fusion proteins localized to the plasma membrane. Predictions of an A. thaliana ortholog-based protein-protein interaction network indicated that PaAQP proteins had complex relationships with the cold tolerance pathway, PaNIP6-1 could interact with WRKY6, PaTIP1-1 could interact with TSPO, and PaPIP2-1 could interact with ATHATPLC1G. Interestingly, overexpression of PaPIP1-3 and PaTIP1-1 increased the cold tolerance of and protein accumulation in yeast. Compared with wild-type plants, PaPIP1-3- and PaTIP1-1-overexpressing (OE) Arabidopsis plants exhibited greater tolerance to cold stress, as evidenced by better growth and greater antioxidative enzyme activities. Overall, our study provides insights into the interaction networks, expression patterns, and functional analysis of PaAQP genes in P. armeniaca L. and contributes to the further functional characterization of PaAQPs.
Keywords: aquaporin gene; cold resistance; functional analysis; genome-wide analysis; kernel-using apricot (P. armeniaca L.).
Copyright © 2021 Li, Wang, Zhang, Zhu, Zhu, Xia, Li, Gao, Wang, Zhang, Wuyun and Mo.
Conflict of interest statement
The authors declare that the research was conducted in the absence of any commercial or financial relationships that could be construed as a potential conflict of interest.
Figures


Similar articles
-
Genome-wide and functional analysis of late embryogenesis abundant (LEA) genes during dormancy and sprouting periods of kernel consumption apricots (P. armeniaca L. × P. sibirica L.).Int J Biol Macromol. 2024 Nov;279(Pt 3):133245. doi: 10.1016/j.ijbiomac.2024.133245. Epub 2024 Jul 6. Int J Biol Macromol. 2024. PMID: 38977045
-
Genome-Wide Analysis of the Aquaporin Gene Family in Chickpea (Cicer arietinum L.).Front Plant Sci. 2016 Nov 29;7:1802. doi: 10.3389/fpls.2016.01802. eCollection 2016. Front Plant Sci. 2016. PMID: 27965700 Free PMC article.
-
Genome-Wide Identification, Structure Characterization, and Expression Pattern Profiling of the Aquaporin Gene Family in Betula pendula.Int J Mol Sci. 2021 Jul 6;22(14):7269. doi: 10.3390/ijms22147269. Int J Mol Sci. 2021. PMID: 34298887 Free PMC article.
-
Anticancer Potential and Other Pharmacological Properties of Prunus armeniaca L.: An Updated Overview.Plants (Basel). 2022 Jul 20;11(14):1885. doi: 10.3390/plants11141885. Plants (Basel). 2022. PMID: 35890519 Free PMC article. Review.
-
A review on apricot kernel seed proteins and peptides: Biological functions and food applications.Int J Biol Macromol. 2025 Mar;292:139053. doi: 10.1016/j.ijbiomac.2024.139053. Epub 2024 Dec 20. Int J Biol Macromol. 2025. PMID: 39710033 Review.
Cited by
-
Two aquaporins, LcPIP1;4 and LcPIP1;4a, cooperatively regulate the onset of dormancy of the terminal buds in evergreen perennial litchi (Litchi chinensis Sonn.).Hortic Res. 2025 May 7;12(8):uhaf122. doi: 10.1093/hr/uhaf122. eCollection 2025 Aug. Hortic Res. 2025. PMID: 40666672 Free PMC article.
-
Identification and Characterization of Salt- and Drought-Responsive AQP Family Genes in Medicagosativa L.Int J Mol Sci. 2022 Mar 19;23(6):3342. doi: 10.3390/ijms23063342. Int J Mol Sci. 2022. PMID: 35328763 Free PMC article.
-
Genome-Wide Identification and Expression Pattern Profiling of the Aquaporin Gene Family in Papaya (Carica papaya L.).Int J Mol Sci. 2023 Dec 8;24(24):17276. doi: 10.3390/ijms242417276. Int J Mol Sci. 2023. PMID: 38139107 Free PMC article.
-
Molecular Advances to Combat Different Biotic and Abiotic Stresses in Linseed (Linum usitatissimum L.): A Comprehensive Review.Genes (Basel). 2023 Jul 17;14(7):1461. doi: 10.3390/genes14071461. Genes (Basel). 2023. PMID: 37510365 Free PMC article. Review.
-
Genome-Wide Analysis of Aquaporins Gene Family in Populus euphratica and Its Expression Patterns in Response to Drought, Salt Stress, and Phytohormones.Int J Mol Sci. 2024 Sep 23;25(18):10185. doi: 10.3390/ijms251810185. Int J Mol Sci. 2024. PMID: 39337672 Free PMC article.
References
LinkOut - more resources
Full Text Sources
Other Literature Sources