. 2021 Oct 4:12:738710.
doi: 10.3389/fpls.2021.738710. eCollection 2021.

Genetic Dissection Uncovers Genome-Wide Marker-Trait Associations for Plant Growth, Yield, and Yield-Related Traits Under Varying Nitrogen Levels in Nested Synthetic Wheat Introgression Libraries

Affiliations

Genetic Dissection Uncovers Genome-Wide Marker-Trait Associations for Plant Growth, Yield, and Yield-Related Traits Under Varying Nitrogen Levels in Nested Synthetic Wheat Introgression Libraries

Nitika Sandhu et al. Front Plant Sci. .

Abstract

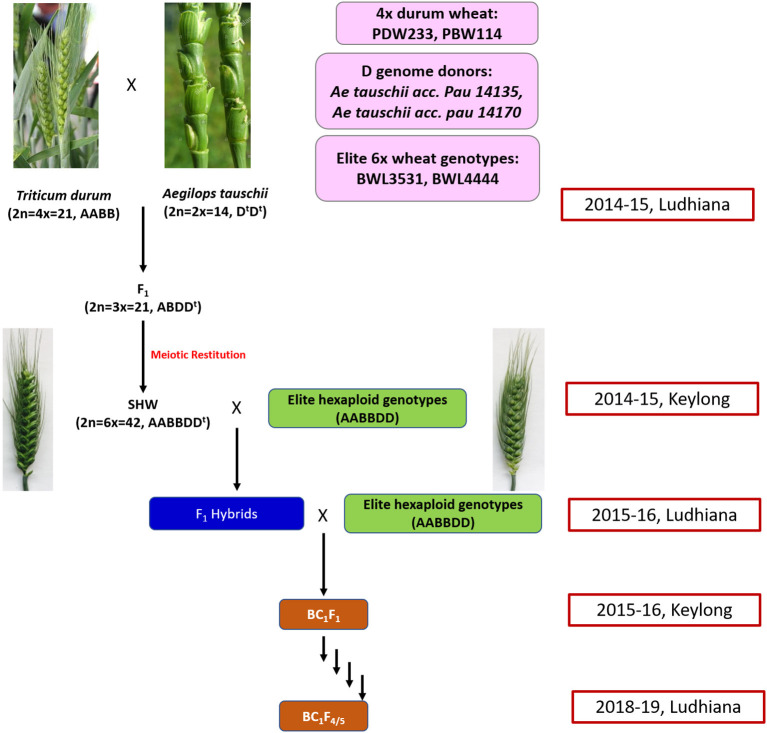
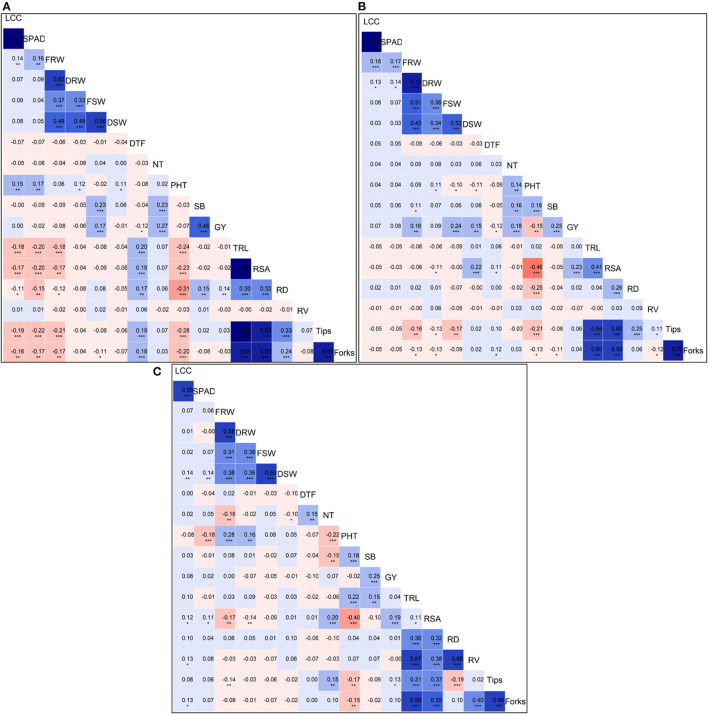
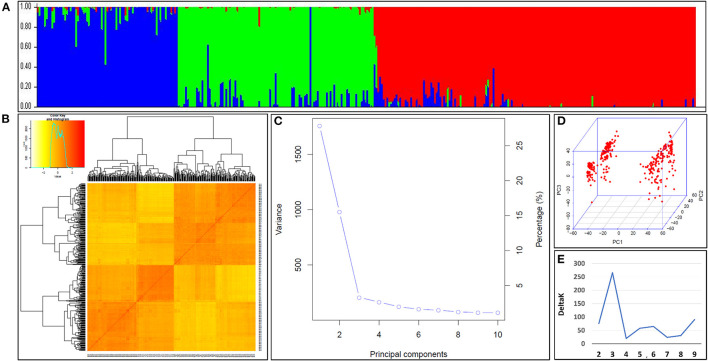
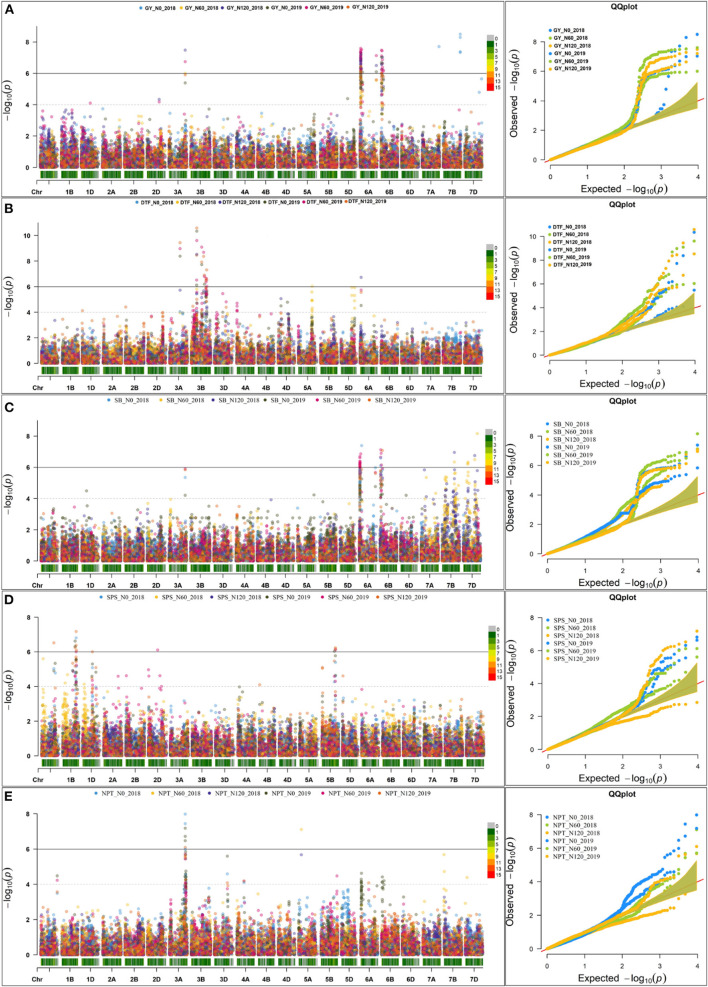
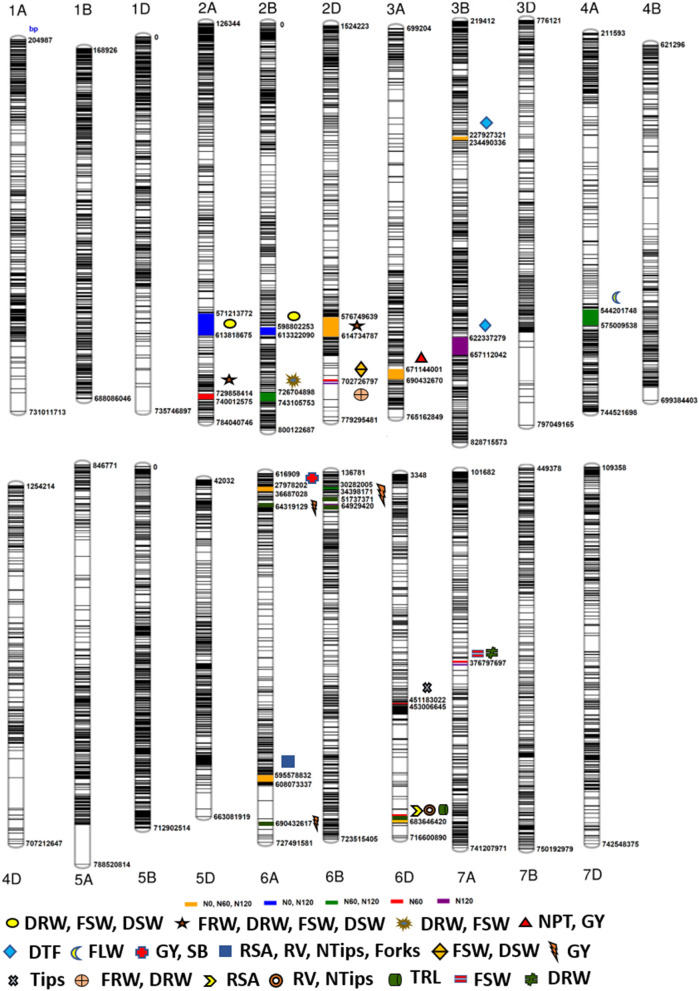
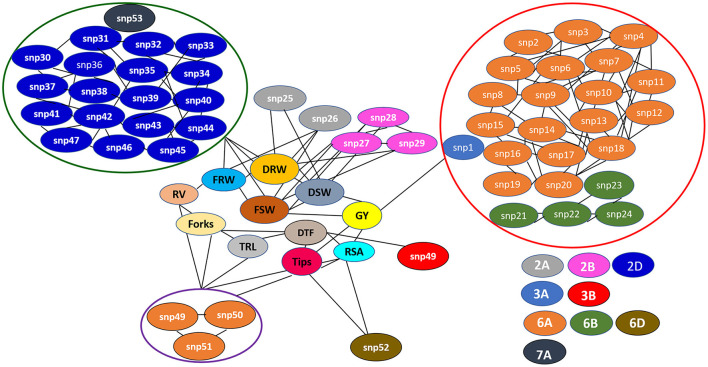
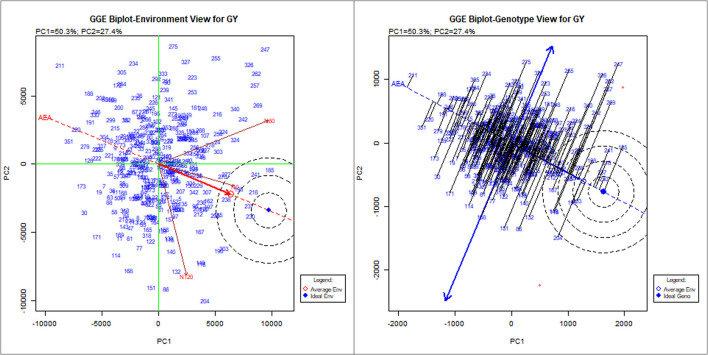
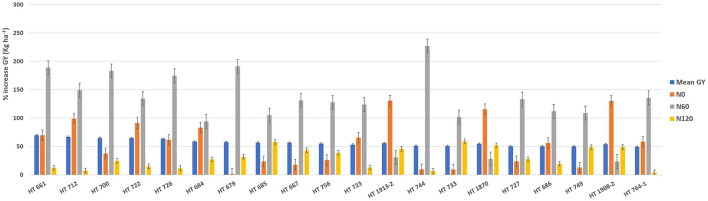
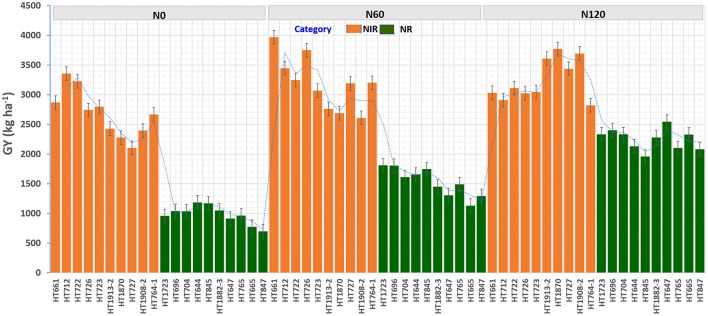
Nitrogen is one of the most important macronutrients for crop growth and metabolism. To identify marker-trait associations for complex nitrogen use efficiency (NUE)-related agronomic traits, field experiments were conducted on nested synthetic wheat introgression libraries at three nitrogen input levels across two seasons. The introgression libraries were genotyped using the 35K Axiom® Wheat Breeder's Array and genetic diversity and population structure were examined. Significant phenotypic variation was observed across genotypes, treatments, and their interactions across seasons for all the 22 traits measured. Significant positive correlations were observed among grain yield and yield-attributing traits and root traits. Across seasons, a total of 233 marker-trait associations (MTAs) associated with fifteen traits of interest at different levels of nitrogen (N0, N60, and N120) were detected using 9,474 genome-wide single nucleotide polymorphism (SNP) markers. Of these, 45 MTAs for 10 traits in the N0 treatment, 100 MTAs for 11 traits in the N60 treatment, and 88 MTAs for 11 traits in the N120 treatment were detected. We identified putative candidate genes underlying the significant MTAs which were associated directly or indirectly with various biological processes, cellular component organization, and molecular functions involving improved plant growth and grain yield. In addition, the top 10 lines based on N response and grain yield across seasons and treatments were identified. The identification and introgression of superior alleles/donors improving the NUE while maintaining grain yield may open new avenues in designing next generation nitrogen-efficient high-yielding wheat varieties.

Keywords: GWAS; MTAs; Nitrogen; SNP markers; Wheat; Yield; synthetic wheat introgression lines.


Conflict of interest statement

The authors declare that the research was conducted in the absence of any commercial or financial relationships that could be construed as a potential conflict of interest.

Figures

Figure 1
Figure 1
Schematic representation of the breeding strategy that is used to develop the nested synthetic wheat introgression libraries.
Figure 2
Figure 2
Plots of Pearson's r-values showing the correlation among traits measured (A) measured at N0, (B) N60, and (C) N120 levels. The blue color indicates positive correlation and red color indicates the negative correlation among different traits, the variation in color intensity represents the strength of the correlation among the traits. *Significance at <5% level, **significance at <1% level, ***significance at <0.1% level.
Figure 3
Figure 3
(A) Population structure within the nested synthetic wheat introgression libraries. The population structure plots with each vertical bar representing a breeding line colored according to the particular group to which the breeding line has been assigned. The breeding lines assigned to more than one of group represents the degree of their admixed set of the alleles (B) The Kinship matrix displayed as the heat map, where the red indicates the highest correlation between the pairs of breeding lines and yellow indicates the lowest correlation (C) The Scree plot indicating the most of the variabilities explained by the first three principal components (PCs) for association study (D) The three-dimensional view of the PCs explaining the genotypic variation among breeding lines constituting the introgression libraries. (E) The appropriate number of the subpopulations determined from the largest delta, K = 3.
Figure 4
Figure 4
Manhattan plot and qq plot for the yield and yield-related traits across seasons at three different levels of nitrogen (N) (N0, N60, and N120). (A) grain yield (GY), (B) About 50% days to flowering (DTF), (C) shoot biomass (SB), (D) spikelets per spike (SPS), and (E) number of productive tillers.
Figure 5
Figure 5
Schematic representation of the single nucleotide polymorphism (SNP) distribution along the 21 chromosomes of wheat. The chromosome map showing genomic regions where marker-trait associations (MTAs) for different nitrogen-use efficiency (NUE)-related trait, root traits, yield, and yield-related traits. The numbers below each chromosome indicate chromosome numbers. The bp represents the physical position of the SNPs on the chromosome in base pair.
Figure 6
Figure 6
The single nucleotide polymorphism (SNP) network indicating consistent significant marker-trait interactions across seasons and treatments (N0, N60, and N120). snp1: AX-95136668; snp2: AX-94415776; snp3: AX-94978974; snp4: AX-94737868; snp5: AX-95210745; snp6: AX-95631197; snp7: AX-95011132; snp8: AX-95255669; snp9: AX-95219967; snp10: AX-95070275; snp11: AX-94970334; snp12: AX-94894393; snp13: AX-95249202; snp14: AX-94553503; snp15: AX-94696366; snp16: AX-94386201; snp17: AX-94835065; snp18: AX-94914391; snp19: AX-94606161; snp20: AX-95072891; snp21: AX-94511241; snp22: AX-94387975; snp23: AX-94511284; snp24: AX-94816913; snp25: AX-94607905; snp26: AX-94923560; snp27: AX-94705680; snp28: AX-95203088; snp29: AX-94601746; snp30: AX-94887553; snp31: AX-94735141; snp32: AX-94474729; snp33: AX-94835810; snp34: AX-95223893; snp35: AX-95003296; snp36: AX-94477325; snp37: AX-95197137; snp38: AX-94525577; snp39: AX-94702180; snp40: AX-94487982; snp41: AX-95190381; snp42: AX-95018936; snp43: AX-94457170; snp44: AX-94962360; snp45: AX-94829391; snp46: AX-94786006; snp47: AX-94695716; snp48: AX-95136655; snp49: AX-95113687; snp50: AX-94513497; snp51: AX-94911804; snp52: AX-94565231; snp53: AX-94676800.
Figure 7
Figure 7
The GGE biplot showing the performance of 352 nested synthetic wheat introgression lines across seasons and treatments (N0, N60, and N120). The environment view refers to the three different levels of nitrogen (N) application: N0, N60, and N120. The genotype view refers to the 352 nested synthetic wheat introgression lines. The numeric number refers to the coding for the introgression lines, which is given in detail in the Supplementary Table 7.
Figure 8
Figure 8
The percentage increase in the grain yield (GY) of top 20 breeding lines derived from the nested introgression libraries possessing high and stable GY (kg ha−1) compared to the respective recipient parent averaged across two seasons under three different nitrogen (N) treatments. The numeric values above the bar graph indicate the mean GY (kg ha−1) performance of breeding lines across seasons.
Figure 9
Figure 9
The grain yield (GY) (kg ha−1) performance of top 10 nitrogen irresponsive (NIR) and 10 nitrogen responsive (NR) breeding lines averaged over two seasons under three N treatments.
Figure 10
Figure 10
The allelic constitution of the selected promising breeding lines, wild accessions of Ae. tauschii, cultivated and synthetic wheats for the (A) root-related traits and (B) grain yield (GY).

References

    1. Allen A. M., Winfield M. O., Burridge A. J., Downie R. C., Benbow H. R., Barker G. L., et al. . (2017). Characterization of a Wheat Breeders' Array suitable for high-throughput SNP genotyping of global accessions of hexaploid bread wheat (Triticum aestivum). Plant Biotech. J. 15, 390–401. 10.1111/pbi.12635 - DOI - PMC - PubMed
    1. An D., Su J., Liu Q., Zhu Y., Tong Y., Li J., et al. . (2006). Mapping QTLs for nitrogen uptake in relation to the early growth of wheat (Triticum aestivum L.). Plant Soil 284, 73–84. 10.1007/s11104-006-0030-3 - DOI
    1. Arcondéguy T., Jack R., Merrick M. (2001). PII signal transduction proteins, pivotal players in microbial nitrogen control. Microbio. Mol. Bio. Rev. 65:80. 10.1128/MMBR.65.1.80-105.2001 - DOI - PMC - PubMed
    1. Arnesano F., Banci L., Benvenuti M., Bertini I., Calderone V., Mangani S., et al. . (2003). The evolutionarily conserved trimeric structure of CutA1 proteins suggests a role in signal transduction. J. Bio. Chem. 278, 45999–46006. 10.1074/jbc.M304398200 - DOI - PubMed
    1. Bahrini I., Ogawa T., Kobayashi F., Kawahigashi H., Handa H. (2011). Overexpression of the pathogen-inducible wheat TaWRKY45 gene confers disease resistance to multiple fungi in transgenic wheat plants. Breed Sci. 61, 319–236. 10.1270/jsbbs.61.319 - DOI - PMC - PubMed

LinkOut - more resources