

Comprehensive Analysis of Ferroptosis-Related LncRNAs in Breast Cancer Patients Reveals Prognostic Value and Relationship With Tumor Immune Microenvironment
- PMID: 34671639
- PMCID: PMC8521053
- DOI: 10.3389/fsurg.2021.742360
Comprehensive Analysis of Ferroptosis-Related LncRNAs in Breast Cancer Patients Reveals Prognostic Value and Relationship With Tumor Immune Microenvironment
Abstract
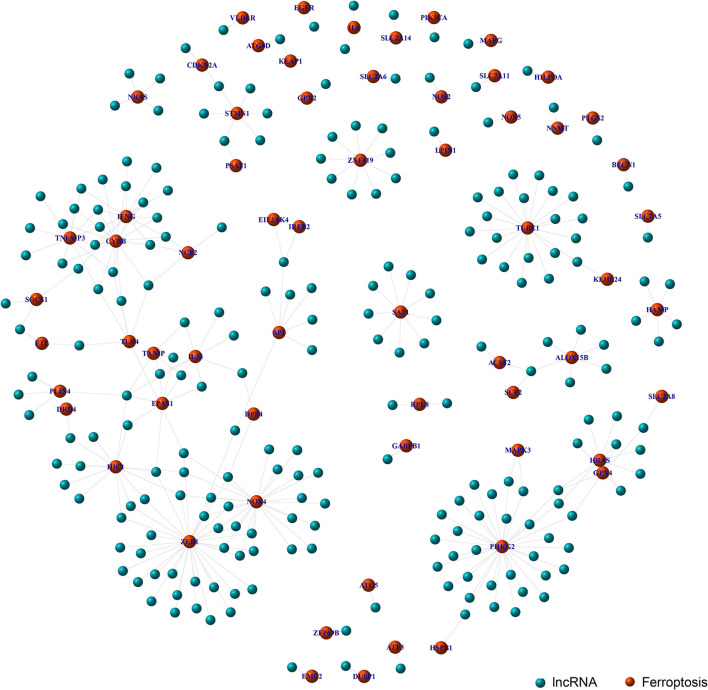
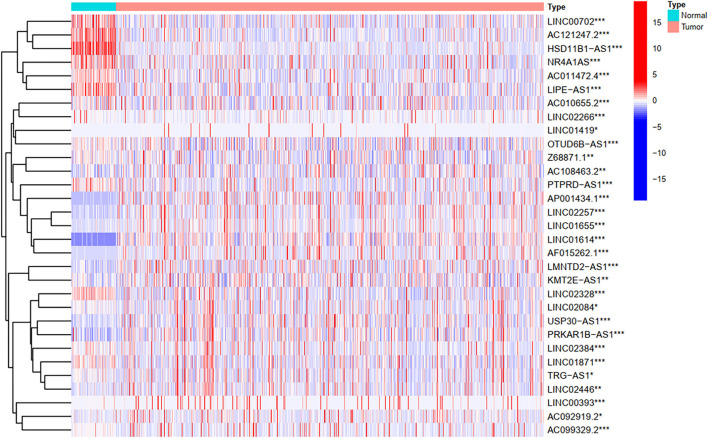
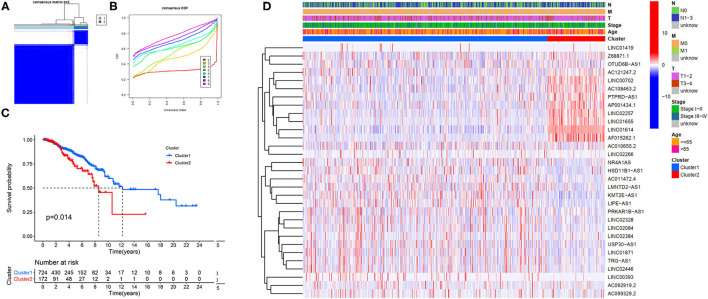
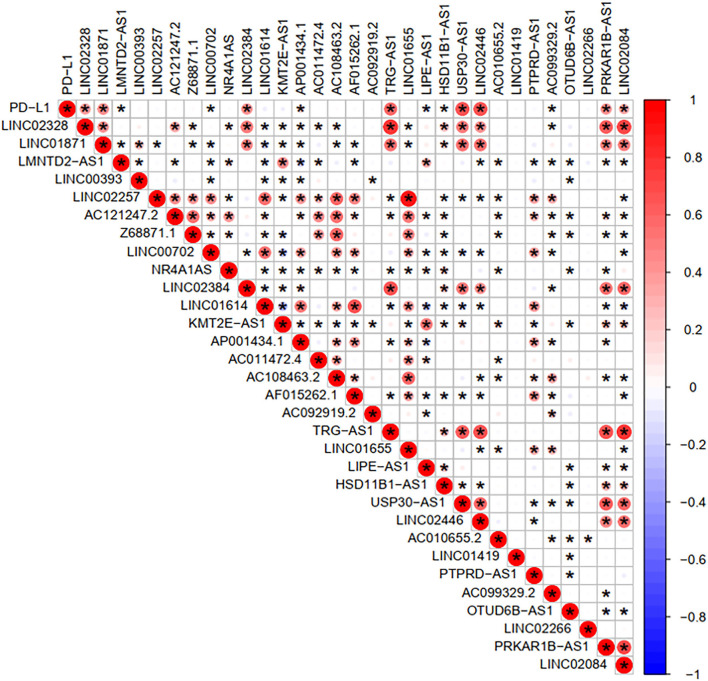
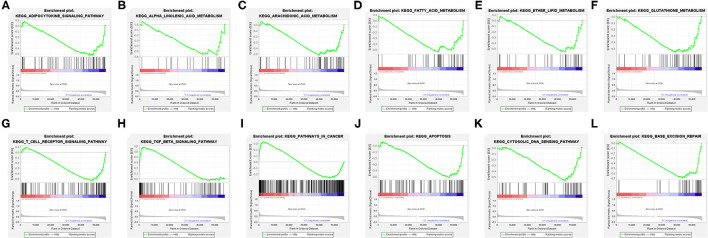
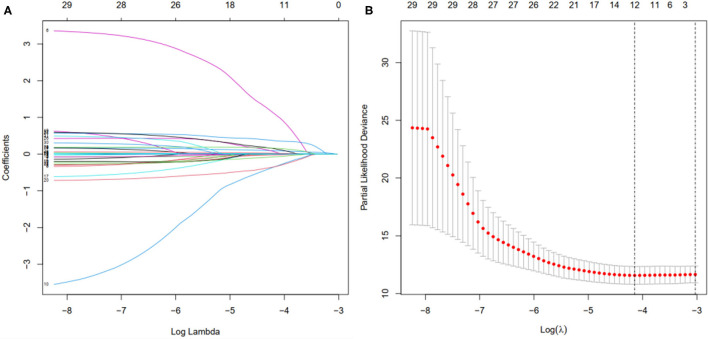
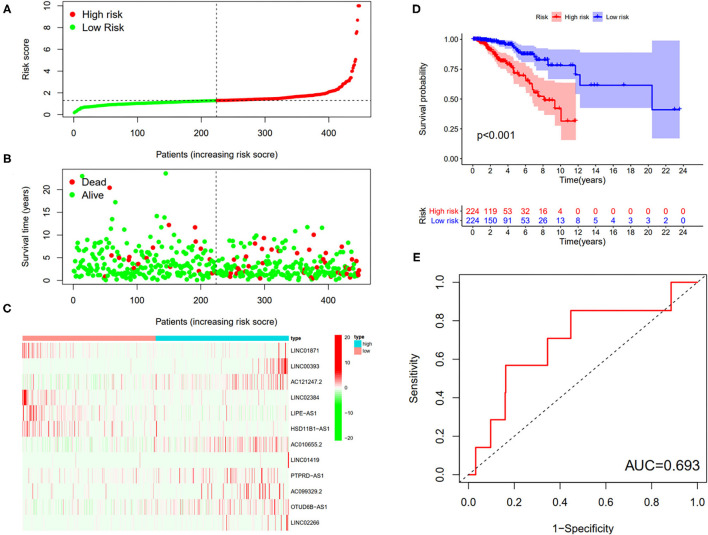
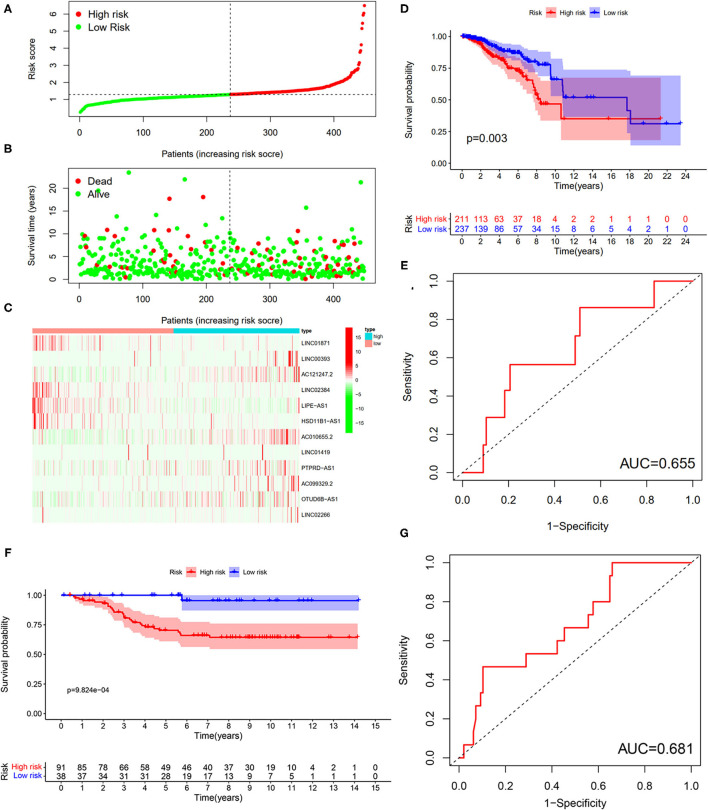
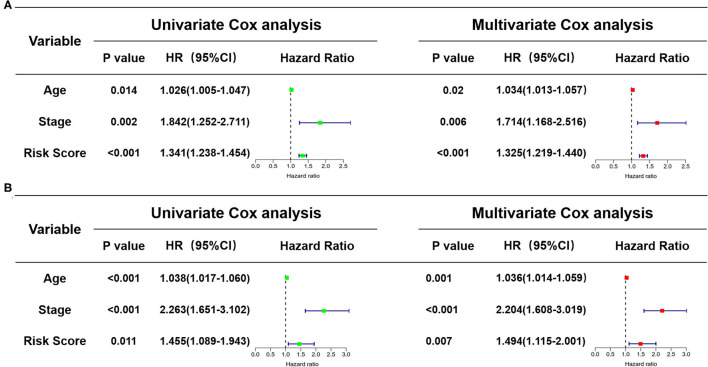
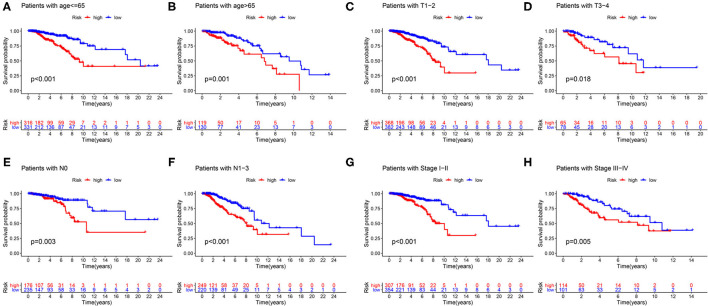
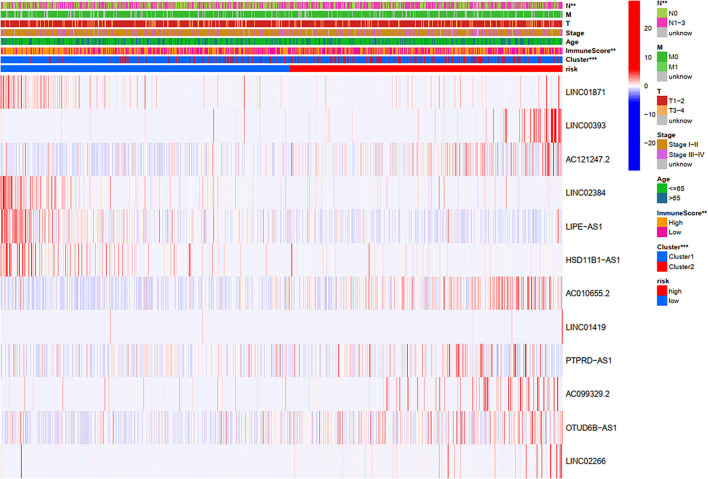
Background: Breast cancer (BC) is a heterogeneous malignant tumor, leading to the second major cause of female mortality. This study aimed to establish an in-depth relationship between ferroptosis-related LncRNA (FRlncRNA) and the prognosis as well as immune microenvironment of the patients with BC. Methods: We downloaded and integrated the gene expression data and the clinical information of the patients with BC from The Cancer Genome Atlas (TCGA) database. The co-expression network analysis and univariate Cox regression analysis were performed to screen out the FRlncRNAs related to prognosis. A cluster analysis was adopted to explore the difference of immune microenvironment between the clusters. Furthermore, we determined the optimal survival-related FRLncRNAs for final signature by LASSO Cox regression analysis. Afterward, we constructed and validated the prediction models, which were further tested in different subgroups. Results: A total of 31 FRLncRNAs were filtrated as prognostic biomarkers. Two clusters were determined, and C1 showed better prognosis and higher infiltration level of immune cells, such as B cells naive, plasma cells, T cells CD8, and T cells CD4 memory activated. However, there were no significantly different clinical characters between the clusters. Gene Set Enrichment Analysis (GSEA) revealed that some metabolism-related pathways and immune-associated pathways were exposed. In addition, 12 FRLncRNAs were determined by LASSO analysis and used to construct a prognostic signature. In both the training and testing sets, patients in the high-risk group had a worse survival than the low-risk patients. The area under the curves (AUCs) of receiver operator characteristic (ROC) curves were about 0.700, showing positive prognostic capacity. More notably, through the comprehensive analysis of heatmap, we regarded LINC01871, LINC02384, LIPE-AS1, and HSD11B1-AS1 as protective LncRNAs, while LINC00393, AC121247.2, AC010655.2, LINC01419, PTPRD-AS1, AC099329.2, OTUD6B-AS1, and LINC02266 were classified as risk LncRNAs. At the same time, the patients in the low-risk groups were more likely to be assigned to C1 and had a higher immune score, which were consistent with a better prognosis. Conclusion: Our research indicated that the ferroptosis-related prognostic signature could be used as novel biomarkers for predicting the prognosis of BC. The differences in the immune microenvironment exhibited by BC patients with different risks and clusters suggested that there may be a complementary synergistic effect between ferroptosis and immunotherapy.
Keywords: breast cancer; ferroptosis; immune microenvironment; lncRNA; prognosis.
Copyright © 2021 Xu, Jiang, Ma, Tang, Yan and Fang.
Conflict of interest statement
The authors declare that the research was conducted in the absence of any commercial or financial relationships that could be construed as a potential conflict of interest.
Figures


Similar articles
-
Ferroptosis-related lncRNA signature predicts prognosis and immunotherapy efficacy in cutaneous melanoma.Front Surg. 2022 Jul 21;9:860806. doi: 10.3389/fsurg.2022.860806. eCollection 2022. Front Surg. 2022. PMID: 35937602 Free PMC article.
-
A Novel Aging-Related Prognostic lncRNA Signature Correlated with Immune Cell Infiltration and Response to Immunotherapy in Breast Cancer.Molecules. 2023 Apr 7;28(8):3283. doi: 10.3390/molecules28083283. Molecules. 2023. PMID: 37110517 Free PMC article.
-
A New Ferroptosis-Related lncRNA Signature Predicts the Prognosis of Bladder Cancer Patients.Front Cell Dev Biol. 2021 Nov 16;9:699804. doi: 10.3389/fcell.2021.699804. eCollection 2021. Front Cell Dev Biol. 2021. PMID: 34869304 Free PMC article.
-
Identification and Validation of a Ferroptosis-Related Long Non-Coding RNA (FRlncRNA) Signature to Predict Survival Outcomes and the Immune Microenvironment in Patients With Clear Cell Renal Cell Carcinoma.Front Genet. 2022 Mar 8;13:787884. doi: 10.3389/fgene.2022.787884. eCollection 2022. Front Genet. 2022. PMID: 35350243 Free PMC article.
-
Identification of a Nomogram from Ferroptosis-Related Long Noncoding RNAs Signature to Analyze Overall Survival in Patients with Bladder Cancer.J Oncol. 2021 Aug 26;2021:8533464. doi: 10.1155/2021/8533464. eCollection 2021. J Oncol. 2021. PMID: 34484338 Free PMC article.
Cited by
-
Identification of AP002498.1 and LINC01871 as prognostic biomarkers and therapeutic targets for distant metastasis of colorectal adenocarcinoma.Cancer Med. 2024 Jan;13(1):e6823. doi: 10.1002/cam4.6823. Epub 2023 Dec 11. Cancer Med. 2024. PMID: 38083905 Free PMC article.
-
Gankyrin inhibits ferroptosis through the p53/SLC7A11/GPX4 axis in triple-negative breast cancer cells.Sci Rep. 2023 Dec 8;13(1):21916. doi: 10.1038/s41598-023-49136-8. Sci Rep. 2023. PMID: 38081931 Free PMC article.
-
A novel Cuproptosis-related LncRNA signature to predict prognosis in hepatocellular carcinoma.Sci Rep. 2022 Jul 5;12(1):11325. doi: 10.1038/s41598-022-15251-1. Sci Rep. 2022. PMID: 35790864 Free PMC article.
-
LINC02266 promotes proliferation and metastasis and inhibits ferroptosis of gastric cancer cells by regulating AKT/ACSL4 pathway.Mol Cell Biochem. 2025 Jul 19. doi: 10.1007/s11010-025-05354-4. Online ahead of print. Mol Cell Biochem. 2025. PMID: 40682711
-
Amino Acid Metabolism-Related lncRNA Signature Predicts the Prognosis of Breast Cancer.Front Genet. 2022 May 13;13:880387. doi: 10.3389/fgene.2022.880387. eCollection 2022. Front Genet. 2022. PMID: 35646057 Free PMC article.
References
LinkOut - more resources
Full Text Sources
Research Materials