[Preprint]. 2021 Oct 15:arXiv:2110.07862v2.

Rapid genetic screening with high quality factor metasurfaces

Affiliations

Rapid genetic screening with high quality factor metasurfaces

Jack Hu et al. ArXiv. .

Update in

  • Rapid genetic screening with high quality factor metasurfaces.
    Hu J, Safir F, Chang K, Dagli S, Balch HB, Abendroth JM, Dixon J, Moradifar P, Dolia V, Sahoo MK, Pinsky BA, Jeffrey SS, Lawrence M, Dionne JA. Hu J, et al. Nat Commun. 2023 Jul 26;14(1):4486. doi: 10.1038/s41467-023-39721-w. Nat Commun. 2023. PMID: 37495593 Free PMC article.

Abstract

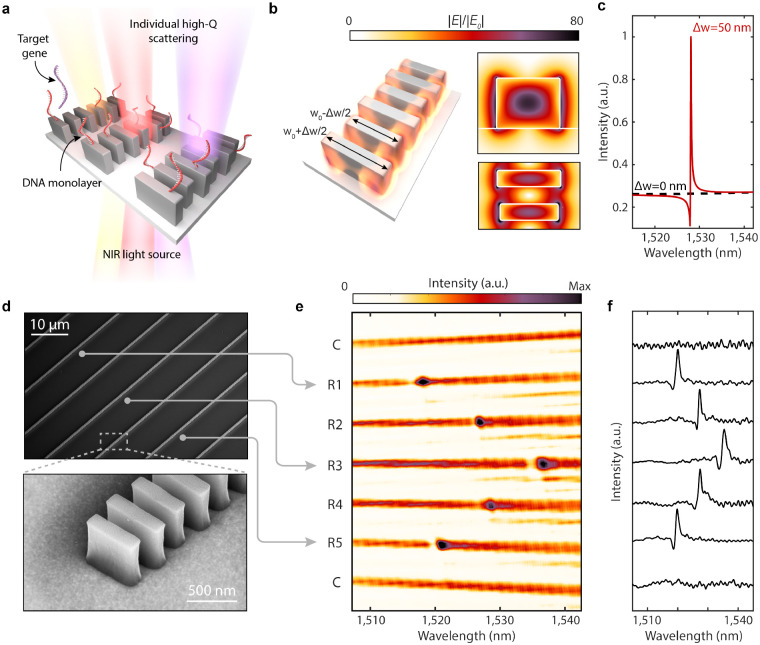
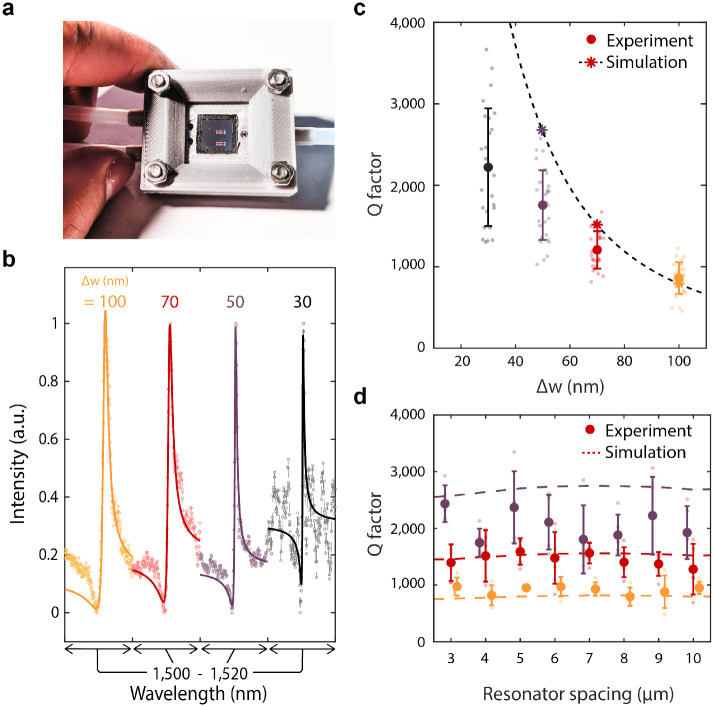
Genetic analysis methods are foundational to advancing personalized and preventative medicine, accelerating disease diagnostics, and monitoring the health of organisms and ecosystems. Current nucleic acid technologies such as polymerase chain reaction (PCR), next-generation sequencing (NGS), and DNA microarrays rely on fluorescence and absorbance, necessitating sample amplification or replication and leading to increased processing time and cost. Here, we introduce a label-free genetic screening platform based on high quality (high-Q) factor silicon nanoantennas functionalized with monolayers of nucleic acid fragments. Each nanoantenna exhibits substantial electromagnetic field enhancements with sufficiently localized fields to ensure isolation from neighboring resonators, enabling dense biosensor integration. We quantitatively detect complementary target sequences using DNA hybridization simultaneously for arrays of sensing elements patterned at densities of 160,000 pixels per cm$^2$. In physiological buffer, our nanoantennas exhibit average resonant quality factors of 2,200, allowing detection of two gene fragments, SARS-CoV-2 envelope (E) and open reading frame 1b (ORF1b), down to femtomolar concentrations. We also demonstrate high specificity sensing in clinical nasopharyngeal eluates within 5 minutes of sample introduction. Combined with advances in biomarker isolation from complex samples (e.g., mucus, blood, wastewater), our work provides a foundation for rapid, compact, amplification-free and high throughput multiplexed genetic screening assays spanning medical diagnostics to environmental monitoring.


Figures

Fig. 1.
Fig. 1.. Design of high-Q sensors.
a, Metasurface arrays of high-Q guided mode resonators consisting of perturbed chains of silicon blocks interfaced with DNA probes for targeted gene detection. Geometrical parameters of the resonators are height (h) = 500 nm, w0 = 600 nm, thickness (t) = 160 nm, block spacing (ay = 330 nm), inter-chain spacing (ax = 10 μm), and Δw varied between 30–100 nm. b, Simulated electric near-field enhancements for a resonator with Δw = 50 nm. c, Simulated cross-polarized transmission response of metasurface illuminated with normally incident linearly polarized plane waves. Responses normalized to intensity maximum of perturbed resonator. d, SEM micrographs of metasurface device composed of multiple individually monitored and tuned resonators. e, Spectral image from array with 7 resonators where C denotes nanostructures with no perturbation Δw = 0 nm and R1-R5 having perturbation Δw = 50nm. Resonance positions are modulated by adjusting block length where w0 = 595 nm for R1 & R5, w0 = 600 nm for R2 & R4, and w0 = 605 nm for R3 to form the observed chevron pattern. f, Row averaged transmitted intensities corresponding to e.
Fig. 2.
Fig. 2.. Fluid cell characterization of metasurfaces.
a, Photo of metasurface chip enclosed in fluid cell. b, Representative spectra from resonators with varying Δw. Solid lines represent fits to a Lorentzian oscillator. c, Quality factor of resonances with different Δw. Bold markers and error bars are the mean and standard deviation for N=30 resonators at each condition. Stars represent simulated values and the dashed line is a fit to predicted values from coupled mode theory (Supplementary Note 3). d, Quality factor as a function resonator spacing where mean and standard deviation are for N=5 resonators at each condition.
Fig. 3.
Fig. 3.. DNA monolayer functionalization and resonant wavelength shift measurement.
a, Schematic of chemical components utilized in immobilizing DNA self-assembled monolayers (SAM) onto the silicon nanostructures. Target DNA fragments for this study are portions of the E and ORF1b genes from the SARS-CoV-2 virus. b, Experimentally measured and c, simulated resonance wavelength shift responses with the addition of each molecular layer in the SAM, including complementary nCoV.E target binding. Markers in b, correspond to measured data points while solid lines show fits to a Lorentzian oscillator. The difference in absolute wavelength values between experimental and simulated spectra can be attributed to slight dimension variations in the fabricated structures. d, Total resonant wavelength shift during SAM functionalization and DNA sensing as referenced from initial measurements on bare silicon structures. Markers represent individual measurements from N=75 independent resonator devices and bolded markers and error bars are the mean and standard deviation of the measurements.
Fig. 4.
Fig. 4.. Biosensing demonstration with SARS-CoV-2 gene fragment targets.
a, Measured spectra from individual resonators indicate significant wavelength shifts of ~0.2 nm with complementary DNA binding and minimal signal changes when introduced to non-complementary sequences. b, Concentration dependent binding responses for both nCoV.E and HKU.ORF1 targets incubated on metasurface devices functionalized with only nCoV.E complementary probes. Error bars indicate standard deviations of measurements from N=20 measurements from distinct resonators for each target and concentration condition. The limit of detection is estimated based on the mean + 3 standard deviations of the blank measurements. Dashed lines show fits to the Hill equation (Supplementary Note 8).
Fig. 5.
Fig. 5.. Kinetic binding response and measurement in clinical nasopharyngeal samples.
a, Time-dependent binding responses from 10 distinct resonators exposed to 1 fM, 1pM, 1nM, and 1μM concentrations of nCoV.E target molecules. b, Demonstration of gene fragment detection in clinical nasopharyngeal eluates. Negative samples contain random and scrambled genetic material from nasopharyngeal swabs that have been confirmed negative for SARS-CoV-2 via RT-PCR. Target nCoV.E molecules are spiked into the negative nasopharyngeal eluates at a concentration of 100 nM for the positive sample.

References

    1. Kim D., Quinn J., Pinsky B. A., Shah N. H. & Brown I. Rates of co-infection between sars-cov-2 and other respiratory pathogens. The Journal of the American Medical Association 323, 2085–2086 (2020). - PMC - PubMed
    1. Mahony J. B. Detection of respiratory viruses by molecular methods. Clinical Microbiology Reviews 21, 716–747 (2008). - PMC - PubMed
    1. Ignatiadis M., Sledge G. W. & Jeffrey S. S. Liquid biopsy enters the clinic — implementation issues and future challenges. Nature Reviews Clinical Oncology 18, 297–312 (2021). - PubMed
    1. Heitzer E., Haque I. S., Roberts C. E. & Speicher M. R. Current and future perspectives of liquid biopsies in genomics-driven oncology. Nature Reviews Genetics 20, 71–88 (2019). - PubMed
    1. Zhang Y. et al. A system of coordinated autonomous robots for lagrangian studies of microbes in the oceanic deep chlorophyll maximum. Science Robotics 6 (2021). - PubMed

Publication types

LinkOut - more resources