. 2021 Oct 1;3(4):fcab230.
doi: 10.1093/braincomms/fcab230. eCollection 2021.

Brain regions that support accurate speech production after damage to Broca's area

Affiliations

Brain regions that support accurate speech production after damage to Broca's area

Diego L Lorca-Puls et al. Brain Commun. .

Abstract

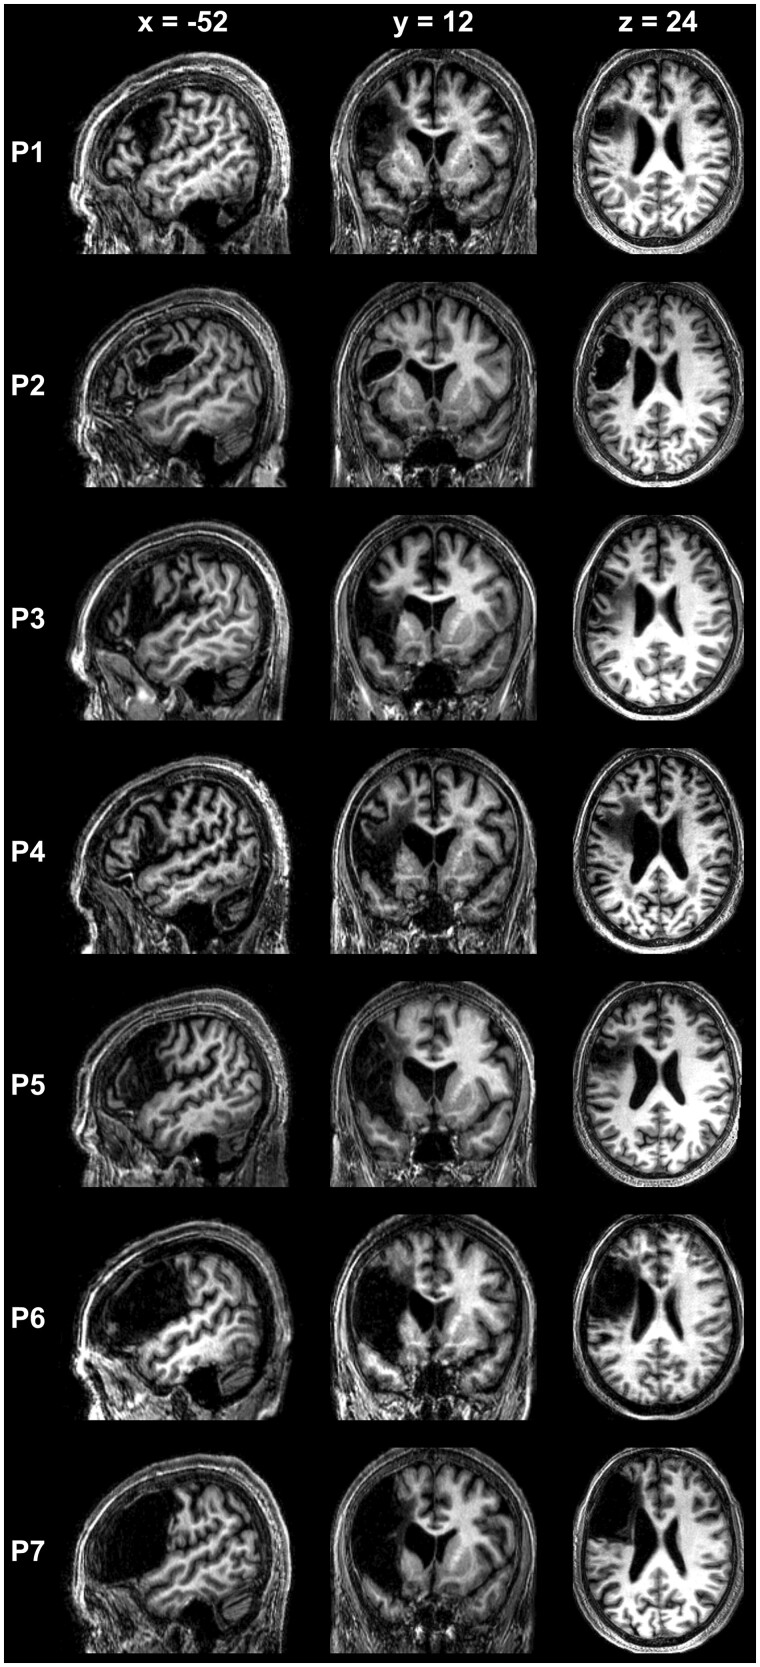
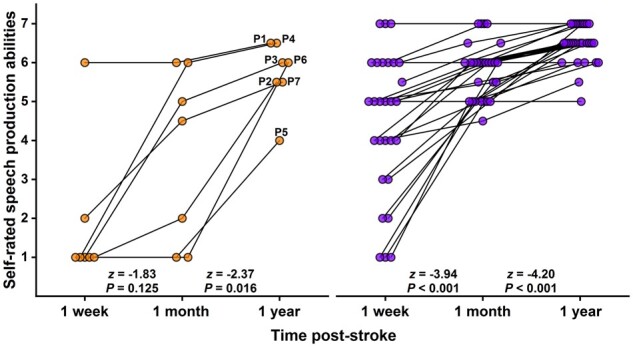
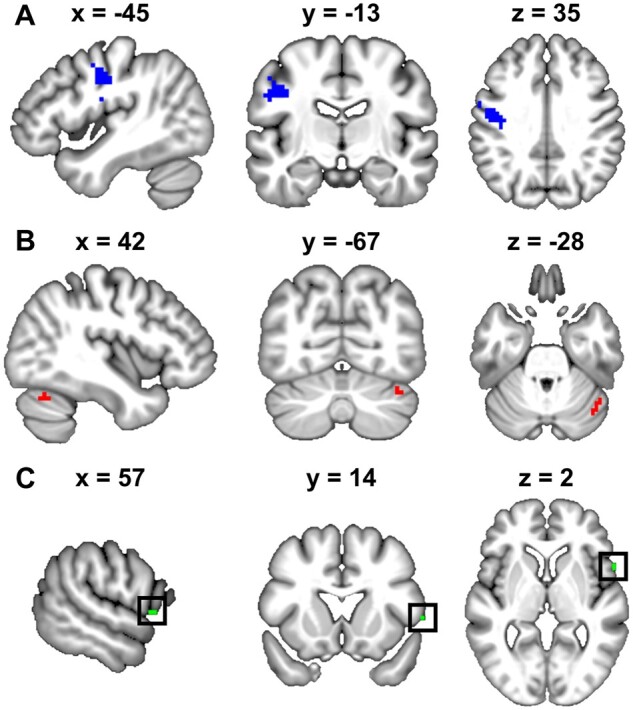
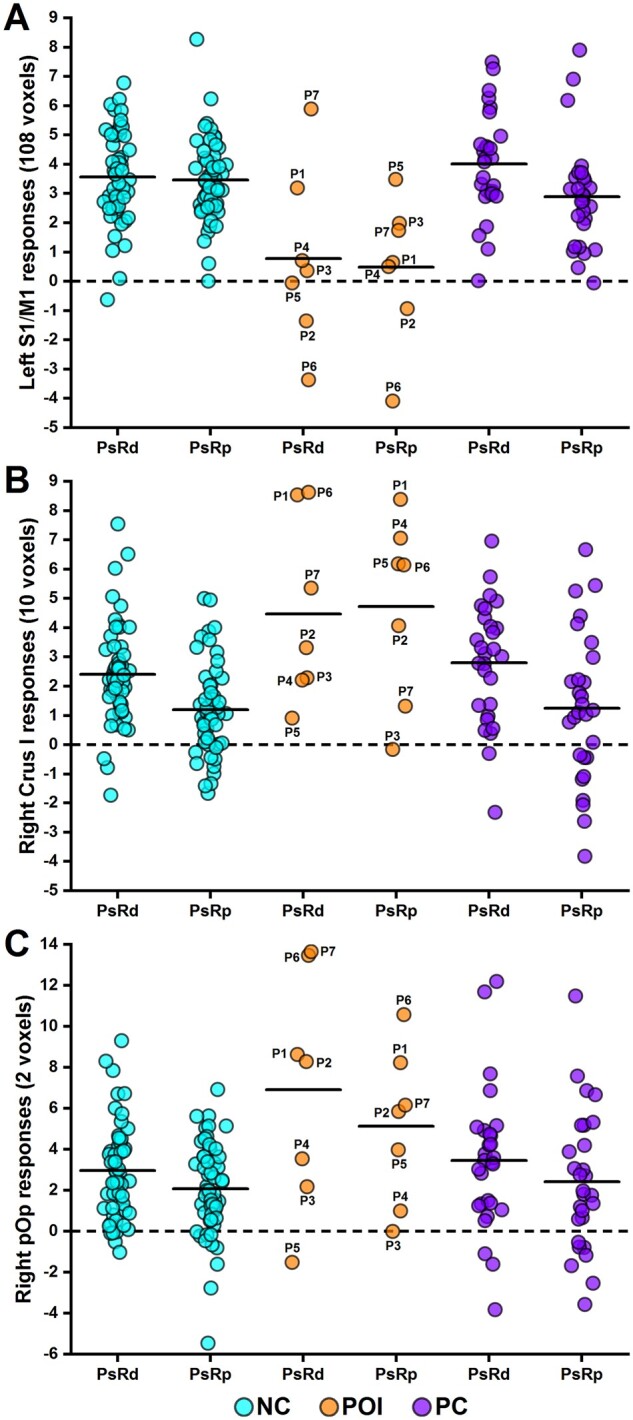
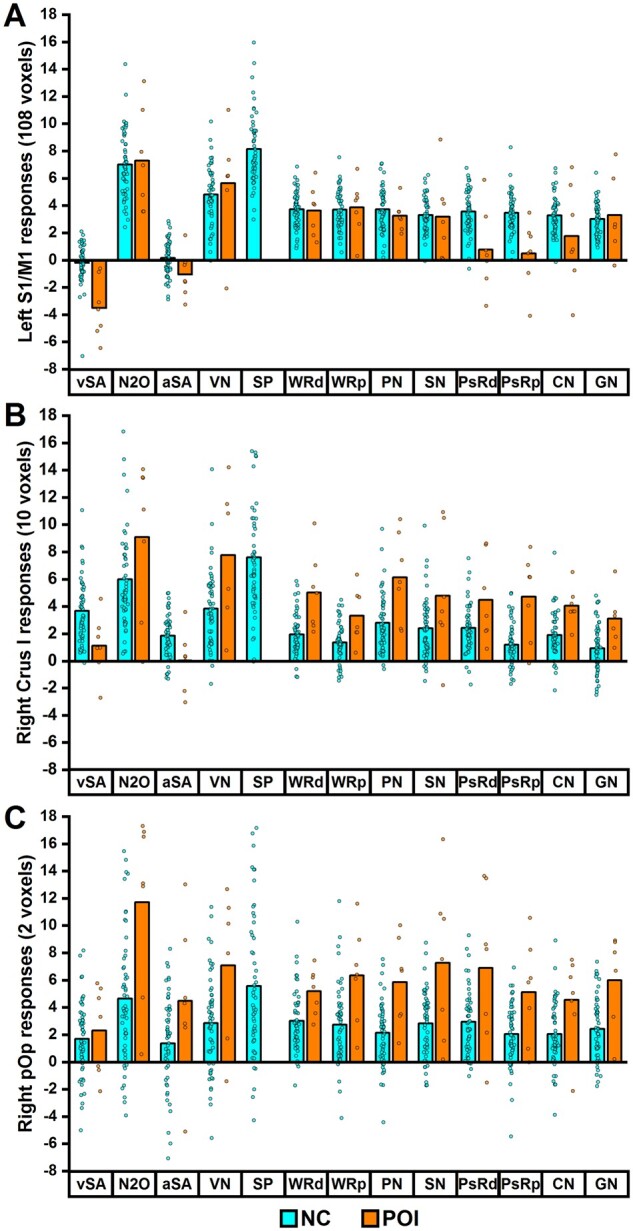
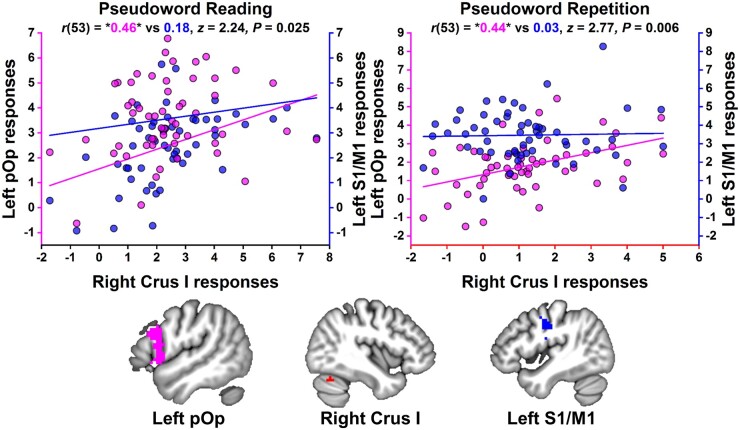
Broca's area in the posterior half of the left inferior frontal gyrus has traditionally been considered an important node in the speech production network. Nevertheless, recovery of speech production has been reported, to different degrees, within a few months of damage to Broca's area. Importantly, contemporary evidence suggests that, within Broca's area, its posterior part (i.e. pars opercularis) plays a more prominent role in speech production than its anterior part (i.e. pars triangularis). In this study, we therefore investigated the brain activation patterns that underlie accurate speech production following stroke damage to the opercular part of Broca's area. By combining functional MRI and 13 tasks that place varying demands on speech production, brain activation was compared in (i) seven patients of interest with damage to the opercular part of Broca's area; (ii) 55 neurologically intact controls; and (iii) 28 patient controls with left-hemisphere damage that spared Broca's area. When producing accurate overt speech responses, the patients with damage to the left pars opercularis activated a substantial portion of the normal bilaterally distributed system. Within this system, there was a lesion-site-dependent effect in a specific part of the right cerebellar Crus I where activation was significantly higher in the patients with damage to the left pars opercularis compared to both neurologically intact and patient controls. In addition, activation in the right pars opercularis was significantly higher in the patients with damage to the left pars opercularis relative to neurologically intact controls but not patient controls (after adjusting for differences in lesion size). By further examining how right Crus I and right pars opercularis responded across a range of conditions in the neurologically intact controls, we suggest that these regions play distinct roles in domain-general cognitive control. Finally, we show that enhanced activation in the right pars opercularis cannot be explained by release from an inhibitory relationship with the left pars opercularis (i.e. dis-inhibition) because right pars opercularis activation was positively related to left pars opercularis activation in neurologically intact controls. Our findings motivate and guide future studies to investigate (i) how exactly right Crus I and right pars opercularis support accurate speech production after damage to the opercular part of Broca's area and (ii) whether non-invasive neurostimulation to one or both of these regions boosts speech production recovery after damage to the opercular part of Broca's area.

Keywords: Broca’s area; aphasia; cerebellum; speech production; stroke.


Figures

Graphical Abstract
Graphical Abstract
Figure 1
Figure 1
Spatially normalized T1-weighted MRI scans of seven patients with LpOp damage. Sagittal, coronal and axial views showing the location and extent of stroke damage in the seven patients of interest with LpOp damage. The scans are sorted from top to bottom by the size of the patient’s lesion (smallest lesion at the top and largest lesion at the bottom). In the PLORAS database, the following identifier was assigned to each patient: P1 = PS1414, P2 = PS0454, P3 = PS0005, P4 = PS0255, P5 = PS0426, P6 = PS0419 and P7 = PS0241.
Figure 2
Figure 2
Self-rated speech production abilities at 1 week, 1 month and 1 year after stroke onset. As shown in the figure, the patients of interest (with LpOp damage; left panel) and patient controls (without LpOp damage; right panel) rated how their speech production abilities were at 1 week, 1 month and 1 year post-stroke. Each patient was prompted to select one of seven discrete categories on a 7-point in-house ordinal scale using the following question: In relation to your ability to speak at 1 week (or 1 month/1 year) after your stroke, were you? ‘unable to attempt’ (= 1), ‘not speaking at all or using gestures’ (= 2), ‘using gestures but not speaking at all’ (= 3), ‘using only 1 or 2 single words’ (= 4), ‘using a few single words’ (= 5), ‘speaking in short sentences’ (= 6), or ‘speaking normally’ (= 7). In addition, patients were offered the option to select between two consecutive categories: e.g. between ‘speaking in short sentences’ and ‘speaking normally’ (= 6.5). Crucially, patients were instructed to disregard difficulties related to slurred speech. There was a statistically significant positive change in self-rated speech production abilities between 1 week and 1 month post-stroke for patient controls, and between 1 month and 1 year post-stroke for both patient groups.
Figure 3
Figure 3
Brain regions where LpOp damage resulted in reduced or enhanced activation during speech production. The top panel shows the region within left sensorimotor cortex (LS1/M1) where activation was reduced in patients with LpOp damage relative to neurologically intact controls. The middle panel shows the region within right cerebellar Crus I (RCrusI) where activation was enhanced in patients with LpOp damage relative to neurologically intact controls. The bottom panel shows, surrounded by a square, the region within right ventral pars opercularis (RpOp) where activation was enhanced (albeit at an uncorrected statistical threshold) in patients with LpOp damage relative to neurologically intact controls.
Figure 4
Figure 4
Inter-subject variability in brain activation during speech production. The plots show the strength of responses (averaged over voxels) in (A) LS1/M1, (B) RCrusI and (C) RpOp, for each individual participant during accurate pseudoword reading (PsRd) or repetition (PsRp). Thick black lines highlight the corresponding group mean. Dashed black lines signal baseline activation during rest periods (= 0). NC, neurologically intact controls; POI, patients of interest (with LpOp damage); PC, patient controls (without LpOp damage).
Figure 5
Figure 5
Response profile of distinct brain regions. The plots show the subject-level (circles) and group-level (bars = mean) activation response in (A) LS1/M1, (B) RCrusI and (C) RpOp, for both 55 neurologically intact controls (NC) and seven patients with LpOp damage (POI) during each of 13 fMRI tasks (vSA to SP = Experiment 1; WRd to GN = Experiment 2). During some tasks, the activation response in RCrusI for one control (N2O = 21.4 and SP = 27.9) and in RpOp for another (aSA = −10.8) fell outside the range of values displayed. Mean activation for each task in each group was calculated after excluding data points from tasks when a participant achieved less than 40% accuracy across trials. In total, five (out of 804) data points were excluded, three from patients with LpOp damage (1 for VN and 2 for SP) and two from neurologically intact controls (1 for aSA and 1 for SP). For statistical analyses, these excluded data points were replaced with the mean activation for that task for that group (mean imputation never occurred for more than a single data point in any given task per group), except for SP in patients with LpOp damage (not shown on plots) due to the high number (3/7) of excluded data points. aSA, auditory semantic associations; CN, naming colour of meaningless pattern; GN, naming gender of voice humming meaningless rhythm; N2O, naming two objects from picture; PN, naming one object from picture; PsRd, pseudoword reading; PsRp, pseudoword repetition; SN, naming one object from sound; SP, sentence production; VN, verb naming; vSA, visual semantic associations; WRd, word reading; WRp, word repetition. The order of presentation in the scanner was slightly different: vSA, N2O, VN, SP, aSA, WRd, WRp, PN, CN, SN, PsRd, PsRp and GN.
Figure 6
Figure 6
Comparison of co-activation strength in neurologically intact controls. The plots show that in 55 neurologically intact controls the relationship between LpOp activation and RCrusI activation (in magenta) was stronger than that between LS1/M1 activation and RCrusI activation (in blue) during both pseudoword reading and repetition. Correlation coefficients surrounded by asterisks were statistically significant at P <0.05. The left pOp region uniquely comprised voxels, within an anatomically defined mask of left pOp, that were activated during both pseudoword reading and repetition in neurologically intact controls at P <0.001 uncorrected.

References

    1. Broca P. Nouvelle observation d'aphémie produite par une lésion de la moitié postérieure des deuxième et troisième circonvolutions frontales. Bull Soci Anat Paris. 1861;36:398–407.
    1. Broca P. Remarques sur le siège de la faculté du langage articulé, suivies d'une observation d'aphémie (perte de la parole). Bull Mém Soc Anat Paris. 1861;6:330–357.
    1. Broca P. Sur le siège de la faculté du langage articulé. Bull Soc Anthropol Paris. 1865;6(1):377–393.
    1. Papoutsi M, de Zwart JA, Jansma JM, Pickering MJ, Bednar JA, Horwitz B. From phonemes to articulatory codes: An fMRI study of the role of Broca's area in speech production. Cereb Cortex. 2009;19(9):2156–2165. - PMC - PubMed
    1. Mugler EM, Tate MC, Livescu K, Templer JW, Goldrick MA, Slutzky MW. Differential representation of articulatory gestures and phonemes in precentral and inferior frontal gyri. J Neurosci. 2018;38(46):9803–9813. - PMC - PubMed

LinkOut - more resources