. 2022 Jan;27(1):e13106.
doi: 10.1111/adb.13106. Epub 2021 Oct 20.

Theta oscillations in rat infralimbic cortex are associated with the inhibition of cocaine seeking during extinction

Affiliations

Theta oscillations in rat infralimbic cortex are associated with the inhibition of cocaine seeking during extinction

Victória A Müller Ewald et al. Addict Biol. 2022 Jan.

Abstract

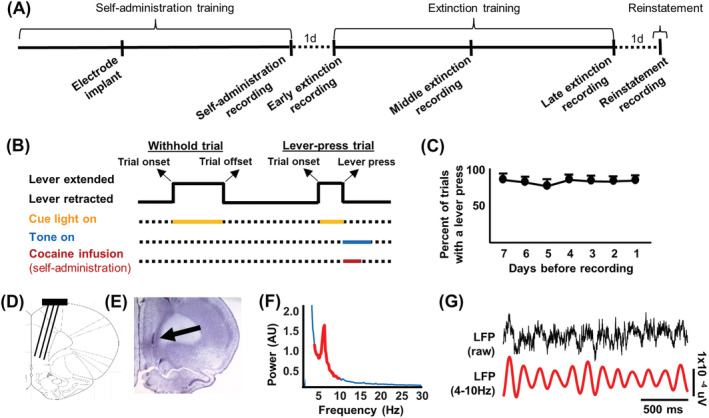
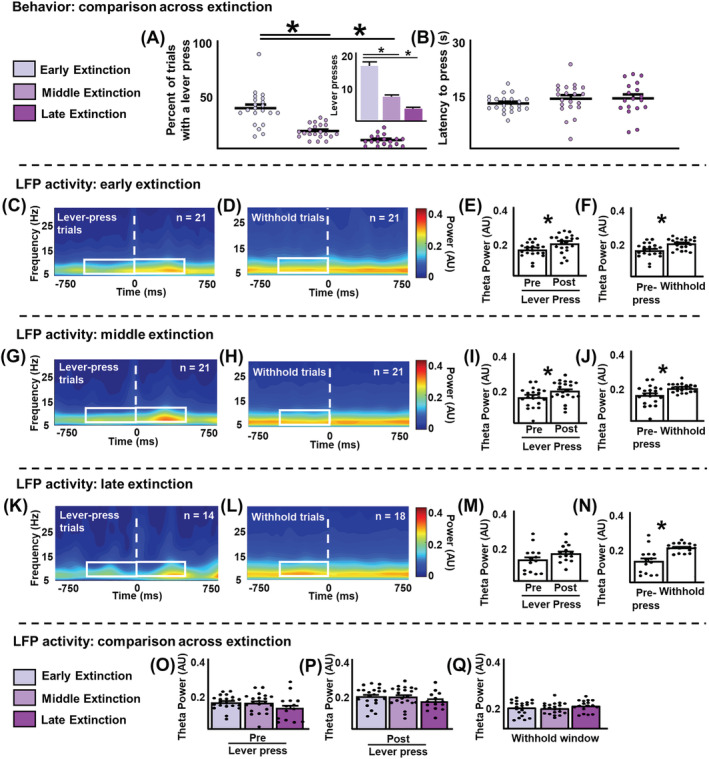
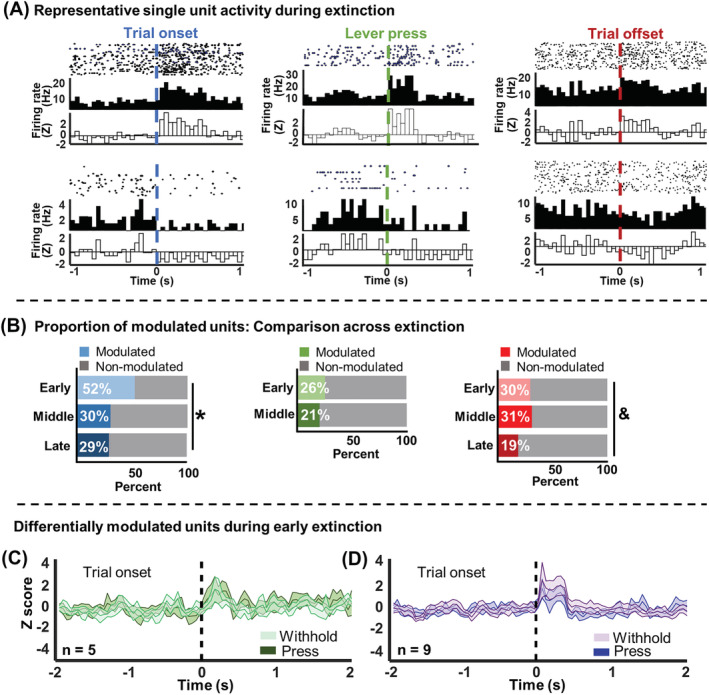
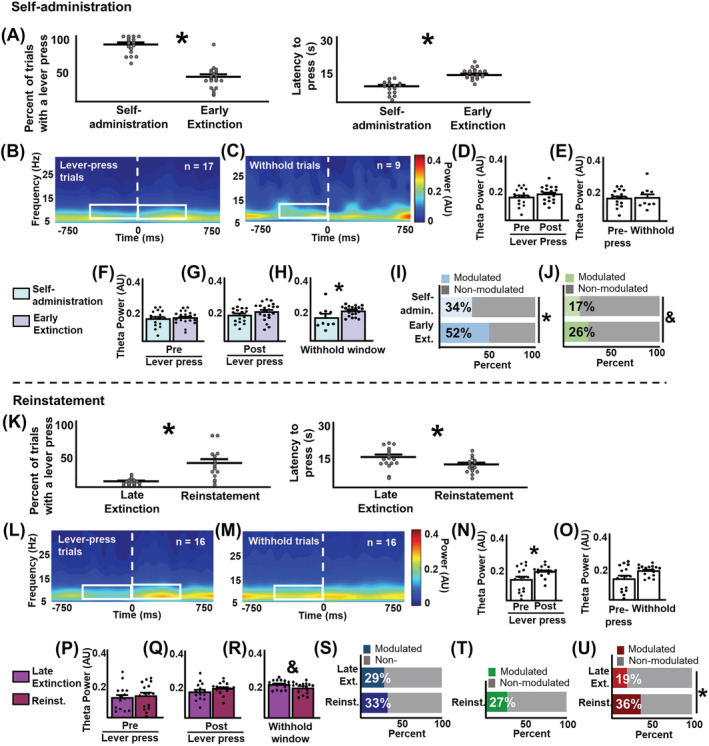
Infralimbic cortical (IL) manipulations indicate that this region mediates extinction learning and suppresses cocaine seeking following cocaine self-administration. However, little work has recorded IL activity during the inhibition of cocaine seeking due to the difficulty of determining precisely when cocaine-seeking behaviour is inhibited within a cocaine-seeking session. The present study used in vivo electrophysiology to examine IL activity across extinction as well as during cocaine self-administration and reinstatement. Sprague-Dawley rats underwent 6-h access cocaine self-administration in which the response lever was available during discrete signalled trials, a procedure which allowed for the comparison between epochs of cocaine seeking versus the inhibition thereof. Subsequently, rats underwent extinction and cocaine-primed reinstatement using the same procedure. Results indicate that theta rhythms (4-10 Hz) dominated IL local-field potential (LFP) activity during all experimental stages. During extinction, theta power fluctuated significantly surrounding the lever press and was lower when rats engaged in cocaine seeking versus when they withheld from doing so. These patterns of oscillatory activity differed from self-administration and reinstatement stages. Single-unit analyses indicate heterogeneity of IL unit responses, supporting the idea that multiple neuronal subpopulations exist within the IL and promote the expression of different and even opposing cocaine-seeking behaviours. Together, these results are consistent with the idea that aggregate synaptic and single-unit activity in the IL represent the engagement of the IL in action monitoring to promote adaptive behaviour in accordance with task contingencies and reveal critical insights into the relationship between IL activity and the inhibition of cocaine seeking.

Keywords: cocaine seeking; cocaine self-administration; in vivo electrophysiology; local-field potential; reinstatement; single units.


Conflict of interest statement

Authors have no conflicts of interest to declare.

Figures

FIGURE 1
FIGURE 1
Procedures and initial behavioural/electrophysiological data. (A) Experimental timeline. In vivo electrophysiological data were analysed for early, middle and late extinction, with ancillary analyses occurring during self‐administration and cocaine‐primed reinstatement. (B) Schematic of behavioural procedures. Trial onset was signalled by lever extension and illumination of a cue light. If no response occurred within 30 s, the lever was retracted, and the intertrial interval ensued (withhold trial). A lever press led to a cocaine infusion (during self‐administration only), a tone cue and lever retraction (lever‐press trial). (C) Self‐administration performance for all rats included in the final analyses across the last 7 days of self‐administration training. (D) Schematic of an electrode implanted in the infralimbic cortical (IL). (E) Cresyl violet staining shows an electrolytic lesion (arrow) marking an electrode implanted in the IL. (F) Representative spectral power distribution for a single channel during early extinction indicated dominant local‐field potential oscillations within the theta range (4–10 Hz, red peak). (G) Representative raw and band‐pass filtered local‐field potential data from a single channel during early extinction verified theta oscillations as the dominant rhythm
FIGURE 2
FIGURE 2
Cocaine‐seeking behaviour and local‐field potentials during extinction. (A) Percentage of trials including a lever press across extinction stages. Rats significantly decreased lever pressing throughout extinction. Dots represent the proportion of trials where a lever press occurred for individual rats. Inset: Same data plotted as the number of lever presses throughout extinction. (B) Latency to lever press during a trial did not change across extinction. (C–F) early extinction. (C and D) averaged power spectrograms centred on the lever press (C) and the withhold window (D). White boxes represent the analysis window (500 ms, 4–10 Hz). (E) Mean theta power surrounding the lever press. Theta power was significantly higher following the lever press, compared with before the lever press. Dots represent averaged theta power values from individual rats. (F) Mean theta power before the lever press versus during the withhold window. Theta power was lower during lever‐press trials compared with withhold trials. (G–J) middle extinction. (G and H) averaged power spectrograms centred on the lever press (G) and the withhold window (H). As with early extinction, theta power was significantly higher following the lever press compared with before the lever press (I) and was lower during lever‐press trials compared to withhold trials (J). (K–N) late extinction. (K and L) averaged power spectrograms centred on the lever press (K) and the withhold window (L). Differing from previous extinction stages, theta power before and after the lever press did not significantly differ (M). However, like previous extinction stages, theta power was lower during lever‐press trials compared to withhold trials (N). (O–Q) comparison across extinction stages. Mean theta power did not differ between extinction stages before the lever press (O), after the lever press (P), and during the withhold window (Q). *p < 0.05
FIGURE 3
FIGURE 3
Single unit activity during extinction. (A) Peri‐event histogram and raster plots of IL single units that significantly increased (top) or decreased (bottom) firing rates in response to trial onset (left), the lever press (middle), and trial offset (right). (B) Proportion of units modulated by experimental events across extinction stages. (left) significantly more units were modulated by trial onset during early extinction than during middle or late extinction. (middle) there were no significant differences in the number of units modulated by the lever press between early and middle extinction stages. Late extinction was not included because there were not enough lever press events during this time point for reliable analysis. (right) there was a trend towards a decrease in the percentage of units modulated by trial offset during late extinction compared with other extinction stages. (C and D) averaged activity for pre‐motor units identified during early extinction. Middle line represents the mean z‐scored firing rate with shading indicating ±SEM. (C) Units that were only significantly modulated by trial onset when the rat subsequently pressed the lever. Light green and dark green show withhold and lever‐press trials, respectively. (D) Units that were only significantly modulated by trial onset when rats withheld from lever pressing throughout the trial. Light purple and dark purple show withhold and lever‐press trials, respectively. *p < 0.05. &p < 0.1
FIGURE 4
FIGURE 4
Ancillary analyses: Self‐administration and reinstatement. (A–J) self‐administration. (A) Percentage of lever‐press trials (left) and latency to press the lever during a trial (right) during self‐administration compared to early extinction. During self‐administration, rats pressed the lever significantly more and had significantly shorter latencies to press the lever compared to early extinction. (B and C) averaged spectrograms showing local‐field activity centred on the lever press (B) and the withhold window (C). White boxes represent the analysis window (500 ms, 4–10 Hz). (D and E) different from what was observed during extinction, mean theta power did not significantly differ before vs. after the lever press (D) or during lever‐press versus withhold trials. (F–J) neurophysiological comparisons between self‐administration and early extinction. Theta power did not differ between sessions before the lever press (F) and after the lever press (G). Theta power during the withhold window was significantly lower during self‐administration than during early extinction (H). (I) Significantly fewer units were modulated by trial onset during self‐administration compared to early extinction. (J) There was a trend towards fewer units modulated by the lever press during self‐administration compared with early extinction. (K–U) reinstatement. (K) Percentage of lever‐press trials (left) and latency to press the lever (right) during reinstatement. During reinstatement, rats pressed the lever significantly more and had significantly shorter latencies to press the lever compared with late extinction. (L and M) averaged spectrograms showing local‐field activity centred on the lever press (L) and the withhold window (M). (N) Mean theta power was significantly higher after the lever press. (O) Theta power did not significantly differ between lever‐press and withhold trials. (P–U) local‐field potential comparisons between late extinction and reinstatement. Theta power before the lever press (P) and after the lever press (Q) did not differ between stages. There was a trend towards decreased theta power during the withhold window during reinstatement (R). (S) the proportion of units modulated by trial onset did not differ between stages. (T) Proportion of units modulated by the lever press during reinstatement. Late extinction was not analysed because there were not enough lever press events to generate reliable analyses. (U) Significantly more units were modulated by trial offset during reinstatement than during late extinction. *p < 0.05. &p < 0.1

Similar articles

Cited by

References

    1. Muller Ewald VA, LaLumiere RT. Neural systems mediating the inhibition of cocaine‐seeking behaviors. Pharmacol Biochem Behav. 2018;174:53‐63. - PMC - PubMed
    1. Van den Oever MC, Lubbers BR, Goriounova NA, et al. Extracellular matrix plasticity and GABAergic inhibition of prefrontal cortex pyramidal cells facilitates relapse to heroin seeking. Neuropsychopharmac: Off Publ Am Coll Neuropsychopharmacol. 2010;35(10):2120‐2133. - PMC - PubMed
    1. Van den Oever MC, Rotaru DC, Heinsbroek JA, et al. Ventromedial prefrontal cortex pyramidal cells have a temporal dynamic role in recall and extinction of cocaine‐associated memory. J Neurosci. 2013;33(46):18225‐18233. - PMC - PubMed
    1. Muller Ewald VA, De Corte BJ, Gupta SC, et al. Attenuation of cocaine seeking in rats via enhancement of infralimbic cortical activity using stable step‐function opsins. Psychopharmacology (Berl). 2019;236(1):479‐490. - PMC - PubMed
    1. Augur IF, Wyckoff AR, Aston‐Jones G, Kalivas PW, Peters J. Chemogenetic Activation of an Extinction Neural Circuit Reduces Cue‐Induced Reinstatement of Cocaine Seeking. J Neurosci. 2016;36(39):10174‐10180. - PMC - PubMed

Publication types