

The impact of individual variation on abrupt collapses in mutualistic networks
- PMID: 34672068
- PMCID: PMC9297894
- DOI: 10.1111/ele.13895
The impact of individual variation on abrupt collapses in mutualistic networks
Abstract
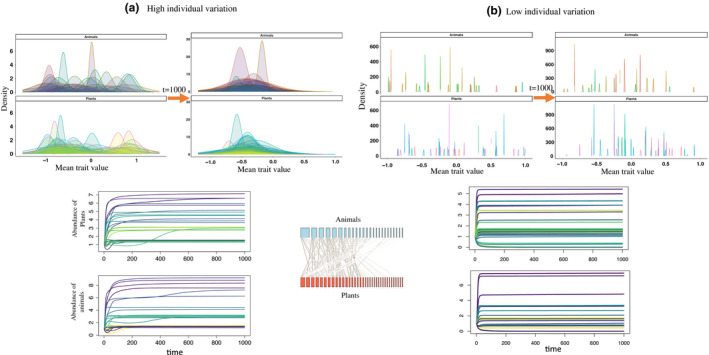
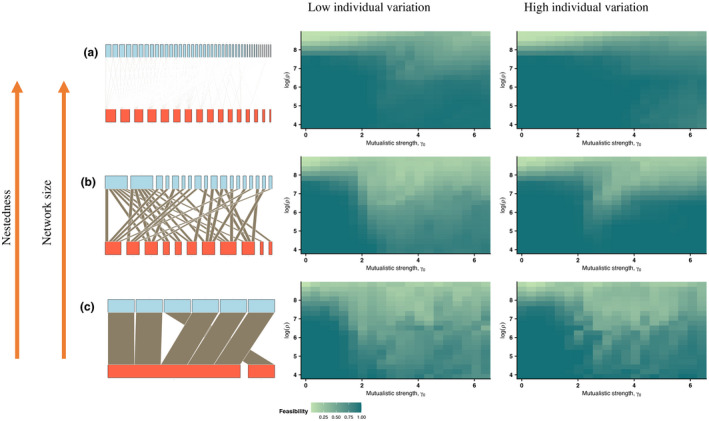
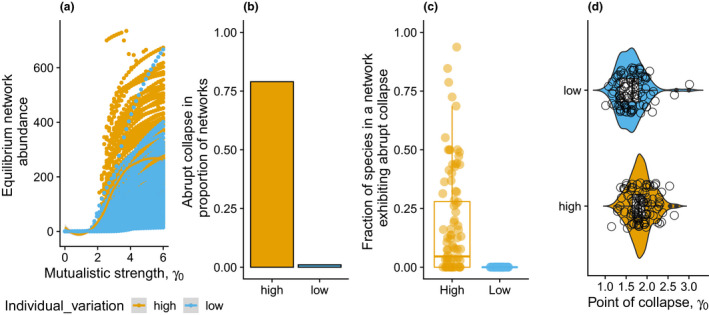
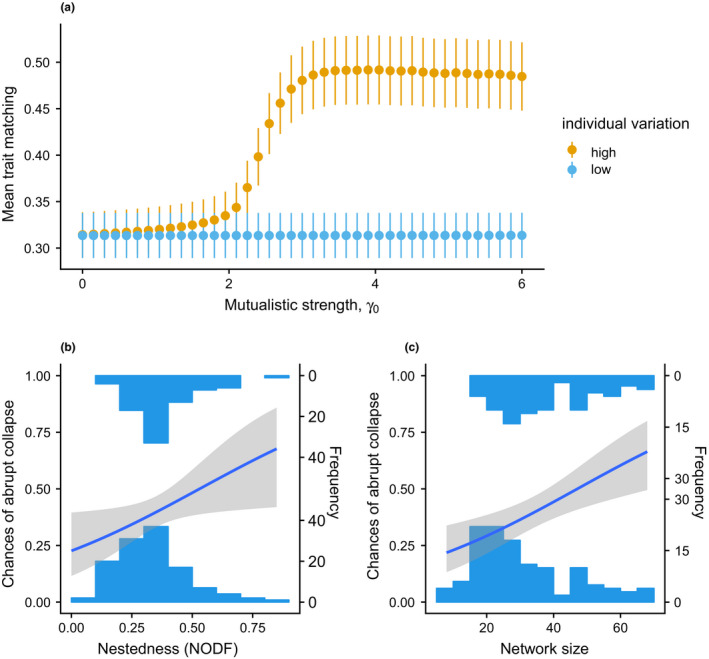
Individual variation is central to species involved in complex interactions with others in an ecological system. Such ecological systems could exhibit tipping points in response to changes in the environment, consequently leading to abrupt transitions to alternative, often less desirable states. However, little is known about how individual trait variation could influence the timing and occurrence of abrupt transitions. Using 101 empirical mutualistic networks, I model the eco-evolutionary dynamics of such networks in response to gradual changes in strength of co-evolutionary interactions. Results indicated that individual variation facilitates the timing of transition in such networks, albeit slightly. In addition, individual variation significantly increases the occurrence of large abrupt transitions. Furthermore, topological network features also positively influence the occurrence of such abrupt transitions. These findings argue for understanding tipping points using an eco-evolutionary perspective to better forecast abrupt transitions in ecological systems.
Keywords: co-evolution; eco-evolutionary dynamics; individual variation; mutualistic networks; population collapses; tipping points.
© 2021 The Author. Ecology Letters published by John Wiley & Sons Ltd.
Figures
Similar articles
-
Stability, resilience and eco-evolutionary feedbacks of mutualistic networks to rising temperature.J Anim Ecol. 2024 Aug;93(8):989-1002. doi: 10.1111/1365-2656.14118. Epub 2024 Jun 10. J Anim Ecol. 2024. PMID: 38859669
-
An individual-based model for the eco-evolutionary emergence of bipartite interaction networks.Ecol Lett. 2020 Nov;23(11):1623-1634. doi: 10.1111/ele.13592. Epub 2020 Sep 4. Ecol Lett. 2020. PMID: 32885919
-
Ecosystem tipping points in an evolving world.Nat Ecol Evol. 2019 Mar;3(3):355-362. doi: 10.1038/s41559-019-0797-2. Epub 2019 Feb 18. Nat Ecol Evol. 2019. PMID: 30778190 Review.
-
The fundamental benefits of multiplexity in ecological networks.J R Soc Interface. 2022 Sep;19(194):20220438. doi: 10.1098/rsif.2022.0438. Epub 2022 Sep 28. J R Soc Interface. 2022. PMID: 36167085 Free PMC article.
-
Seeing through the static: the temporal dimension of plant-animal mutualistic interactions.Ecol Lett. 2021 Jan;24(1):149-161. doi: 10.1111/ele.13623. Epub 2020 Oct 19. Ecol Lett. 2021. PMID: 33073900 Review.
Cited by
-
Rising temperature drives tipping points in mutualistic networks.R Soc Open Sci. 2023 Feb 1;10(2):221363. doi: 10.1098/rsos.221363. eCollection 2023 Feb. R Soc Open Sci. 2023. PMID: 36756070 Free PMC article.
-
Reviving collapsed plant-pollinator networks from a single species.PLoS Biol. 2024 Oct 4;22(10):e3002826. doi: 10.1371/journal.pbio.3002826. eCollection 2024 Oct. PLoS Biol. 2024. PMID: 39365839 Free PMC article.
-
When Do Trait-Based Higher Order Interactions and Individual Variation Promote Robust Species Coexistence?Ecol Evol. 2025 Apr 25;15(4):e71336. doi: 10.1002/ece3.71336. eCollection 2025 Apr. Ecol Evol. 2025. PMID: 40290388 Free PMC article.
-
Community structure determines the predictability of population collapse.J Anim Ecol. 2022 Sep;91(9):1880-1891. doi: 10.1111/1365-2656.13769. Epub 2022 Jul 10. J Anim Ecol. 2022. PMID: 35771158 Free PMC article.
References
-
- Agosta, S.J. & Janzen, D.H. (2005) Body size distributions of large Costa Rican dry forest moths and the underlying relationship between plant and pollinator morphology. Oikos, 108, 183–193.
-
- Allesina, S. & Tang, S. (2012) Stability criteria for complex ecosystems. Nature, 483, 205–208. - PubMed
-
- Almeida‐Neto, M. , Guimarães, P. , Guimarães, P.R. , Loyola, R.D. & Ulrich, W. (2008) A consistent metric for nestedness analysis in ecological systems: reconciling concept and measurement. Oikos, 117, 1227–1239.
-
- Arkilanian, A.A. , Clements, C.F. , Ozgul, A. & Baruah, G. (2020) Effect of time series length and resolution on abundance‐ and trait‐based early warning signals of population declines. Ecology, 101(7), e03040. - PubMed
-
- Barabas, G. & D’Andrea, R. (2016) The effect of intraspecific variation and heritability on community pattern and robustness. Ecology Letters, 19, 977–986. - PubMed
Publication types
MeSH terms
LinkOut - more resources
Full Text Sources
