Multicenter Study
. 2021 Dec;13(8):2442-2456.
doi: 10.1111/os.13161. Epub 2021 Oct 20.

A New Three-Dimensional Classification of Proximal Tibiofibular Fractures: A Multicenter Study

Affiliations
Multicenter Study

A New Three-Dimensional Classification of Proximal Tibiofibular Fractures: A Multicenter Study

Li-Ping Wu et al. Orthop Surg. 2021 Dec.

Abstract

Objectives: To propose an updated definition of proximal tibia and fibula fracture (PTFF) and establish a three-dimensional (3D) structure-based classification of PTFF.

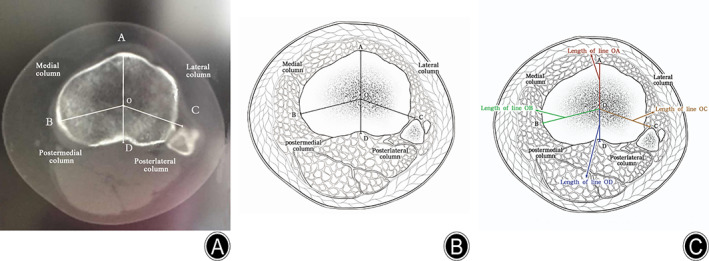
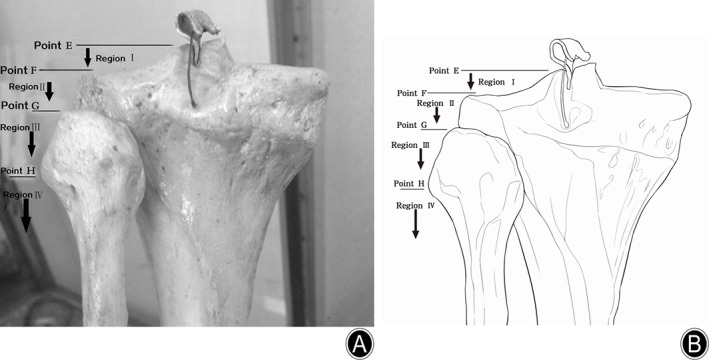
Methods: In total, 1358 adult patients (837 males and 521 females; 43.61 ± 15.13 years, 1364 affected knees) who were diagnosed with PTFF at the departments of orthopaedic surgery of four hospitals from January 2010 to December 2019 were enrolled. The new classification of PTFF, termed Wu classification, included three parts: classification of columns in the horizontal plane, regions in the frontal plane, and segments in the sagittal plane. All PTFFs were classified according to Schatzker, Luo, and Wu classification systems. Additionally, the incidence and characteristics of PTFFs were analyzed.

Results: The major internal structural fractures of PTFF were tibial plateau fracture (TPF) only (725, 53.15%), TPF and proximal fibular fracture (274, 20.09%), and isolated avulsion fracture of the posterior cruciate ligament (PCL) (189, 13.86%). Approximately a quarter of PTFF cases could not be classified using Schatzker or Luo classifications, but all PTFF cases could be classified using Wu classification. The most frequent PTFFs included all four columns in region IV, segment 2 (235, 17.23%); the posterolateral and posteromedial columns in region II, segment 2 (191, 14.00%); and the lateral and posterolateral columns in region IV, segment 2 (136, 9.97%). Isolated avulsion fracture of the anterior cruciate ligament (ACL) was categorized as three injury types, most of which involved the lateral and medial columns in region II, segment 1 (40/63, 64%). More than 97% of cases of isolated fractures of the PCL involved the posterolateral and posteromedial columns in region II, segment 2. The most frequent combined avulsion fracture of the ACL and PCL included all four columns in region II, segment 2 (18/24, 75%). All of the isolated avulsion fractures of the ACL were located in segment 1, and all those of the PCL in segment 2. The most common type of isolated proximal fibular fracture involved the posterolateral column in region III, segment 2 (23/26, 88%). The most frequent combined TPF and proximal fibular fracture involved all four columns in region IV, segment 2 (107/274, 39.05%).

Conclusions: All cases of PTFF could be classified by the new 3D Wu classification which should be beneficial for clinical diagnosis, guidance of treatment, statistical analysis, academic communication, and prognosis, and the most frequent PTFF involved all four columns in region IV, segment 2.

Keywords: Classification; Fibula; Fracture; Knee joint; Tibia.


Figures

Fig. 1
Fig. 1
An updated definition of the proximal tibia and fibula (image A). In the frontal view of the knee using anterior–posterior X‐ray imaging, a straight line was drawn from the innermost point (C) of the articular surface in the medial plateau of the tibia to the outermost point (D) of the articular surface of the lateral plateau of the tibia. Line AB, which is parallel to line CD, passes through point O, the highest point of the intercondylar eminence of the tibial plateau. Line OG is a straight line, perpendicular to line AB, with the same length as line CD. Line EF, parallel to line AB, passes through point G. The areas of the tibia and fibula between lines AB and EF were defined as the proximal tibia and fibula, respectively, and a fracture in this area was defined as a proximal tibia and fibula fracture. The measure method schematic diagram in length of line CD (image B).
Fig. 2
Fig. 2
Definition of columns in Wu classification. A computed‐tomography image (image A) and freehand schematic diagram (image B) of the head of the fibula in the horizontal plane are indicated. Point O is the center of the tibial plateau. Point A represents the most anterior point of the proximal tibia, located in the anterior tibial tubercle. Point B is the posteromedial point of the proximal tibia. Point C is the most anterior point of the fibular head. A straight line is drawn from point A to O, and extended. The intersection of this line with the posterior margin of the proximal tibia is point D. Point O is also connected to points B and C using straight lines. As a result, the tibial plateau is divided into a lateral column (bordered by line AOC), a medial column (bordered by line AOB), a posteromedial column (bordered by line BOD), and a posterolateral column (bordered by line COD). The measure method freehand schematic diagram in length of line OA, OB, OC, and OD (image C).
Fig. 3
Fig. 3
Definition of regions in Wu classification. A photograph (image A) and freehand schematic diagram (image B) in the posterior view of the proximal tibia and fibula are indicated. Point E is the highest point of the intercondylar eminence in the tibial plateau. Point F is the outermost point of the cortical surface in the lateral tibial plateau. Point G is the highest point of the fibular head, and point H is outermost lateral point of the fibular head. Region I is the area between points E and F, consisting completely of the tibial intercondylar eminence. Region II is the area between points F and G. Region III is the area between points G and H. Region IV is the area below point H. The determination of the region is based on the lowest point of the fracture.
Fig. 4
Fig. 4
Definition of segments in Wu classification. A lateral X‐ray of the knee image (image A) and freehand schematic diagram (image B) in the sagittal plane of the proximal tibia and fibula are indicated. A straight line (IJ) is drawn along the posterior cortical margin of the tibia. When this line is extended superiorly, its intersection with the cortical surface of the tibial plateau is point K. Point L is the anterior point of the tibial tubercle. Line LM is parallel to line IK. Point N is the posterior point of the proximal fibula. Line NP is parallel to lines IK and LM. Segment 1 is the area between lines LM and IK, and segment 2 is the area between lines IK and NP. The determination of the segment is based on the posterior point of the fracture line. The measure method freehand schematic diagram in distance between lines LM and IK and distance between lines LM and NP (image C).
Fig. 5
Fig. 5
Wu Classification of a complex proximal tibia and fibula fracture. A 41‐year‐old female patient sustained fractures of the left tibial plateau and proximal fibula due to a traffic accident in February 2019. There is type II of Schatzker classification from X‐ray imaging (A, B), lateral and poster columns of Luo classification from CT (C). According to the Wu classification, based on results of CT (C, D, E, F), and 3D reconstruction (G, H, I), the fracture was located in the lateral and posterolateral columns, region IV, and segment 2.
Fig. 6
Fig. 6
Measure method freehand schematic diagram in vertical length of the point E and point F, point E and point G, point E and point H on the coronal plane projection. In the posterior view of the proximal tibia and fibula, point E1 is the projection point of point E on the coronal plane, point F1 is the projection point of point F on the coronal plane, point G1 is the projection point of point G on the coronal plane, and point H1 is the projection point of point H on the coronal plane. The vertical length of point E and point F, point E and point G, point E and point H on the coronal plane projection (cm) was to measure the distance between point E1 and point F1, point E1 and point G1, point E1 and point H1.
Fig. 7
Fig. 7
Wu Classification of isolated avulsion fracture of the PCL. A 40‐year‐old female patient sustained fractures of the right isolated avulsion fracture of the PCL due to fall from bicycle in September 2018. It cannot be classified using the Schatzker classification from X‐ray imaging (A, B), poster column of Luo classification from CT (C). According to the Wu classification, based on results of CT (C, D, E) and 3D reconstruction (F, G, H), the fracture was located in the posterolateral and posteromedial columns in region II, segment 2.
Fig. 8
Fig. 8
Wu Classification of isolated proximal fibular fracture. A 65‐year‐old male patient sustained fractures of the left isolated proximal fibular fracture due to a traffic accident in January 2013. It cannot be classified using the Schatzker classification from X‐ray imaging (A, B), and Luo classification from CT (C). According to the Wu classification, based on results of CT (C, D, E) and 3D reconstruction (F, G, H), the fracture was located in posterolateral column in region IV, segment 2.

Similar articles

Cited by

References

    1. Liu YW, Li YH, Yu T, Yang T, Li Y, Tan L. Popliteal artery transection associated with a minimally displaced tibial plateau fracture: a case report and review of the literature. BMC Musculoskelet Disord, 2020, 21: 59. - PMC - PubMed
    1. Bernholt DL, DePhillipo NN, Crawford MD, Aman ZS, Grantham WJ, LaPrade RF. Incidence of displaced posterolateral tibial plateau and lateral femoral condyle impaction fractures in the setting of primary anterior cruciate ligament tear. Am J Sports Med, 2020, 48: 545–553. - PubMed
    1. Yi Z, Hui S, Binbin Z, et al. A new strategy to fix posterolateral depression in tibial plateau fractures: introduction of a new modified Frosch approach and a "barrel hoop plate" technique. Injury, 2020, 51: 723–734. - PubMed
    1. Xie X, Zhan Y, Wang Y, Lucas JF, Zhang Y, Luo C. Comparative analysis of mechanism‐associated 3‐dimensional tibial plateau fracture patterns. J Bone Joint Surg Am, 2020, 102: 410–418. - PubMed
    1. Zheng ZL, Yu YY, Chang HR, Liu H, Zhou HL, Zhang YZ. Establishment of classification of tibial plateau fracture associated with proximal fibular fracture. Orthop Surg, 2019, 11: 97–101. - PMC - PubMed

Publication types