Meta-Analysis
. 2021 Oct;24(10):e25818.
doi: 10.1002/jia2.25818.

Declining HIV incidence in sub-Saharan Africa: a systematic review and meta-analysis of empiric data

Affiliations
Meta-Analysis

Declining HIV incidence in sub-Saharan Africa: a systematic review and meta-analysis of empiric data

Keya Joshi et al. J Int AIDS Soc. 2021 Oct.

Abstract

Introduction: UNAIDS models suggest HIV incidence is declining in sub-Saharan Africa. The objective of this study was to assess whether modelled trends are supported by empirical evidence.

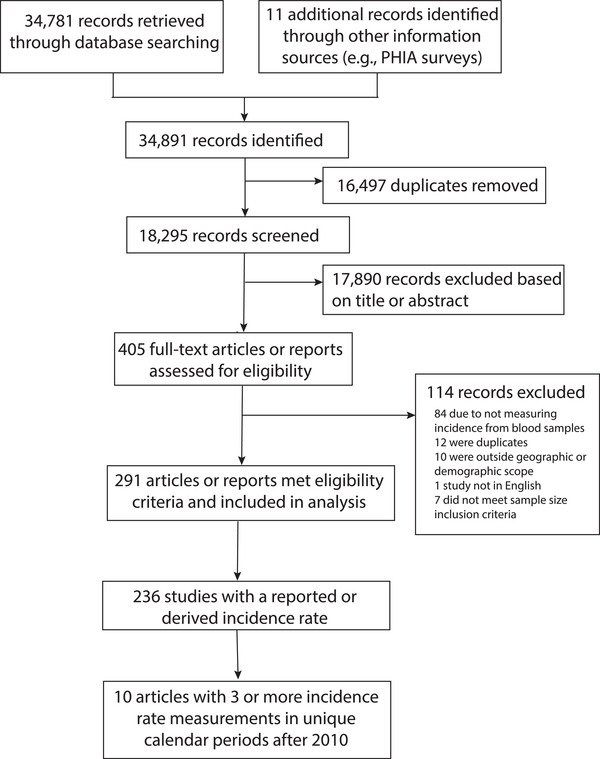
Methods: We conducted a systematic review and meta-analysis of adult HIV incidence data from sub-Saharan Africa by searching Embase, Scopus, PubMed and OVID databases and technical reports published between 1 January 2010 and 23 July 2019. We included prospective and cross-sectional studies that directly measured incidence from blood samples. Incidence data were abstracted according to population risk group, geographic location, sex, intervention arm and calendar period. Weighted regression models were used to assess incidence trends across general population studies by sex. We also identified studies reporting greater than or equal to three incidence measurements since 2010 and assessed trends within them.

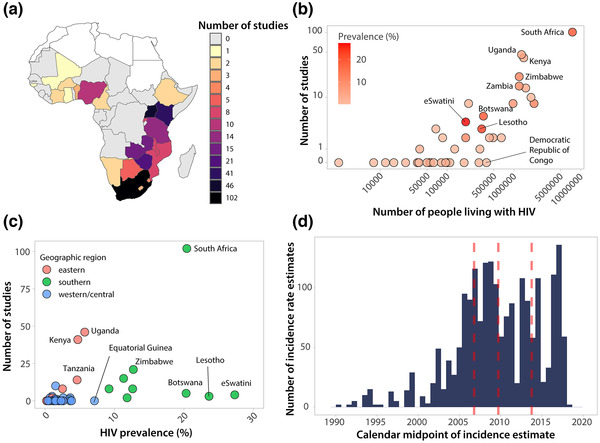
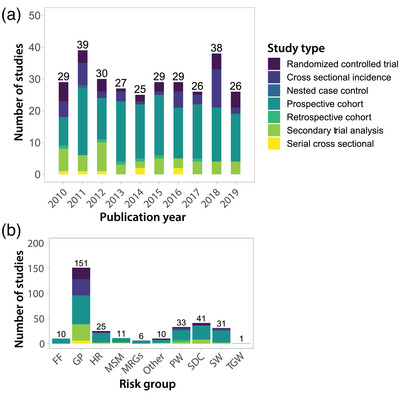
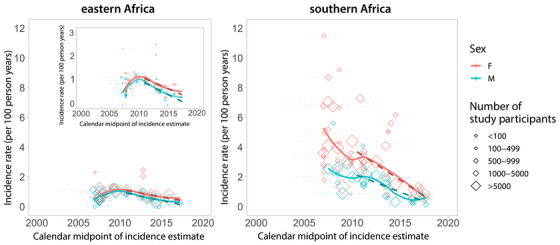
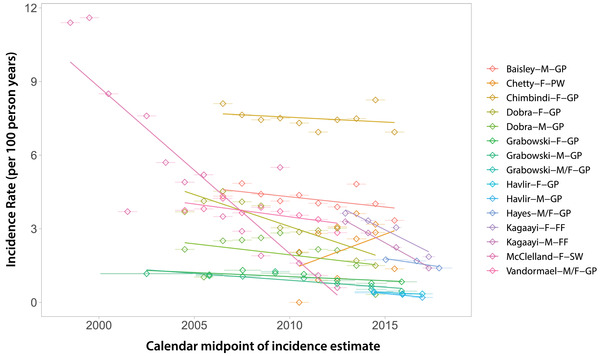
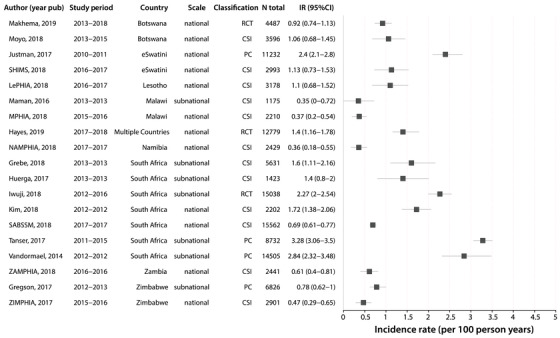
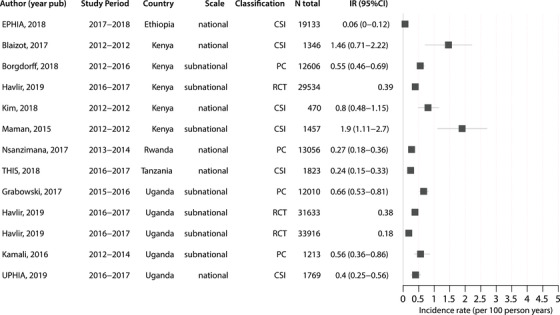
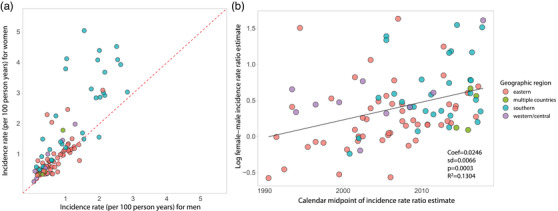
Results: Total 291 studies, including 22 sub-Saharan African countries, met inclusion criteria. Most studies were conducted in South Africa (n = 102), Uganda (n = 46) and Kenya (n = 41); there were 26 countries with no published incidence data, most in western and central Africa. Data were most commonly derived from prospective observational studies (n = 163; 56%) and from geographically defined populations with limited demographic or risk-based enrolment criteria other than age (i.e., general population studies; n = 151; 52%). Across general population studies, average annual incidence declines since 2010 were 0.12/100 person-years (95% CI: 0.06-0.18; p = 0.001) among men and 0.10/100 person-years (95% CI: -0.02-0.22; p = 0.093) among women in eastern Africa, and 0.25/100 person-years (95% CI: 0.17-034; p < 0.0001) among men and 0.42/100 person-years (95% CI: 0.23-0.62; p = 0.0002) among women in southern Africa. In nine of 10 studies with multiple measurements, incidence declined over time, including in two studies of key populations. Across all population risk groups, the highest HIV incidence estimates were observed among men who have sex with men, with rates ranging from 1.0 to 15.4/100 person-years. Within general population studies, incidence was typically higher in women than men with a median female-to-male incidence rate ratio of 1.47 (IQR: 1.11 to 1.83) with evidence of a growing sex disparity over time.

Conclusions: Empirical incidence data show the rate of new HIV infections is declining in eastern and southern Africa. However, recent incidence data are non-existent or very limited for many countries and key populations.

Keywords: Africa; HIV epidemiology; HIV incidence; HIV prevention; clinical trials; cohort studies; key and vulnerable populations.


Conflict of interest statement

The authors declare that they have no competing interests.

Figures

Figure 1
Figure 1
Flow of papers from literature search to full‐text review. Total 34,781 papers published between 2010 and 2019 were identified through PubMed, Embase, Scopus and OVID global health, and 11 additional papers were identified through alternative sources including population‐based HIV impact assessment (PHIA) surveys. Of these, 16,497 duplicates were removed using Covidence. Of the 18,295 studies screened, 291 papers met eligibility criteria and were included in the analysis.
Figure 2
Figure 2
Number of studies reporting empirical HIV incidence data published between 2010 and 2019 by location, HIV burden and study period. (a) Number of studies by country in sub‐Saharan Africa. Studies only reporting incidence data across countries (e.g., South Africa and Zambia combined) were not included. (b) Number of studies by number of people living with HIV. Number of people living with HIV taken as the mean estimated number of adults (15+) living with HIV in 2018 from UNAIDS. (c) Number of studies by HIV prevalence and region. Prevalence taken as the 2018 adult (15 to 49) prevalence estimate from UNAIDS. (d) Distribution of calendar midpoints for HIV incidence rate estimates. The median and interquartile ranges of calendar midpoints are shown in red.
Figure 3
Figure 3
Number of studies reporting empirical HIV incidence data by year and risk group. (a) Number of studies published by calendar year broken down by study type. (b) Number of studies published by risk group broken down by study type. FF, fisherfolk; GP, general population; HR, high risk (e.g., women who report multiple partners); MSM, men who have sex with men; MSRG, multiple risk groups (e.g., SW and MSM); PW, pregnant women; SDC, serodiscordant couples; SW, sex workers; TGW, transgender women.
Figure 4
Figure 4
HIV incidence rates in general population studies over time by sex for eastern and southern Africa. We included incidence rate estimates from general population studies in southern and eastern Africa that had a study midpoint from 2007 onwards (this corresponds to the 25th percentile of all calendar midpoints reported, Figure 2d). Diamonds represent the calendar midpoint of the incidence rate estimate, while error bars represent the start and end date of the time interval over which the incidence rate was measured. Estimates are only shown for studies with an age range spanning 26 years or greater (e.g., an HIV estimate for individuals 18 to 44 years). Dashed lines show incidence trends fit using linear regression. Solid lines represent smoothed curves fit using LOESS regression. An inset is included for eastern Africa to highlight trends with a y‐axis restricted to three per 100 person‐years.
Figure 5
Figure 5
HIV incidence trends from 10 studies with three or more incidence rate measurements after 2010. Data are shown overall and disaggregated by sex where possible. The legend shows the first author, sex (M, male; F, female) and risk group (GP, general population; PW, pregnant women; FF, fisherfolk; SW, sex worker).
Figure 6
Figure 6
Forest plot of HIV incidence estimates after 2010 for general population studies in southern Africa. Only the most recent HIV incidence estimate for a cohort/study population is shown. Incidence rates are reported as the number of new cases per 100 person‐years and the error bars represent 95% CI. Study references are reported in Table S1. RCT, randomized controlled trial; CSI, cross‐sectional incidence study; PC, prospective cohort.
Figure 7
Figure 7
Forest plot of HIV incidence estimates after 2010 for general population studies in eastern Africa. Only the most recent HIV incidence estimate for a cohort/study population is shown. Incidence rates are reported as the number of new cases per 100 person‐years and the error bars represent 95% CI. Estimates without error bars did not report a confidence interval/standard error for the estimate. Study references are reported in Table S1. PC, prospective cohort; CSI, cross‐sectional incidence study; RCT, randomized controlled trial.
Figure 8
Figure 8
HIV incidence rates among men and women in general population studies. (a) Plot of male versus female HIV incidence per 100 person‐years. Dashed red line is the identity line; points above the line represent higher female HIV incidence, while points below the line represent higher male HIV incidence. (b) Scatterplot of the log female:male HIV incidence ratio over calendar time with fitted line (solid black line) estimated using linear regression.

References

    1. 2020 Global AIDS Update ‐ Seizing the Moment ⁠‐ Tackling Entrenched Inequalities to End Epidemics [Internet]. UNAIDS. [cited 2020 Oct 7]. Available from: https://www.unaids.org/en/resources/documents/2020/global‐aids‐report
    1. Kates J, Wexler A. Donor Government Funding for HIV in Low‐ and Middle‐Income Countries in 2019. UNAIDS; 2020.
    1. Ghys PD, Williams BG, Over M, Hallett TB, Godfrey‐Faussett P. Epidemiological metrics and benchmarks for a transition in the HIV epidemic. PLoS Med. 2018;. 15:e1002678. - PMC - PubMed
    1. Galvani AP, Pandey A, Fitzpatrick MC, Medlock J, Gray GE. Defining control of HIV epidemics. Lancet HIV. 2018;. 5:e667–70. - PubMed
    1. GBD 2017 HIV collaborators . Global, regional, and national incidence, prevalence, and mortality of HIV, 1980–2017, and forecasts to 2030, for 195 countries and territories: a systematic analysis for the Global Burden of Diseases, Injuries, and Risk Factors Study 2017. Lancet HIV. 2019;. 6:e831–59. - PMC - PubMed

Publication types