Review
. 2021 Oct;26(10):100601.
doi: 10.1117/1.JBO.26.10.100601.

Enhanced medical diagnosis for dOCTors: a perspective of optical coherence tomography

Affiliations
Review

Enhanced medical diagnosis for dOCTors: a perspective of optical coherence tomography

Rainer Leitgeb et al. J Biomed Opt. 2021 Oct.

Abstract

Significance: After three decades, more than 75,000 publications, tens of companies being involved in its commercialization, and a global market perspective of about USD 1.5 billion in 2023, optical coherence tomography (OCT) has become one of the fastest successfully translated imaging techniques with substantial clinical and economic impacts and acceptance.

Aim: Our perspective focuses on disruptive forward-looking innovations and key technologies to further boost OCT performance and therefore enable significantly enhanced medical diagnosis.

Approach: A comprehensive review of state-of-the-art accomplishments in OCT has been performed.

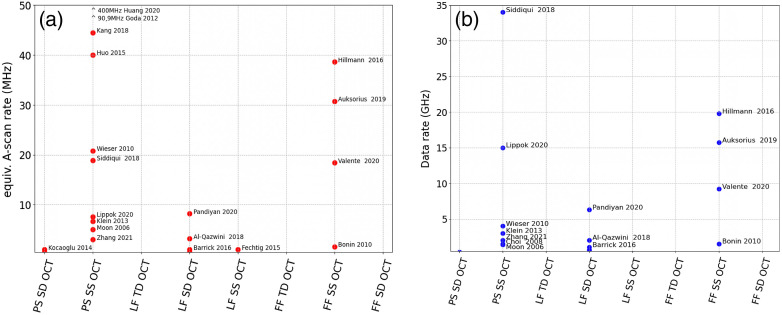
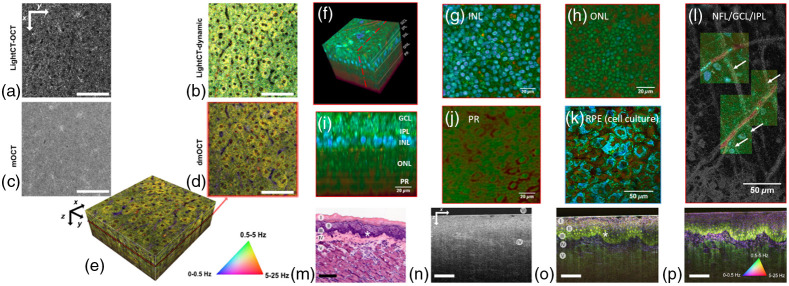
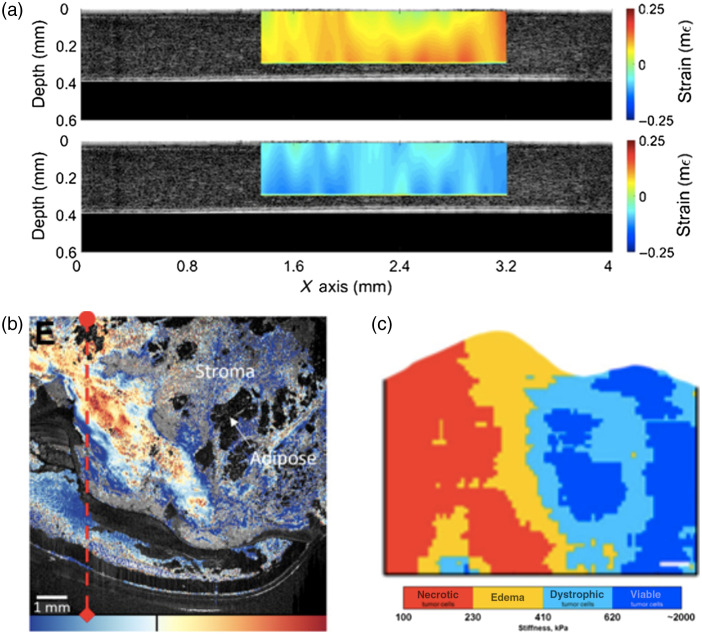
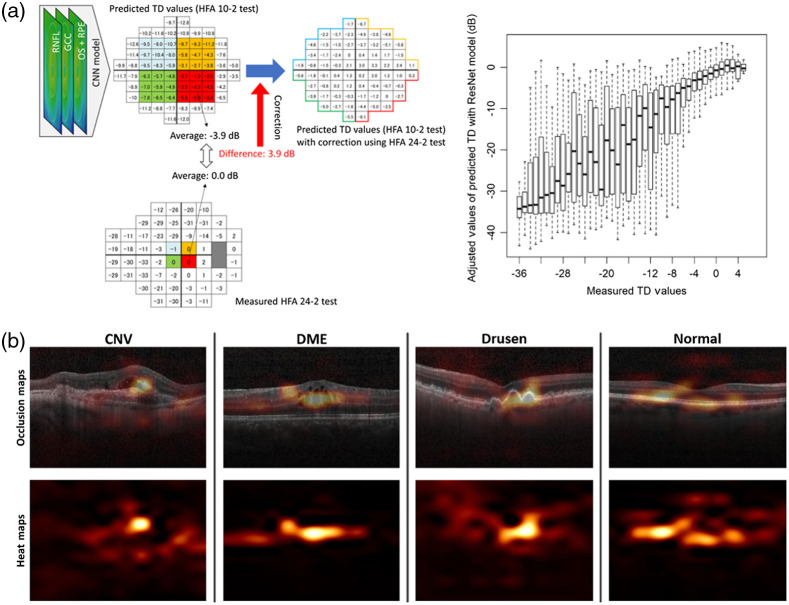
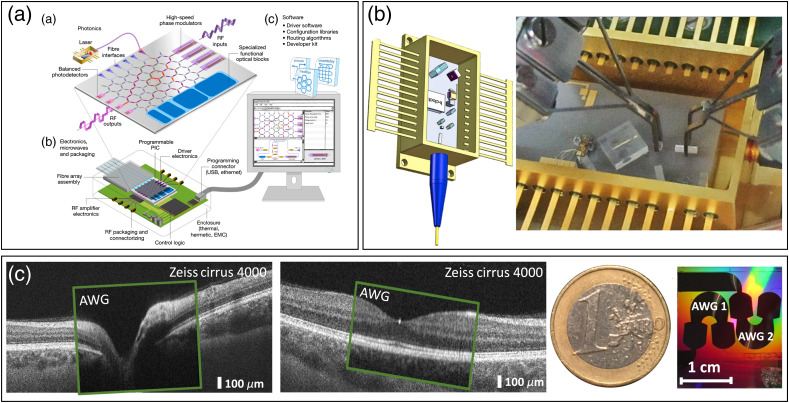
Results: The most disruptive future OCT innovations include imaging resolution and speed (single-beam raster scanning versus parallelization) improvement, new implementations for dual modality or even multimodality systems, and using endogenous or exogenous contrast in these hybrid OCT systems targeting molecular and metabolic imaging. Aside from OCT angiography, no other functional or contrast enhancing OCT extension has accomplished comparable clinical and commercial impacts. Some more recently developed extensions, e.g., optical coherence elastography, dynamic contrast OCT, optoretinography, and artificial intelligence enhanced OCT are also considered with high potential for the future. In addition, OCT miniaturization for portable, compact, handheld, and/or cost-effective capsule-based OCT applications, home-OCT, and self-OCT systems based on micro-optic assemblies or photonic integrated circuits will revolutionize new applications and availability in the near future. Finally, clinical translation of OCT including medical device regulatory challenges will continue to be absolutely essential.

Conclusions: With its exquisite non-invasive, micrometer resolution depth sectioning capability, OCT has especially revolutionized ophthalmic diagnosis and hence is the fastest adopted imaging technology in the history of ophthalmology. Nonetheless, OCT has not been completely exploited and has substantial growth potential-in academics as well as in industry. This applies not only to the ophthalmic application field, but also especially to the original motivation of OCT to enable optical biopsy, i.e., the in situ imaging of tissue microstructure with a resolution approaching that of histology but without the need for tissue excision.

Keywords: contrast enhanced OCT; functional OCT; miniaturized OCT; multimodal OCT; multimodal OCT endoscopy; non-linear optical microscopy; optical coherence tomography; photoacoustic imaging.


Figures

Fig. 1
Fig. 1
MHz OCT systems: (a) equivalent A-scan rates; for parallel systems, this is the number of parallel channels times the A-scan rate; shown are published systems with rates 1  MHz. (b) Data rates in gigasamples/s; only systems with sufficient data available have been included; fastest A-scan rates are achieved by stretched pulse laser OCT; fastest data rates were demonstrated by circular ranging OCT systems. In both categories, full field swept source OCT is a key player (PS, point scanning; TD, time domain; SS, swept source; and SD, spectral domain).
Fig. 2
Fig. 2
Examples for FF and LF OCT. (a) High-resolution large FOV retinal FFOCT. Panels 1 to 4 visualize the cone photoreceptor mosaic at different eccentricities as shown in panel S2 (scale bar 100  μm). Reproduced from Ref. ., © 2020 Optical Society of America (OSA). (b) TD LF OCT of human skin, using dynamically aligned confocal and coherence gating (K, keratinocytes; DEJ, dermal–epidermal junction; SD, sweat duct; H, hair; CF, collagen fibers; BV, blood vessels. Scale bars: 200  μm). Reproduced from Ref. , © 2018 OSA. (c) Retinal imaging with LF SS OCT at 600 kHz equivalent A-scan rate. Reproduced from Ref. , © 2015 OSA. (d) Computational adaptive optics for in vivo high-resolution retinal imaging (left: uncorrected enface slice from photoreceptor layer; center: reconstructed wavefront error; and right: corrected enface slice by phase conjugation of the wavefront error to the pupil plane phase; error bars 100  μm). Adapted from Ref. . (e) Advantage of FFOCT phase stability for functional OCT assessment of photoreceptor response (upper row: enface plane at OS photoreceptor layer of recorded volume together with tomogram; lower row: response measured as phase change over time after light stimulus onset; inlay shows the actual stimulus mask). Adapted from Ref. .
Fig. 3
Fig. 3
(a) Integrated approach using cross-polarization OCT, multiphoton tomography, and FLIM in skin equivalent preclinical research. Adapted from Ref. . (b) 3D reconstructed image in the popliteal lymph node of a CX3CR1:eGFP mouse: OCT (magenta) in the whole lymph node, SHG (blue) of collagen in the lymph node capsule, GFP fluorescence of CX3CR1+ cells (green), and rhodamine dextran signal in blood vessels in the whole lymph node and phagocytes, especially in the subcapsular sinus (red). Adapted from Ref. . Scale  200  μm.
Fig. 4
Fig. 4
Real time PAI: (a) cross-sectional images of the lower thoracic cavity, (b) two lobes of the liver, (c) upper abdominal cavity, and (d) lower abdominal cavity of a nude mouse at a frame rate of 50 Hz. AA, abdominal aorta; BM, backbone muscles; CM, caecum; IN, intestines; IVC, inferior vena cava; LK, left kidney; LL, left lung; LLV, left lobe of liver; LV, liver; PV, portal vein; RK, right kidney; RLV, right lobe of liver; SC, spinal cord; SP, spleen; SV, splenic vein; TA, thoracic aorta; and VE, vertebra. Reproduced from Ref.  with permission from Springer Nature. Time-lapse 3D images of a freely swimming zebrafish recorded at an imaging rate of 100  volumes/s. The shown sequences correspond to two portions of the movie having (e) smooth and (f) abrupt movements. Scale bar is 1 mm. Adapted from Ref.  with permission. Wide-field imaging of mouse brain hemoglobin responses to front paw stimulations at 2 kHz frame rate using a single transducer and an ergodic acoustic relay. (g) Calibration image of mouse brain vasculature through an intact skull. (h) Wide-field image. Fractional changes in signal amplitude (shown in red) in response to (i) right paw stimulation and (j) left paw stimulation superimposed on the calibration image. Norm., normalized and r.m.s., root mean square. Adapted from Ref.  with permission from Springer Nature.
Fig. 5
Fig. 5
Representative steps toward the development of fast data acquisition, 3D printed optical free-forms and representation easy to follow in clinical routine processes. (I) Zhang et al. reported on sideward imaging e-OCT and OCTA of a swine esophagus at an A-scan rate of 2.4 MHz. The distance covered by pullback was 14 mm, and a B-scan rate of 600 Hz was achieved. Arrows in (a) indicate blood vessels in OCT enface image, dashed lines in (b) indicate the depth of (c)–(f). This remarkable performance of OCT and OCTA at MHz speed is paving the way toward multi-megahertz endoscopically acquired data of OCT and OCTA. Adapted from Ref. . (II) Li et al. have realized 3D-printed free-form optic directly spliced on a light delivering fiber for improving optical performance (TIR, total internal reflection). Not only are very thin optical assemblies possible with this technique, but also the combination of various complementary techniques might be enabled with tailored optical properties to achieve outstanding imaging quality. Adapted from Ref. . (III) Alfonso-Garcia et al. introduced an augmented visualization of FLIM delineating brain tissue from prenecrotic and necrotic tissue. Left: Magnetic resonance image with indications of planes 1 and 2 of the FLIM maps on the right. Extrapolating this approach toward information feedback to clinicians, the color-coded maps, based on one single or multiple imaging techniques, could be easily interpreted and used by clinicians for immediate medical intervention. Adapted from Ref. .
Fig. 6
Fig. 6
(a) Wide-field OCTA of the human retina: posterior pole montage of 12×12  mm (about 40 deg) swept source OCTA. Adapted from Ref. . (b) Averaged OCTA image of the choriocapillaris. Adapted from Ref. . (c) OCTA VISTA image: red indicates faster blood flow speeds and blue indicates slower speeds. Enlargements to the right, with two different mean projection times of 1.5 and 3 ms as well as the OCTA VISTA version, respectively. Notice that the capillary loops, which likely correspond to microaneurysms, are associated with slower blood flow speeds. Adapted from Ref. .
Fig. 7
Fig. 7
(a) Illumination pattern (three bars) drawn to scale over the LSO image. The spatial map of OPL change between the ISOS and COST (b) before and (c) after stimulus measured at 20 Hz volume rate. (d) Rectangles over an LSO image represent the areas over which averages were obtained to plot the ORGs: 0.27°2 (yellow), 0.20°2 (gray), 0.14°2 (red), and 0.07°2 encompassing 10 cones (violet). (e) Repeatability of the response: single ORGs (gray dashed) and their mean (solid black) for six repeat trials, in which phase responses were averaged over 0.27°2 for 17.9% bleach. (f) Spatial averaging: ORGs over different areas color-coded according to the rectangles in (d). (g) Maximum intensity projection at COST layer with AO-OCT reveals individual cone photoreceptors. (h) ORGs for a subset of single cones in (g) demonstrating the response in each cone for 0.3% S-cone bleach and 29.7% average L- and M-cone bleach. The magnified view near stimulus onset shows a negligible early response in putative S-cones (blue) compared with L/M cones (orange). (i) ORG early and late response amplitudes for each cone in (g). (j) Histogram of the ORG early and late response magnitude, computed as the Euclidean distance from origin of each data point in (i). The two-component Gaussian mixture model (black dotted line) and its component Gaussians are used to distinguish S-cones (blue fit) from L/M cones (orange fit). The vertical dotted line marks t=0 in (e), (f), and (h) indicating the rising edge of stimulus onset. (a)–(f) are obtained without AO, with 4-mm imaging pupil, at 120-Hz volume rate. (g), (h) are obtained with AO, for 6-mm imaging pupil, at 162-Hz volume rate. The stimulus wavelength for all plots is 528±20  nm. (a)–(j) Adapted from Ref. .
Fig. 8
Fig. 8
(a)–(b) In vivo human retinal visible light OCT; (b) inset from (a). Adapted from Ref. . (c) B-scan image of a brown Norway rat retina using visible-light OCT. NFL, nerve fibre layer; GCL, ganglion cell layer; IPL, inner plexiform layer; INL, inner nuclear layer; OPL, outer plexiform layer; and BM, Bruch’s membrane. (d)–(f) En face images of vascular/capillary plexuses. SVP projected in the NFL and GCL slabs. ICP projected in the slab containing the inner border of the INL. DCP projected in the slab containing the outer border of the INL. (g) En face structural image projected from the ILM to BM, overlaid with measured oxygen saturation (sO2) values in major vessels to differentiate arteries from veins in an animal breathing 100% O2. Interplexus capillaries (white arrows) appear as dark spots due to greater light absorption than neighbouring capillaries. (h) Overlaid en face angiograms of three vascular/capillary plexuses to demonstrate the detailed organization of the retinal circulation. Examples of interplexus capillaries (indicated by white arrows in the enlarged images) were validated by observing their presence in corresponding locations. (i) En face projection of the NFL slab. The SVP was found to run anterior to the nerve fibre bundles (bright radial striations), which appear posterior to the vessels. The interplexus capillaries (black arrows) penetrate between NFL bundles and connect the SVP to the ICP and DCP. (c)–(i) Adapted from Ref. .
Fig. 9
Fig. 9
(a) LightCT en face OCT image of murine liver. (b) LightCT dynamic OCT en face image with corresponding regions. (c) Averaged mOCT en face image, which was acquired in the same region. (d) In the corresponding dynamic mOCT image, hepatocytes become visible with nuclei. (e) Cropped volume representation; size: 270285135  μm (xyz); scale bar, 100  μm. (a)–(e) Adapted from Ref. . (f) 3D reconstruction of a D-FFOCT image stack in explanted macaque retina over a 120×120  μm FOV. Note that FFOCT signal is damped with increasing penetration depth, so upper retinal layers are more clearly visible than lower ones. En face images of (g) inner nuclear layer, (h) outer nuclear layer, and (i) photoreceptor layer presenting a similar appearance to two-photon fluorescence imaging; (j) reconstructed cross section at the location represented by the red dotted line in (f). The cross section in (j) was linearly interpolated to obtain a unitary pixel size ratio. (f) D-FFOCT image of a porcine retinal pigment epithelium cell culture. (g) Overlay of colored D-FFOCT and FFOCT at the interface between the layers of the nerve fibers (white arrows point to nerve bundles that are very bright in static mode and invisible in dynamic mode), ganglion cells (blue and green cells, visible in dynamic mode) and inner plexiform (fibrous network, bottom left, visible in static mode). (f)–(l) Adapted from Ref. . (m) HE stained histology of the imaged sample at a different location: (I) cornified layer, (II) granular and spinous layers, (III) basal layer, (IV) lamina propria, (V) muscle, and (VI) glass plate. (n) OCT image of mouse tongue; lamina propria (IV) can be identified by brighter contrast. (o) Corresponding dynamic contrast mOCT image with a focus in the basal cell layer; (I)–(V) and even cell nuclei (*) are visible. (p) Dynamic contrast mOCT image with a focus in the lamina propria; the image size is 380500  μm (zx); scale bar is 100  μm. (m)–(p) Adapted from Ref. .
Fig. 10
Fig. 10
(a) Strain in untreated cornea induced by the heartbeat (orange: compression, blue: relaxation). Adapted from Ref. . (b) Qualitative OCE image of invasive ductal carcinoma. Adapted from Ref.  with permission from AACR. (c) Automated stiffness-based segmentation of mouse breast cancer in vivo. Adapted from Ref. .
Fig. 11
Fig. 11
(a) A CNN model was used to predict TD values in the central 10 deg of the visual field (corresponding to HFA 10-2 test data). The mean TD values within the central 6 deg at each quadrant (36 and 4 test points for the HFA 10-2 and HFA 24-2 tests, respectively) were calculated. The corresponding test grids in the inferonasal quadrant are shown. The differences between these values were calculated, and the predicted TD values were adjusted as per the calculated differences in each sector. CNN, convolutional neural network; GCC, ganglion cell complex; HFA, Humphrey field analyzer; OS, outer segment; RNFL, retinal nerve fiber layer; RPE, retinal pigment epithelium; and TD, total deviation. The relationship between the actual TD values and the predicted TD values using the ResNet model adjusted with the measured TD values corresponding to the innermost four points of the HFA 24-2 test. HFA, Humphrey field analyzer and TD, total deviation. Adapted from Ref. . (b) Occlusion testing maps showing most significant regions for detecting retinal diseases. In these images, golden regions indicate a large impact on model predictions while orange and red regions indicate a very limited impact on predictions. The heat map was created after prediction by assigning the softmax probability of the correct label to each occluded area. The occlusion map was generated by superimposing the heat map on the input image. CNV, choroidal neovascularization and DME, diabetic macular edema. Adapted from Ref. .
Fig. 12
Fig. 12
Overview of most promising future OCT technologies: (a) schematic of a programmable PIC with several functional layers: a programmable mesh of photonic gates, phase modulators, and detectors packaged with electronic AD drivers that are connected to a computer with which the user can manipulate and access the photonic functionality. Reprinted from Ref.  with permission from Springer Nature. (b) Three-dimensional model of a swept laser and robotic placement of microcomponents using micro-optics in a 14-pin butterfly package. Reprinted from Ref.  (c) First in vivo human retinal imaging using an on-chip grating (arrayed waveguide grating, AWG)-based SD-OCT. Two AWGs are shown in the used PIC, which measures only 2×2  cm. Adapted from Ref. .

Similar articles

Cited by

References

    1. Drexler W., Fujimoto J. G., Optical Coherence Tomography: Technology and Applications, 2nd ed., Springer Publishing, Switzerland: (2015).
    1. Windsor M. A., et al. , “Estimating public and patient savings from basic research: a study of optical coherence tomography in managing antiangiogenic therapy,” Am. J. Ophthalmol. 185, 115–122 (2018).AJOPAA10.1016/j.ajo.2017.09.027 - DOI - PMC - PubMed
    1. Huang D., et al. , “Optical coherence tomography,” Science 254(5035), 1178–1181 (1991).SCIEAS10.1126/science.1957169 - DOI - PMC - PubMed
    1. Fercher A. F., Roth E., Eds., Ophthalmic Laser Interferometer (1986).
    1. Fujimoto J. G., et al. , “Femtosecond optical ranging in biological systems,” Opt. Lett. 11, 150–152 (1986).OPLEDP10.1364/OL.11.000150 - DOI - PubMed

Publication types