

CIDEA expression in SAT from adolescent girls with obesity and unfavorable patterns of abdominal fat distribution
- PMID: 34672413
- PMCID: PMC8612981
- DOI: 10.1002/oby.23295
CIDEA expression in SAT from adolescent girls with obesity and unfavorable patterns of abdominal fat distribution
Abstract
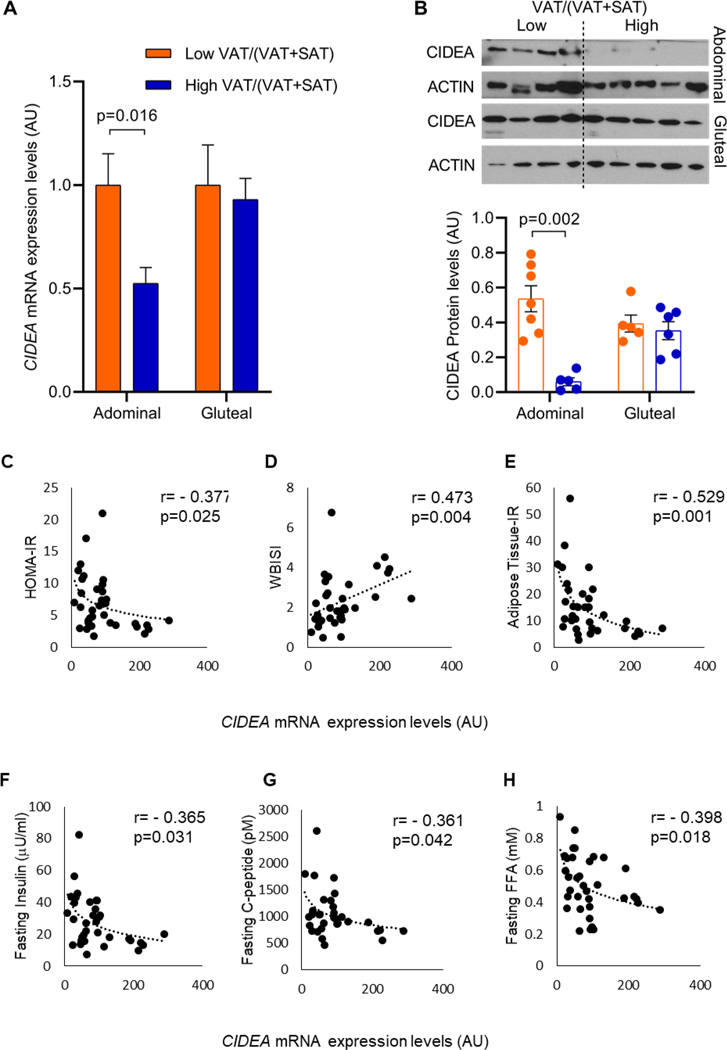
Objective: This study investigated whether variations in cell death-inducing DNA fragmentation factor alpha subunit-like effector A (CIDEA) mRNA expression and protein levels are modulated by the pattern of abdominal fat distribution in adolescent girls with obesity.
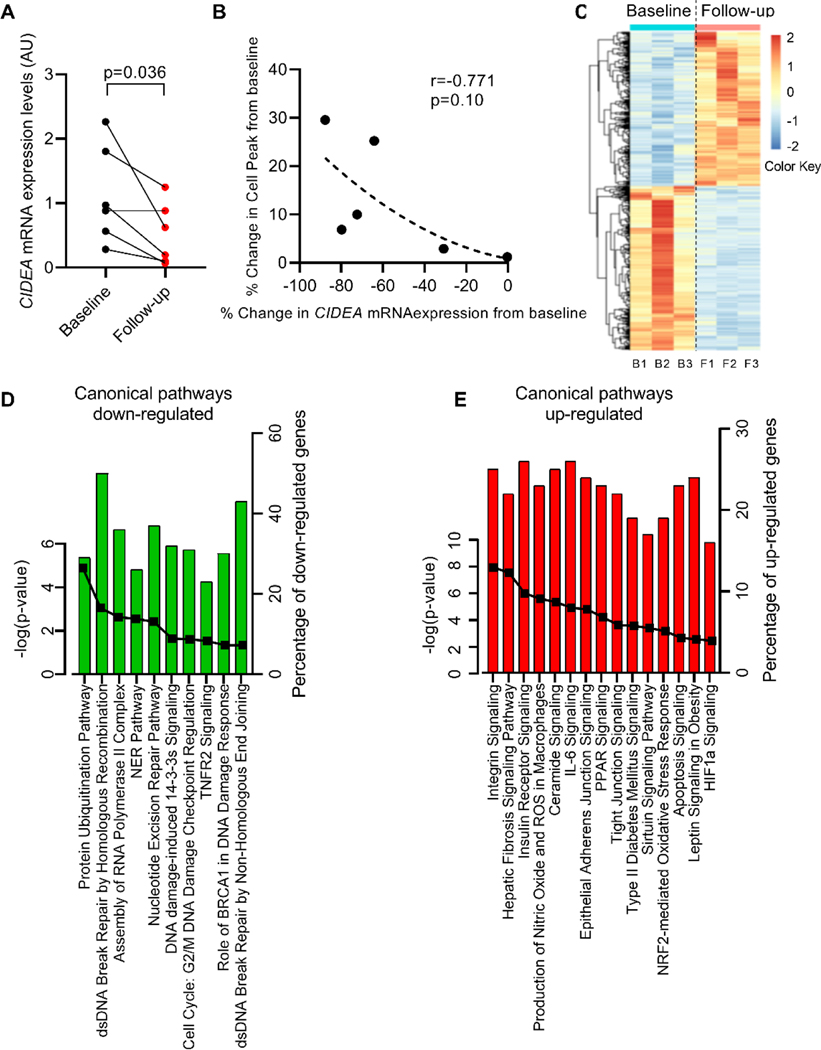
Methods: This study recruited 35 adolescent girls with obesity and characterized their abdominal fat distribution by magnetic resonance imaging. Participants had only a periumbilical/abdominal (n = 14) or a paired abdominal and gluteal subcutaneous adipose tissue (SAT) biopsy (n = 21). CIDEA expression was determined by reverse transcription-polymerase chain reaction, CIDEA protein level by Western blot, and the turnover of adipose lipids and adipocytes by 2 H2 O labeling. In six girls, a second abdominal SAT biopsy was performed (after ~34.2 months) to explore the weight gain effect on CIDEA expression in abdominal SAT.
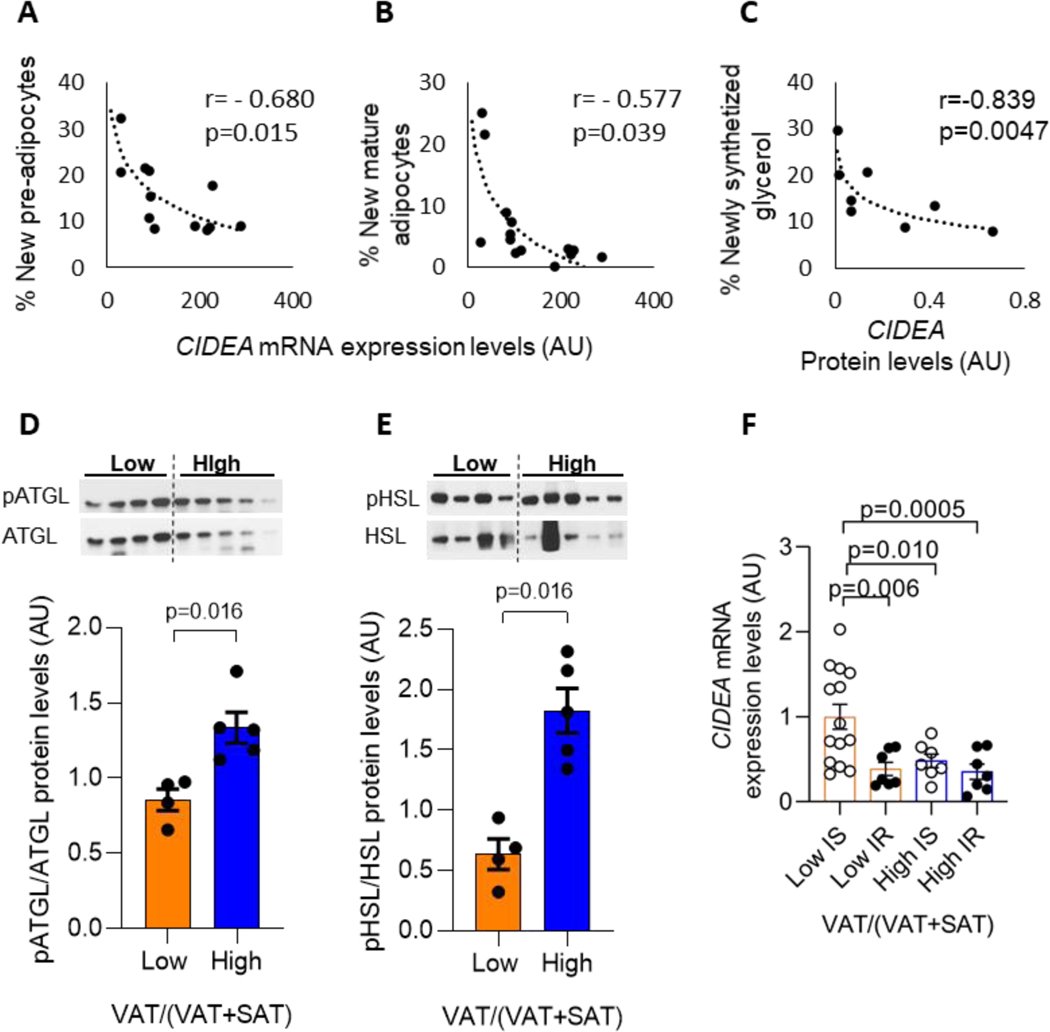
Results: CIDEA expression decreased in abdominal SAT from participants with high visceral adipose tissue (VAT)/(VAT+SAT); CIDEA inversely correlated with number of small adipocytes, with the increase in preadipocyte proliferation, and with adipogenesis. A strong inverse correlation was found between CIDEA protein level with the newly synthetized glycerol (r = -0.839, p = 0.0047). Following weight gain, an increase in adipocytes' cell diameter with a decrease in CIDEA expression and RNA-sequencing transcriptomic profile typical of adipocyte dysfunction was observed.
Conclusions: Reduced expression of CIDEA in girls with high VAT/(VAT+SAT) is associated with adipocyte hypertrophy and insulin resistance.
© 2021 The Obesity Society.
Conflict of interest statement
Disclosure
The authors declared no conflict of interest.
Figures
Similar articles
-
Altered In Vivo Lipid Fluxes and Cell Dynamics in Subcutaneous Adipose Tissues Are Associated With the Unfavorable Pattern of Fat Distribution in Obese Adolescent Girls.Diabetes. 2019 Jun;68(6):1168-1177. doi: 10.2337/db18-1162. Epub 2019 Apr 1. Diabetes. 2019. PMID: 30936147 Free PMC article.
-
Cellularity and adipogenic profile of the abdominal subcutaneous adipose tissue from obese adolescents: association with insulin resistance and hepatic steatosis.Diabetes. 2010 Sep;59(9):2288-96. doi: 10.2337/db10-0113. Diabetes. 2010. PMID: 20805387 Free PMC article.
-
Differential intra-abdominal adipose tissue profiling in obese, insulin-resistant women.Obes Surg. 2009 Nov;19(11):1564-73. doi: 10.1007/s11695-009-9949-9. Epub 2009 Aug 27. Obes Surg. 2009. PMID: 19711137 Free PMC article.
-
Visceral adiposity and inflammatory bowel disease.Int J Colorectal Dis. 2021 Nov;36(11):2305-2319. doi: 10.1007/s00384-021-03968-w. Epub 2021 Jun 9. Int J Colorectal Dis. 2021. PMID: 34104989 Review.
-
Two Faces of White Adipose Tissue with Heterogeneous Adipogenic Progenitors.Diabetes Metab J. 2019 Dec;43(6):752-762. doi: 10.4093/dmj.2019.0174. Diabetes Metab J. 2019. PMID: 31902145 Free PMC article. Review.
Cited by
-
Adipose 'neighborhoods' collaborate to maintain metabolic health.Curr Opin Genet Dev. 2023 Aug;81:102079. doi: 10.1016/j.gde.2023.102079. Epub 2023 Jul 3. Curr Opin Genet Dev. 2023. PMID: 37406429 Free PMC article. Review.
References
-
- Srinivasan SR, Bao W, Wattigney WA, Berenson GS. Adolescent overweight is associated with adult overweight and related multiple cardiovascular risk factors: the Bogalusa Heart Study. Metabolism 1996;45: 235–240. - PubMed
Publication types
MeSH terms
Substances
Grants and funding
LinkOut - more resources
Full Text Sources
Medical
Molecular Biology Databases
Research Materials
