. 2021 Nov;25(21):10257-10267.
doi: 10.1111/jcmm.16964. Epub 2021 Oct 21.

2-Deoxy-D-glucose impedes T cell-induced apoptosis of keratinocytes in oral lichen planus

Affiliations

2-Deoxy-D-glucose impedes T cell-induced apoptosis of keratinocytes in oral lichen planus

Fang Wang et al. J Cell Mol Med. 2021 Nov.

Abstract

Oral lichen planus (OLP) is a T cell-mediated immunoinflammatory disease. Glycolysis plays an essential role in T-cell immune responses. Blocking glycolytic pathway in activated T cells represents a therapeutic strategy for restraint of immunologic process in autoimmune disorders. 2-Deoxy-D-glucose (2-DG) has been widely used to probe into glycolysis in immune cells. This study was aimed to explore the role of glycolysis inhibition by 2-DG on regulating immune responses of OLP-derived T cells. We observed that lactic dehydrogenase A (LDHA) expression was elevated in OLP lesions and local T cells. 2-DG inhibited the expression of LDHA, p-mTOR, Hif1α and PLD2 in T cells; meanwhile, it decreased proliferation and increased apoptosis of T cells. T cells treated by 2-DG showed lower LDHA expression and elevated apoptosis, resulting in a reduced apoptotic population of keratinocytes that were co-cultured with them, which was related to the decreased levels of IFN-γ in co-culture system. Rapamycin enhanced the effects of 2-DG on immune responses between T cells and keratinocytes. Thus, these findings indicated that OLP-derived T cells might be highly dependent upon high glycolysis for proliferation, and 2-DG treatment combined with rapamycin might be an option to alleviate T-cell responses, contributing to reducing apoptosis of keratinocytes.

Keywords: 2-deoxy-D-glucose; T cell; apoptosis; glycolysis; interferon-γ; keratinocyte; mammalian target of rapamycin; oral lichen planus.


Conflict of interest statement

The authors declared no conflict of interest.

Figures
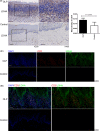
FIGURE 1
FIGURE 1
LDHA protein was highly expressed in OLP lesions and local T cells. Representative images of immunohistochemical staining and immunofluorescent staining for LDHA in OLP lesions (n = 12) and normal oral mucosa tissues (n = 10). (A) LDHA immunoreactivity was observed in the epithelium and infiltrated lymphocytes of OLP lesions. The statistical data were reported using mean optical density (MOD) of at least three randomly captured fields at ×400 magnification. Bar: 100 μm for ×200, 50 μm for ×400. (B) Abundant red fluorescence signals for CD3 overlapped with the green signals for LDHA in OLP lesions. b1: single channel images for DAPI (blue), CD3 (red), LDHA (green); b2: merged images. Bar: 100 μm for ×200
FIGURE 2
FIGURE 2
2‐DG inhibited glycolysis and mTOR pathway in OLP‐derived T cells. OLP‐derived T cells were activated with 1 μg/ml anti‐CD3 mAb and 2 μg/ml anti‐CD28 mAb for 72 h, then cultured with 1 mM or 5 mM 2‐DG for 24 h. 2‐DG was dissolved in DMSO. DMSO at a concentration of 0.1% (v/v) was used as the solvent control. (A) Representative images of immunofluorescent staining for LDHA expression in T cells. The fluorescence intensity of LDHA was decreased in the 2‐DG groups. 5 mM 2‐DG group showed a weaker fluorescence than 1 mM 2‐DG group. Red: LDHA. Blue: nucleus. Bar: 50 μm for ×400. (B) Representative images of Western Blot detection for p‐mTOR, mTOR, p‐4E‐BP1, 4E‐BP1, HIF1α and PLD2 expression. Grey‐scale analysis revealed that the ratios of p‐mTOR/mTOR, p‐4E‐BP1/4E‐BP1, HIF1α/β‐actin and PLD2/β‐actin were decreased in 5 mM 2‐DG group, rather than in 1 mM 2‐DG group. ***, p < 0.001
FIGURE 3
FIGURE 3
2‐DG decreased proliferation and increased apoptosis of OLP‐derived T cells. (A) After activation, OLP‐derived T cells were cultured with 1 or 5 mM 2‐DG for 24 h for proliferation analysis using CCK‐8 reagents. The OD value in 5 mM 2‐DG group was lower than that in 1 mM 2‐DG group and DMSO group. **, p < 0.01. (B) OLP‐derived T cells were cultured with 5 mM 2‐DG for 24 h for apoptosis analysis using Annexin V‐FITC/PI reagents, and representative images for T‐cell apoptosis were shown. The number of Annexin V‐positive cells in 5 mM 2‐DG group was larger than that in DMSO group. DMSO at a concentration of 0.1% (v/v) was used as the solvent control group
FIGURE 4
FIGURE 4
2‐DG and/or rapamycin inhibited LDHA expression in OLP‐derived T cells. Representative images of immunofluorescent staining for LDHA expression. DMSO at a concentration of 0.1% (v/v) was used as the solvent control group. Red: LDHA. Blue: nucleus. Bar: 50 μm for ×400
FIGURE 5
FIGURE 5
Blocking glycolysis and mTOR pathway in OLP‐derived T cells resulted in a reduced apoptotic population of keratinocytes that were co‐cultured with them. (A) The co‐culture system was established with OLP‐derived T cells and human oral keratinocytes via transwell inserts. T cells were pretreated with DMSO (at 0.1% v/v), 5 mM 2‐DG or 100 nM rapamycin for 24 h. Then, T cells were placed in the upper compartment with fresh medium; LPS‐stimulated keratinocytes were cultured in the lower compartment. They were co‐cultured for 24 h for apoptosis analysis. The co‐culture medium was consisted of 500 μl human T‐cell robust expansion kit and 500 μl K‐SFM. For T cells, DMSO at a concentration of 0.1% (v/v) was used as the solvent control group. For keratinocytes, cells cultured without T cells were used as a blank control. (B) Flow cytometry assay was used to detect the apoptosis of OLP‐derived T cells and keratinocytes in co‐culture system. B1: representative images for T‐cell apoptosis; B2: representative images for keratinocyte apoptosis. (C) The histogram of apoptosis rates of T cells and keratinocytes in co‐culture system. C1: for T cells, the apoptotic populations in 2‐DG group and Rap group were larger than DMSO group, and the apoptotic populations in 2‐DG +Rap group were larger than 2‐DG group and Rap group. C2: for keratinocytes, the apoptosis rate was increased in DMSO T‐cell group compared to Blank group, while decreased in 2‐DG T‐cell group and Rap T‐cell group compared to DMSO T‐cell group. The apoptosis rate in 2‐DG +Rap T‐cell group was lower than that in 2‐DG T‐cell group and Rap T‐cell group. *p < 0.05; **p < 0.01; ***p < 0.001
FIGURE 6
FIGURE 6
IFN‐γ level in co‐culture system was decreased after blocking glycolysis and mTOR pathway in OLP‐derived T cells. (A, B, C) ELISA kits were used to detect the levels of IFN‐γ, IL‐4 and IL‐17 in co‐culture system. IFN‐γ level was increased in DMSO T‐cell +keratinocyte group compared to keratinocyte group, while decreased in 2‐DG T‐cell +keratinocyte group and Rap T‐cell +keratinocyte group compared to DMSO T‐cell +keratinocyte group. IFN‐γ level in 2‐DG +Rap T‐cell +keratinocyte group was lower than that in 2‐DG T‐cell +keratinocyte group and Rap T‐cell +keratinocyte group. *p < 0.05; **p < 0.01
FIGURE 7
FIGURE 7
Diagram of the role of 2‐DG on OLP‐derived T cells. OLP T cells are highly dependent upon high glycolysis for proliferation. 2‐DG blocking glycolysis leads to the inhibition of mTOR pathway, which is responsible for the expression of LDHA. T cells treated by 2‐DG have lower LDHA expression and elevated apoptosis, resulting in a reduced apoptotic population of target cells, namely keratinocytes, which is related to the decreased levels of IFN‐γ in the microenvironment. Rapamycin enhanced the effects of 2‐DG on immune responses between T cells and keratinocytes

Similar articles

Cited by

References

    1. Carrozzo M, Porter S, Mercadante V, Fedele S. Oral lichen planus: a disease or a spectrum of tissue reactions? Types, causes, diagnostic algorhythms, prognosis, management strategies. Periodontol. 2000;2019(80):105‐125. 10.1111/prd.12260 - DOI - PubMed
    1. Cheng YS, Gould A, Kurago Z, Fantasia J, Muller S. Diagnosis of oral lichen planus: a position paper of the American Academy of Oral and Maxillofacial Pathology. Oral Surg Oral Med Oral Pathol Oral Radiol. 2016;122:332‐354. 10.1016/j.oooo.2016.05.004 - DOI - PubMed
    1. Wang K, Lu W, Tu Q, et al. Preliminary analysis of salivary microbiome and their potential roles in oral lichen planus. Sci Rep. 2016;6:22943. 10.1038/srep22943 - DOI - PMC - PubMed
    1. Roopashree MR, Gondhalekar RV, Shashikanth MC, George J, Thippeswamy SH, Shukla A. Pathogenesis of oral lichen planus–a review. J Oral Pathol Med. 2010;39:729‐734. 10.1111/j.1600-0714.2010.00946.x - DOI - PubMed
    1. Lu R, Zhou G, Du G, Xu X, Yang J, Hu J. Expression of T‐bet and GATA‐3 in peripheral blood mononuclear cells of patients with oral lichen planus. Arch Oral Biol. 2011;56:499‐505. 10.1016/j.archoralbio.2010.11.006 - DOI - PubMed

Publication types

MeSH terms