. 2021 Nov 26;374(6571):1106-1113.
doi: 10.1126/science.abl5163. Epub 2021 Oct 21.

Impact of neurodegenerative diseases on human adult hippocampal neurogenesis

Affiliations

Impact of neurodegenerative diseases on human adult hippocampal neurogenesis

J Terreros-Roncal et al. Science. .

Abstract

Disrupted hippocampal performance underlies psychiatric comorbidities and cognitive impairments in patients with neurodegenerative disorders. To understand the contribution of adult hippocampal neurogenesis (AHN) to amyotrophic lateral sclerosis, Huntington’s disease, Parkinson’s disease, dementia with Lewy bodies, and frontotemporal dementia, we studied postmortem human samples. We found that adult-born dentate granule cells showed abnormal morphological development and changes in the expression of differentiation markers. The ratio of quiescent to proliferating hippocampal neural stem cells shifted, and the homeostasis of the neurogenic niche was altered. Aging and neurodegenerative diseases reduced the phagocytic capacity of microglia, triggered astrogliosis, and altered the microvasculature of the dentate gyrus. Thus, enhanced vulnerability of AHN to neurodegeneration might underlie hippocampal dysfunction during physiological and pathological aging in humans.


Conflict of interest statement

Competing interests: Authors declare that they have no competing interests.

Figures

Fig. 1
Fig. 1. Adult hippocampal neurogenesis in neurologically healthy control subjects.
A – B: Representative images of a Nestin+ SRY-Box Transcription Factor 2 (Sox2)+ glial fibrillary acidic protein (GFAP+) radial glia-like (RGL) cell (A), and a Phospho-histone 3 (PH3)+ HuC/HuD+ Doublecortin (DCX)+ proliferative neuroblast (B) in the human dentate gyrus (DG). CD: Density of Nestin+ S100β- RGL cells (C), and Sox2+, Vimentin+, PH3+, Huc/HuD+ cells, DCX+ and Polysialylated-neural cell adhesion molecule (PSA-NCAM)+ immature and total dentate granule cells (DGCs) (D) in neurologically healthy control subjects. E: Percentage of DCX+ immature DGCs that express markers of distinct maturation stages. F: Representative images showing morphologically undifferentiated (left) and differentiated (right) human DCX+ immature DGCs. G: Positioning of DCX+ DGC subpopulations. H: Number of primary neurites of DCX+ DGCs. I: Orientation of neurites in DCX+ DGCs. J: Area of the soma of DCX+ DGCs. K: Representative images of S100β+ astrocytes. L: Density of S100β+ astrocytes and Iba1+ microglia. M: Representative image of an Iba1+ microglial cell showing the presence of a phagocytic pouch in the proximity of a pyknotic nucleus in the human DG. N: Phagocytic index. O: Representative image showing the vascularization of the human DG. n = 15 neurologically healthy control subjects. In A, B, F, K, M, and O, Z-projection images are shown. 5-20 stacks of images per subject were analyzed for each marker. Graphs represent mean values ± SEM. ML: Molecular layer. GCL: Granule cell layer. SGZ: Subgranular zone. H: Hilus. CR: Calretinin. CB: Calbindin. Yellow scale bar: 50 μm. White scale bar: 10 μm. Orange triangles: PH3+ HuC/HuD+ DCX+ cells. Yellow triangles: DCX+ DGCs. Blue triangles: S100β+ astrocytes. White triangle: pyknotic nucleus. * 0.05 > p ≥ 0.01; ** 0.01 > p ≥ 0.001; and *** p < 0.001. Black asterisks indicate changes with respect to DCX+ CR+ DGCs. Gray asterisks indicate changes between DCX+ NeuN+ and DCX+ CB+ DGCs. Crossed out dots in C, D, and E indicate outlier values.
Fig. 2
Fig. 2. Adult hippocampal neurogenesis in Amyotrophic lateral sclerosis (ALS).
A – C: Representative images of Nestin+ (A), Sox2+ (B), and Phospho-histone 3 (PH3)+ cells (C). DE: Density of Nestin+ S100β- radial glia-like cells (D), Sox2+ cells, PH3+ proliferative cells, and HuC/HuD+ proliferative neuroblasts (E). F: Density of Doublecortin (DCX)+ immature dentate granule cells (DGCs). G: Ratio between immature and total DGCs. H: Percentage of DCX+ immature DGCs that express markers of distinct maturation stages. I: Representative images of DCX+ immature DGCs showing the presence of apical dendrites (green arrows). J: Number of primary neurites in DCX+ DGCs. K: Orientation of primary neurites in DCX+ DGCs. L: Representative images of S100β+ astrocytes. M: Density of S100β+ astrocytes. N: Number of phagocytic pouches in Iba1+ microglia. O: Phagocytic index. P: Thickness of Ulex Europaea Agglutinin 1 (UEA-1)+ dentate gyrus capillaries. n = 15 neurologically healthy control subjects and 12 patients with ALS. In A – C, I, and L, Z-projection images are shown. 5-20 stacks of images per subject were analyzed for each marker. Graphs represent mean values ± SEM. ML: Molecular layer. GCL: Granule cell layer. SGZ: Subgranular zone. H: Hilus. CR: Calretinin. CB: Calbindin. Yellow scale bar: 50 μm. White scale bar: 10 μm. White triangles: Nestin+ RGL cells. Orange triangles: Sox2+ cells. Magenta triangles: PH3+ cells. Yellow triangles: DCX+ DGCs. Blue triangles: S100β+ astrocytes. + 0.1 > p ≥ 0.05; * 0.05 > p ≥ 0.01; ** 0.01 > p ≥ 0.001; and *** p < 0.001. Green asterisks indicate changes with respect to neurologically healthy controls.
Fig. 3
Fig. 3. Adult hippocampal neurogenesis in patients with Huntington’s disease.
A – C: Representative images of Nestin+ cells (A), Phospho-histone 3 (PH3)+ proliferative cells (B), and HuC/HuD+ proliferative neuroblasts (C). DE: Density of Nestin+ S100β- radial glia-like cells (D), Sox2+ cells, PH3+ proliferative cells, and HuC/HuD+ proliferative neuroblasts (E). F: Density of Doublecortin (DCX)+ and Polysialylated-neural cell adhesion molecule (PSA-NCAM)+ immature dentate granule cells (DGCs). G: Ratio between immature/total DGCs. H: Percentage of DCX+ immature DGCs that express markers of distinct maturation stages. I: Percentage of PSA-NCAM+ DGCs that express DCX. J – K: Representative images of DCX+ (J) and PSA-NCAM+ (K) immature DGCs. L: Positioning of immature DGCs. M: Number of primary neurites of distinct subpopulations of DCX+ DGCs. N: Orientation of neurites in DCX+ DGCs. O: Density of S100β+ astrocytes. P: Representative images of Iba1+ microglia. Q: Number of phagocytic pouches in Iba1+ microglia. R: Phagocytic index. S: Thickness of Ulex Europaeus Agglutinin 1 (UEA1)+ dentate gyrus capillaries. n = 15 neurologically healthy control subjects and 6 patients with Huntington’s disease. In A – C, J – K, and P, Z-projection images are shown. 5-20 stacks of images per subject were analyzed for each marker. Graphs represent mean values ± SEM. ML: Molecular layer. GCL: Granule cell layer. SGZ: Subgranular zone. H: Hilus. CR: Calretinin. CB: Calbindin. Yellow scale bar: 50 μm. White scale bar: 10 μm. Orange triangles: Nestin+ RGL cells. Magenta triangles: PH3+ cells. Yellow triangles: HuC/HuD+ cells. Blue triangles: DCX+ immature DGCs. White triangles: PSA-NCAM+ immature DGCs. + 0.1 > p ≥ 0.05; * 0.05 > p ≥ 0.01; ** 0.01 > p ≥ 0.001; and *** p < 0.001. Yellow asterisks indicate changes with respect to neurologically healthy controls.
Fig. 4
Fig. 4. Adult hippocampal neurogenesis in patients with α-synucleinopathies (α-SYN).
A – D: Representative images of Nestin+ (A), Sox2+ (B), Phospho-histone 3 (PH3)+ cells (C), and HuC/HuD+ proliferative neuroblasts (D). E – F: Density of Nestin+ S100β- radial glia-like cells (E), Sox2+ cells, PH3+ proliferative cells, and HuC/HuD+ proliferative neuroblasts (F). G: Density of Doublecortin (DCX)+ and total dentate granule cells (DGCs). H: Percentage of DCX+ immature DGCs that express markers of distinct maturation stages. I: Representative high-power magnification images of a DCX+ DGC. J: Positioning of immature DGCs. K: Number of primary neurites of distinct subpopulations of DCX+ DGCs. L: Neurite orientation in DCX+ DGCs. M: Area of the soma of DCX+ DGCs. N: Density of S100β+ astrocytes. O: Representative images of Iba1+ microglia. P: Area of the nucleus of Iba1+ microglia. Q: Phagocytic index. R: Representative images showing the vascularization of the dentate gyrus (DG). S: Thickness of Ulex Europaeus Agglutinin 1 (UEA-1)+ DG capillaries. n = 15 neurologically healthy control subjects and 9 patients with α-SYN (3 with Parkinson’s disease (PD) and 6 with dementia with Lewy bodies (LD)). In A – D, I, O, and R, Z-projection images are shown. 5-20 stacks of images per subject were analyzed for each marker. Graphs represent mean values ± SEM. ML: Molecular layer. GCL: Granule cell layer. SGZ: Subgranular zone. H: Hilus. CR: Calretinin. CB: Calbindin. Yellow scale bar: 50 μm. White scale bar: 10 μm. White triangles: Nestin+ RGL cells. Orange triangles: Sox2+ cells. Magenta triangles: PH3+ cells. Yellow triangles: HuC/HuD+ cells. Blue triangles: DCX+ immature DGCs. Green triangles: UEA1+ capillaries. + 0.1 > p ≥ 0.05; * 0.05 > p ≥ 0.01; ** 0.01 > p ≥ 0.001; and *** p < 0.001. Purple asterisks indicate changes with respect to neurologically healthy controls.
Fig. 5
Fig. 5. Adult hippocampal neurogenesis in Frontotemporal dementia (FTD).
A - B: Representative images of Phospho-histone 3 (PH3)+ proliferative cells (A) and HuC/HuD+ proliferative neuroblasts (B) in patients with FTD. C – D: Density of Nestin+ S100β- radial glialike cells (C), Sox2+ cells, PH3+ proliferative cells, and HuC/HuD+ proliferative neuroblasts (D). E: Density of DCX+ and total dentate granule cells (DGCs). F: Percentage of DCX+ immature DGCs that express markers of distinct maturation stages. G: Representative low- and high-power magnification images of Doublecortin (DCX)+ DGCs. H: Positioning of total immature DGCs. I: Number of neurites in DCX+ DGCs. J: Neurite orientation in DCX+ DGCs. K: Density of S100β+ astrocytes. L: Representative images of S100β+ astrocytes. M: Phagocytic index. N: Representative images of Iba1+ microglia. O: Thickness of Ulex Europaeus Agglutinin 1 (UEA-1)+ dentate gyrus capillaries. n = 15 neurologically healthy control subjects and 6 patients with FTD. In A – B, G, L, and N, Z-projection images are shown. 5-20 stacks of images per subject were analyzed for each marker. Graphs represent mean values ± SEM. ML: Molecular layer. GCL: Granule cell layer. SGZ: Subgranular zone. H: Hilus. CR: Calretinin. CB: Calbindin. Yellow scale bar: 50 μm. White scale bar: 10μm. Magenta triangles: PH3+ cells. Yellow triangles: HuC/HuD+ cells. Blue triangles: DCX+ CR+ immature DGCs. White triangles: DCX+ CR- immature DGCs. Orange triangles: S100β+ astrocytes. Green triangles: Iba1+ microglia. +0.1 > p ≥ 0.05; * 0.05 > p ≥ 0.01; ** 0.01 > p ≥ 0.001; and *** p < 0.001. Red asterisks indicate changes with respect to neurologically healthy controls.
Fig. 6
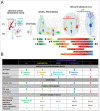
Fig. 6. Adult hippocampal neurogenesis (AHN) in neurodegenerative diseases.
A: Graphical scheme showing the stages of AHN targeted by each neurodegenerative disease. B: Summary of the main alterations found in each disease.

Comment in

Similar articles

Cited by

References

    1. Altman J. Autoradiographic investigation of cell proliferation in the brains of rats and cats. Anatomical Record. 1963;145:573–591. doi: 10.1002/ar.1091450409. published online EpubApr. - DOI - PubMed
    1. Eriksson PS, Perfilieva E, Bjork-Eriksson T, Alborn AM, Nordborg C, Peterson DA, Gage FH. Neurogenesis in the adult human hippocampus. Nature Medicine. 1998;4:1313–1317. doi: 10.1038/3305. published online EpubNov. - DOI - PubMed
    1. Hill AS, Sahay A, Hen R. Increasing Adult Hippocampal Neurogenesis is Sufficient to Reduce Anxiety and Depression-Like Behaviors. Neuropsychopharmacology. 2015;40:2368–2378. doi: 10.1038/npp.2015.85. published online EpubSep. - DOI - PMC - PubMed
    1. Sahay A, Scobie KN, Hill AS, O’Carroll CM, Kheirbek MA, Burghardt NS, Fenton AA, Dranovsky A, Hen R. Increasing adult hippocampal neurogenesis is sufficient to improve pattern separation. Nature. 2011;472:466–470. doi: 10.1038/nature09817. published online EpubApr 28. - DOI - PMC - PubMed
    1. Gould E, Reeves AJ, Fallah M, Tanapat P, Gross CG, Fuchs E. Hippocampal neurogenesis in adult Old World primates. Proceedings of the National Academy of Sciences of the United States of America. 1999;96:5263–5267. doi: 10.1073/pnas.96.9.5263. published online EpubApr 27. - DOI - PMC - PubMed

Publication types

MeSH terms