. 2021 Oct 22;374(6566):eabb4149.
doi: 10.1126/science.abb4149. Epub 2021 Oct 22.

Social agent identity cells in the prefrontal cortex of interacting groups of primates

Affiliations

Social agent identity cells in the prefrontal cortex of interacting groups of primates

Raymundo Báez-Mendoza et al. Science. .

Abstract

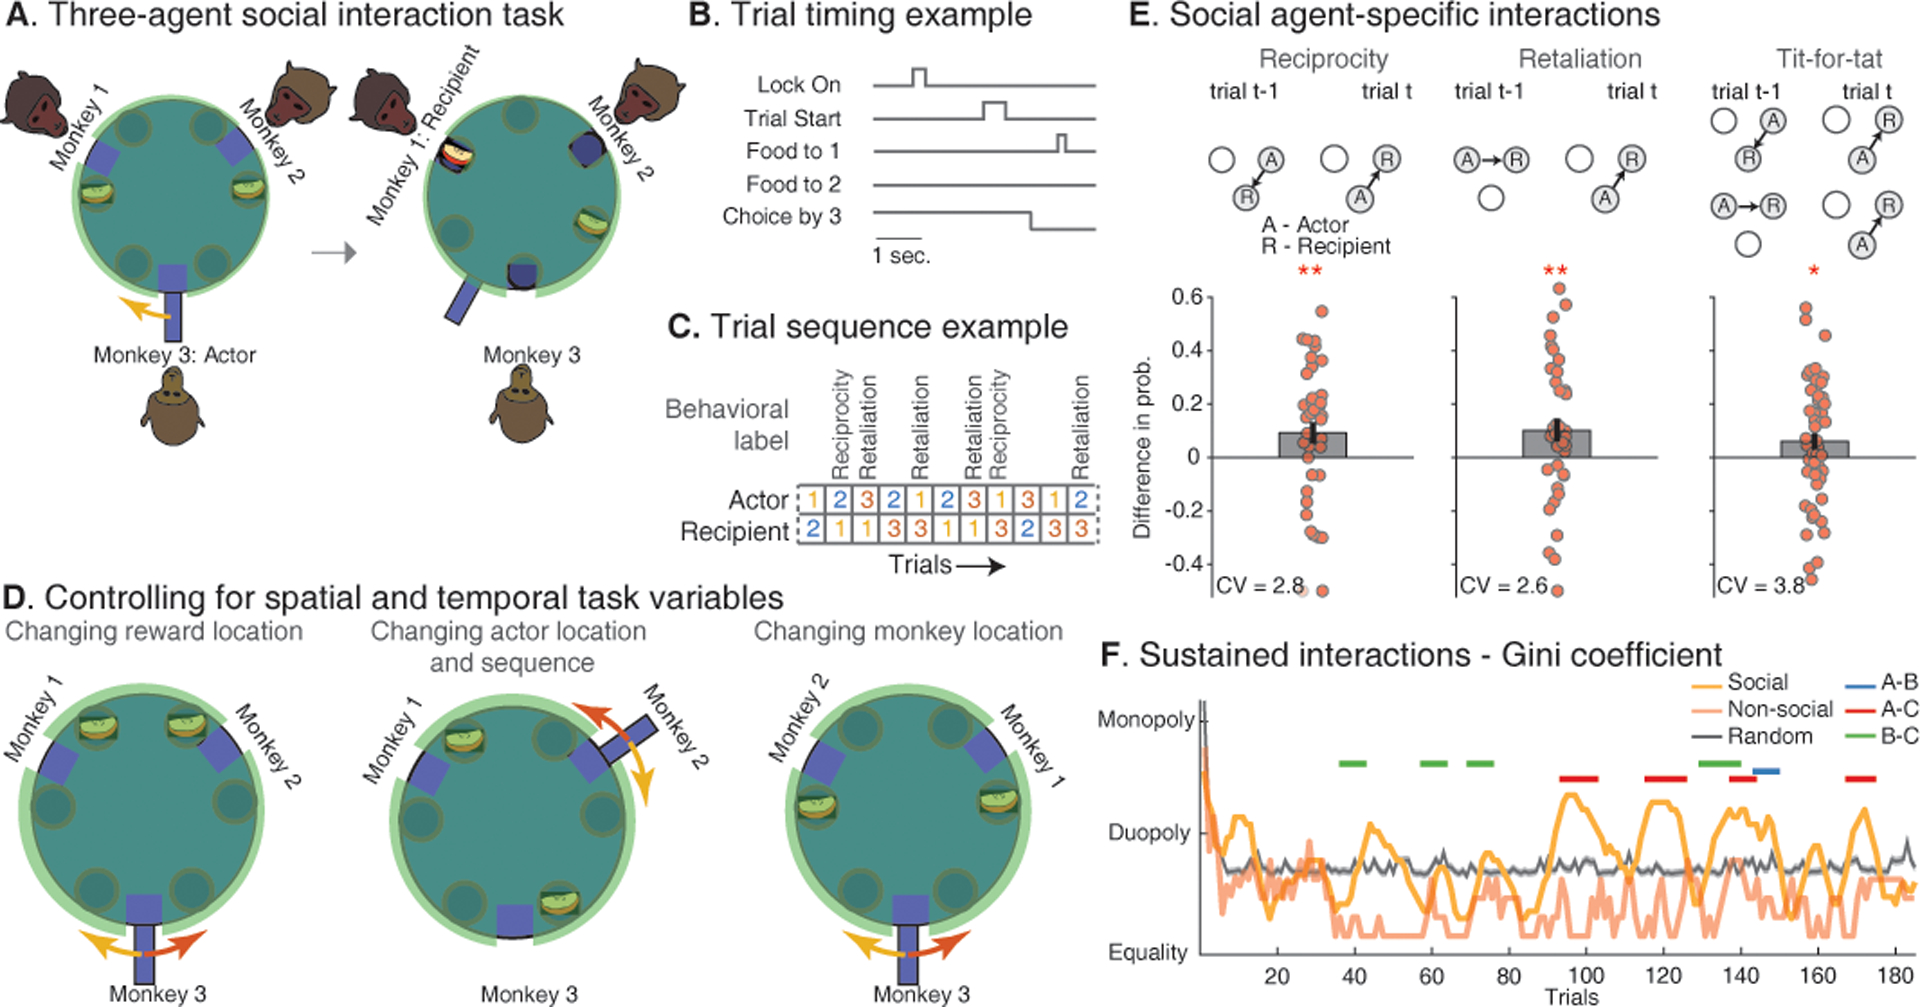
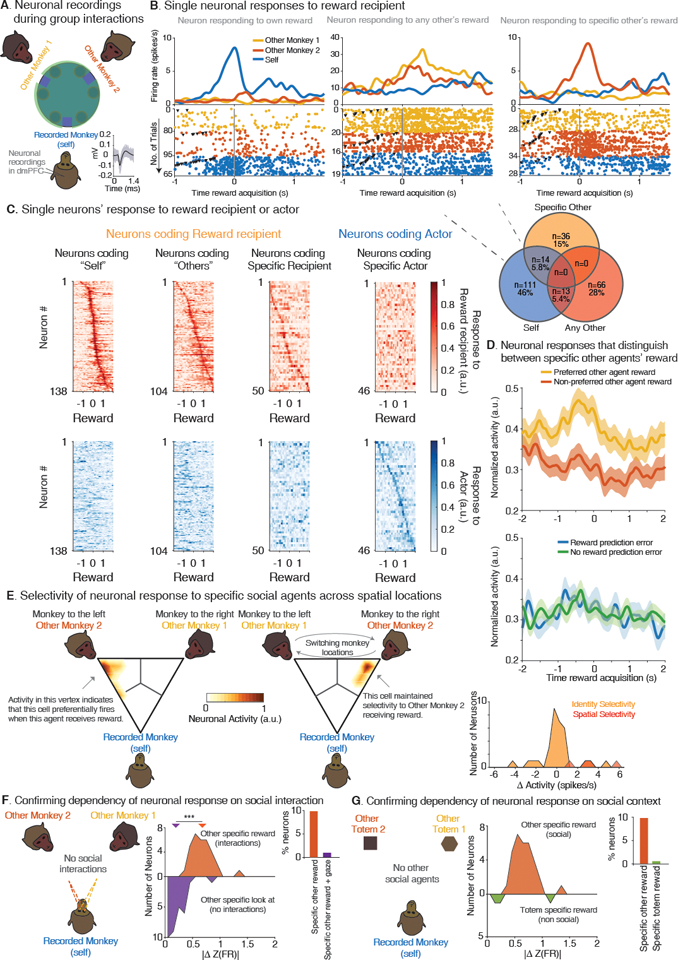
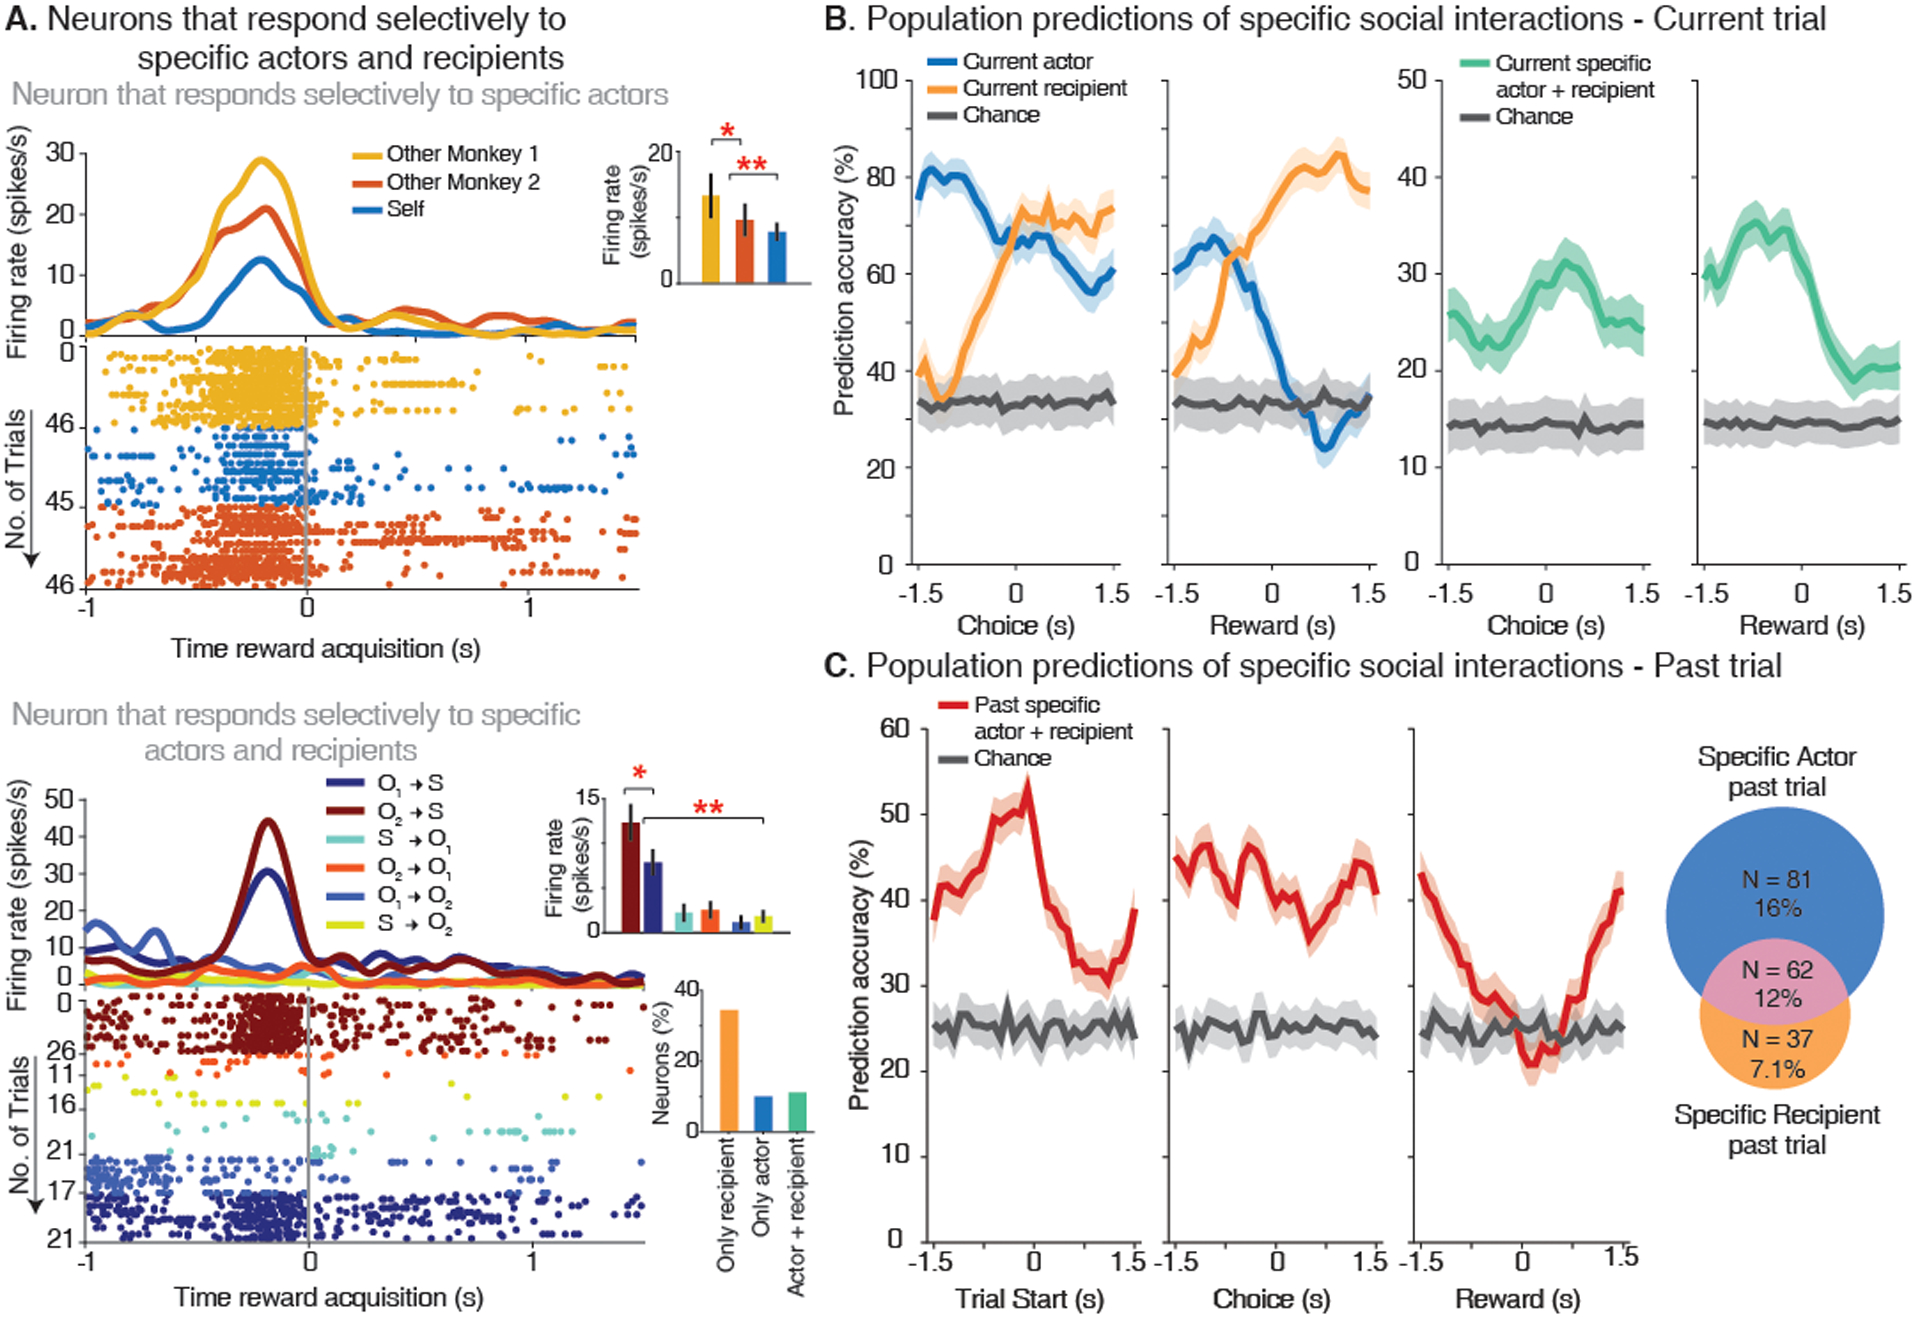
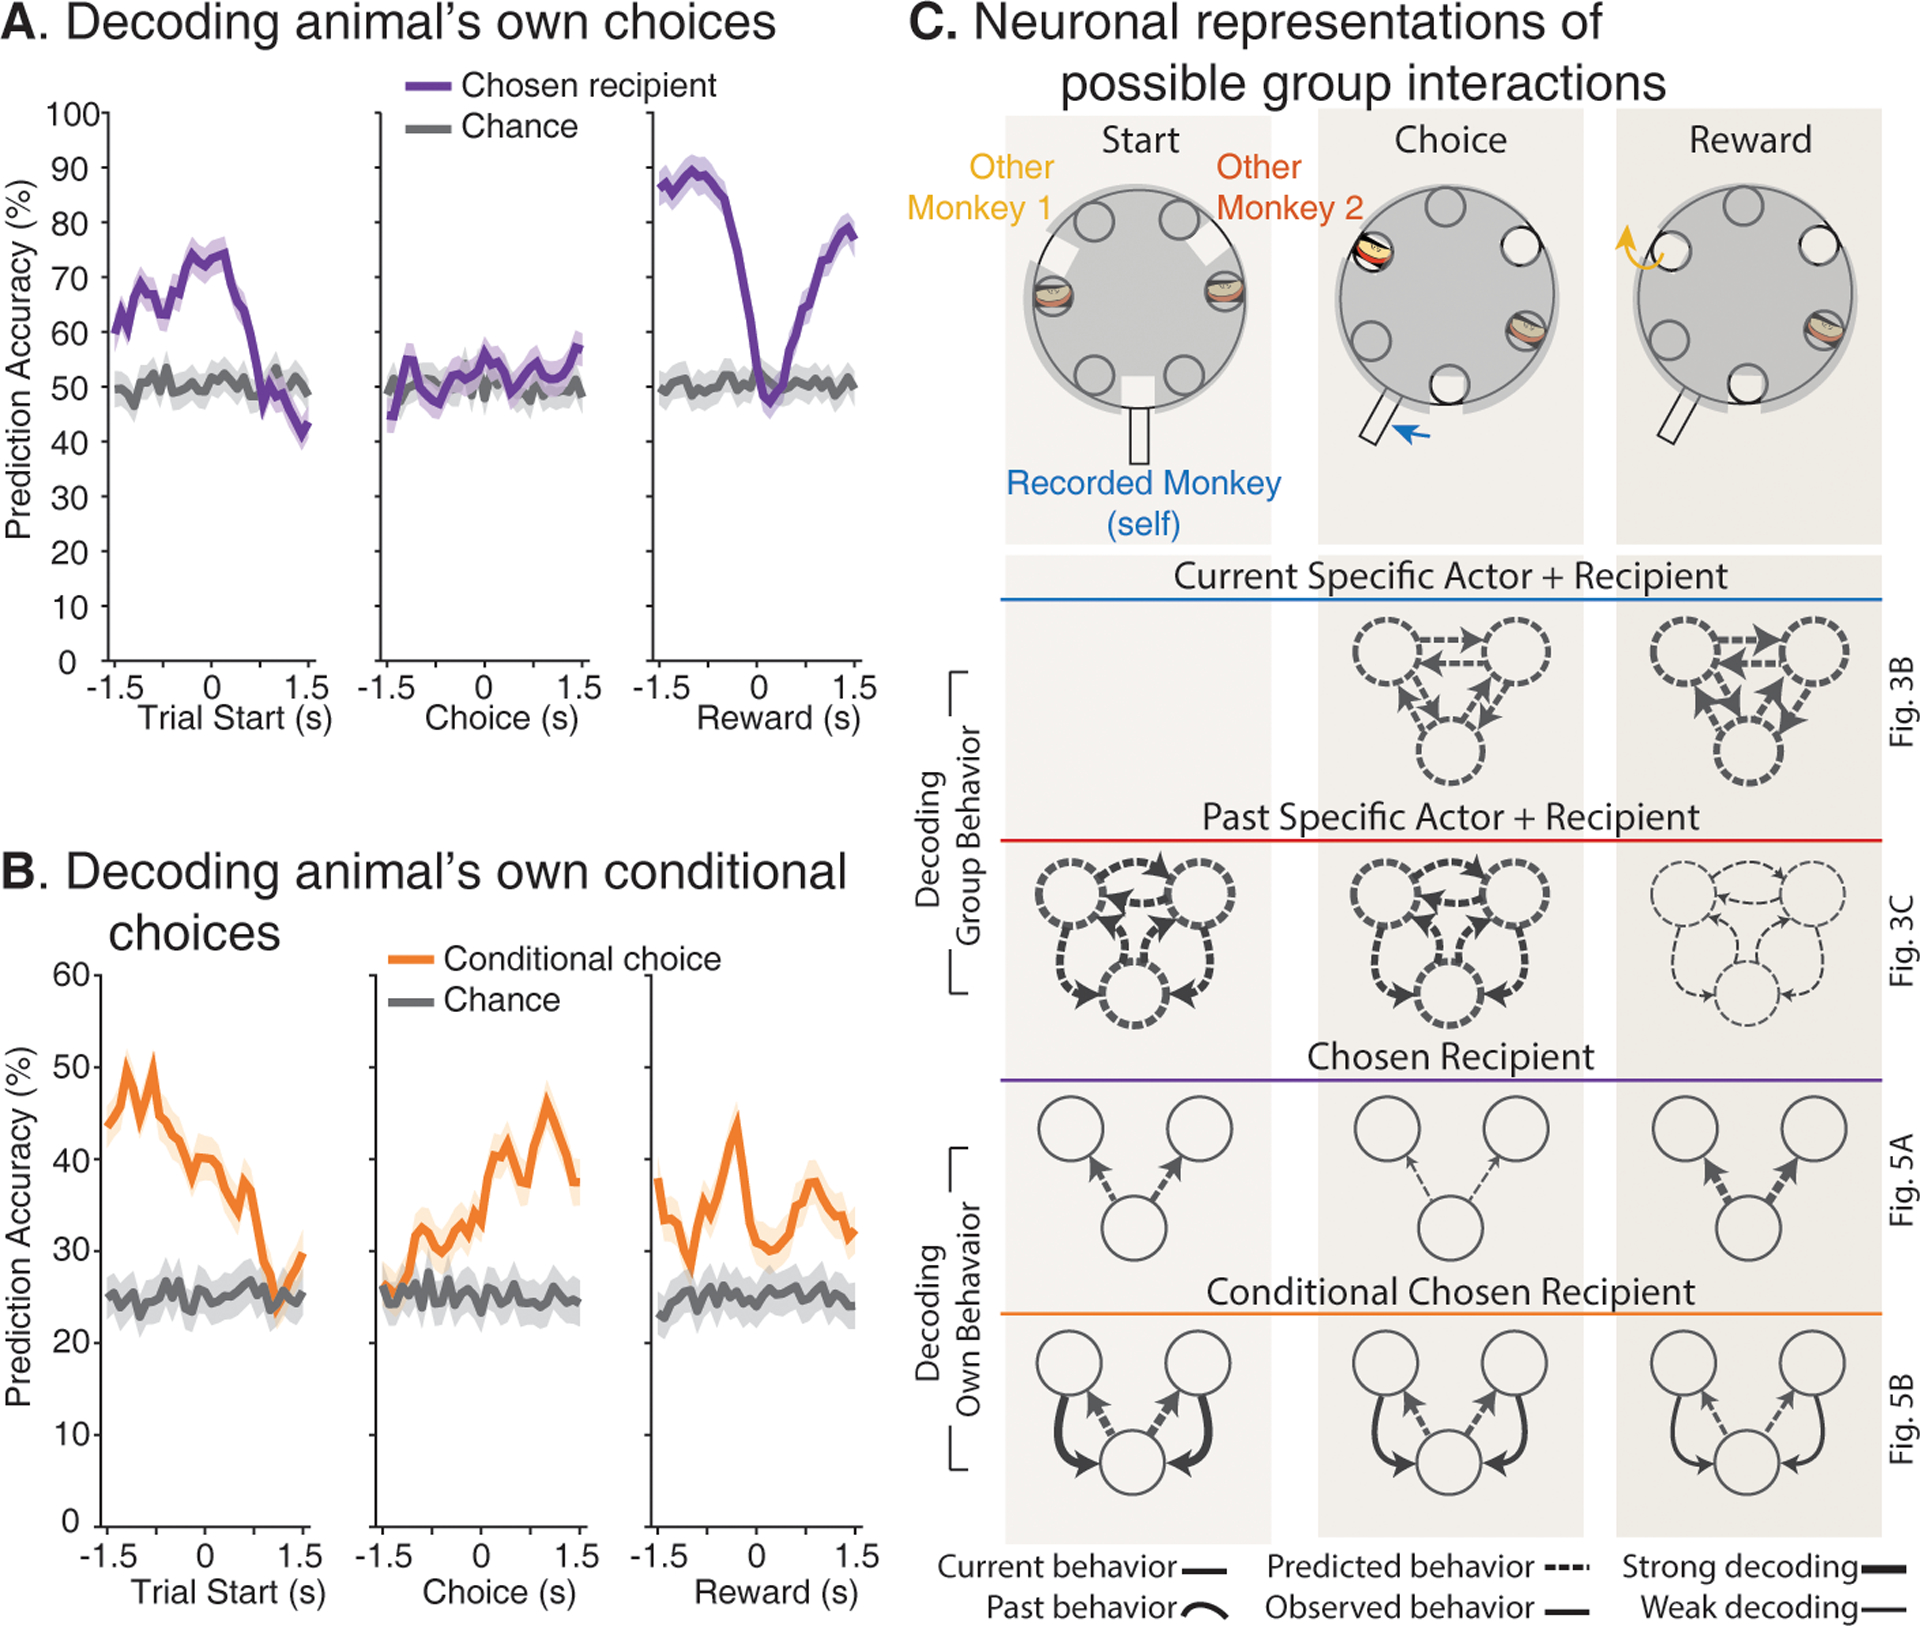
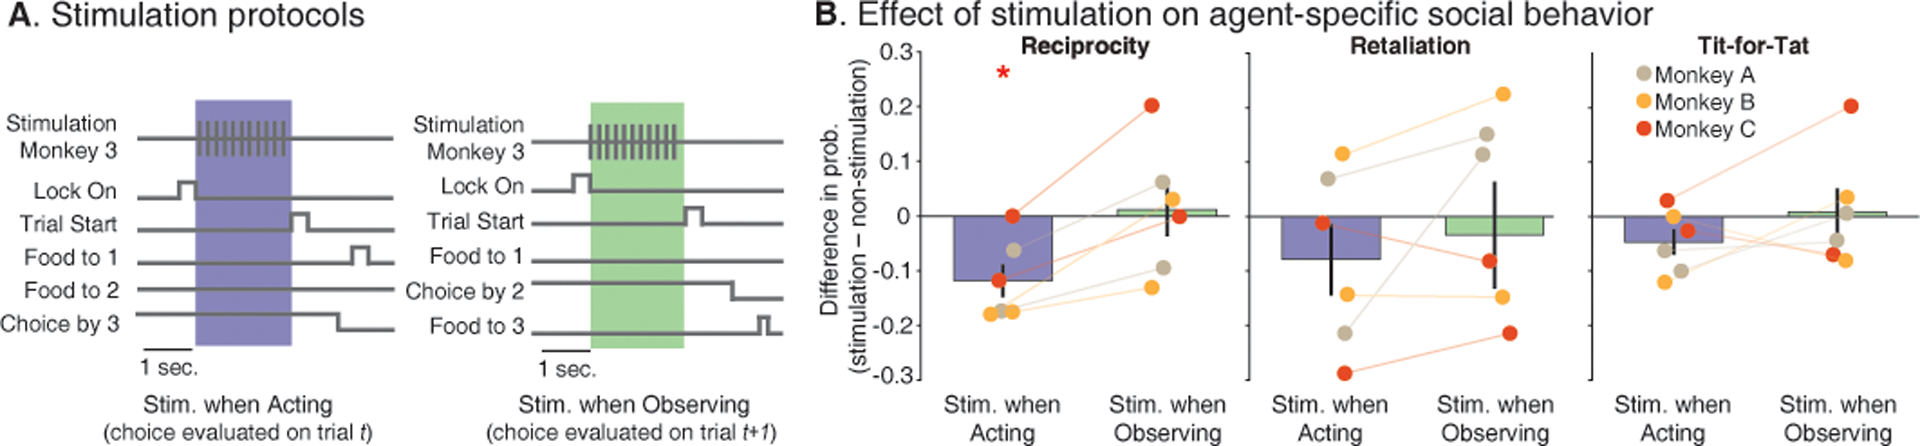
The ability to interact effectively within social groups is essential to primate and human behavior. Yet understanding the neural processes that underlie the interactive behavior of groups or by which neurons solve the basic problem of coding for multiple agents has remained a challenge. By tracking the interindividual dynamics of groups of three interacting rhesus macaques, we discover detailed representations of the groups’ behavior by neurons in the dorsomedial prefrontal cortex, reflecting not only the other agents’ identities but also their specific interactions, social context, actions, and outcomes. We show how these cells collectively represent the interaction between specific group members and their reciprocation, retaliation, and past behaviors. We also show how they influence the animals’ own upcoming decisions and their ability to form beneficial agent-specific interactions. Together, these findings reveal prefrontal neurons that code for the agency identity of others and a cellular mechanism that could support the interactive behavior of social groups.


Conflict of interest statement

Competing interests: The authors declare no conflict of interest.

Figures

Fig. 1.
Fig. 1.. Three-agent task for testing partner-specific interactions in Rhesus macaques.
(A) Groups of three monkeys sat around a custom-made turntable apparatus that allowed them to interact with each other through food allocation. All monkeys could observe the initial food location through a transparent cover (shown in green), the actor’s choice, and the reward recipient. Turntable movement, together with food location, determined the reward recipient (Fig. S1). (B) Example timing of events for trial shown in A. In this trial, monkey 3 (referred to here as ‘Choice by 3’) offered a reward to monkey 2 (referred to here as ‘Food to 2’). (C) The animals interacted with each other over multiple trials, with the actor on each trial being selected in a pseudo-random fashion. The actor could engage in reciprocity or retaliation based on what the previous actor chose. (D) Control measures were used to dissociate the identities of the different agents from variables such as the direction of movement (left panel), the role of each agent (center panel), or the monkeys’ spatial locations (right panel). (E). Illustration of trial combinations in which the animals displayed reciprocation, retaliation, and tit-for-tat behavior. Arrows show who the actor offered a reward. The animals displayed reciprocation, retaliation, and tit-for-tat behavior with specific individuals at probabilities that were significantly higher than expected from chance (* P < 0.05, ** P < 0.01; Coefficient of Variation (CV)). Bars are the probability of reciprocating compared to not reciprocating ± SEM. Each point depicts an individual’s probability within a particular session (Fig. S2). (F) Gini coefficient illustrates the distribution of reward (dark orange) during a representative session. The highlighted horizontal lines illustrate transient duopolies (permutation test, p < 0.05). For comparison, the distribution of reward expected from chance (gray) and in a representative non-social session (light orange) are displayed separately.
Fig. 2.
Fig. 2.. Selectivity of neurons to specific social agents during group interactions.
(A). The monkey undergoing neuronal recordings from the dmPFC within each session was referred to as ‘Self’, and the two other monkeys as ‘Other Monkey 1’ and ‘Other Monkey 2’. Recorded neurons displayed stable waveform morphology (inset; Fig. S4). (B) Peri-event time histogram and raster examples of neurons that displayed changes in their activities when particular agents within the group received a reward. The inverted black triangles mark when the actor chose. Venn diagram of neurons that displayed response selectivity to reward recipient agency. (C). Heatmap of single neurons’ response to reward recipient (top, red) and actor (bottom, blue) aligned to the timing of reward acquisition. Only neurons with significant modulation are shown (ANOVA, P < 0.01). (D) Top, normalized population activity of neurons encoding ‘specific-other-reward’ to the preferred and the non-preferred other monkey. Bottom, the same neuronal population as above but parsed by the absence or presence of a possible reward prediction error for ‘self’. (E) The locations of Other Monkey 1 and Other Monkey 2 were switched halfway in the session to test the selectivity of neuronal responses to specific agents independently of their spatial locations. Heatmap of neuronal activities on a ternary plot before and after the switch of a representative neuron. Here, each vertex represents maximal neuronal activity for a particular monkey. The color code provides the density of activity across trials. The particular neuron displayed here responded almost exclusively to receipt of a reward by Other Monkey 2 both before and after switching its location relative to the recorded animal. Right, histogram of neurons that retained a preferential response to a specific agent (n = 34, orange), and neurons (n = 4, red) that signaled both reward receipt and location. (F) To test that neuronal responses were not explained by looking at others’ faces, we tracked the recorded animals’ eye positions during an inter-trial period. Middle, distribution of neurons’ activity displaying social agent-specific reward responses based on whether others received reward (top, orange) or the recorded animal looked at others during the inter-trial period (bottom, blue; normalized to the preferred animal). Right, proportion of cells (***, P < 0.0001). (G) The primates performed the same task but in the absence of social agents to test the effect of social context on neuronal responses. Middle, distribution of the absolute normalized difference in firing rates of individual-specific reward neurons based on social agents (orange), or non-social agents (green). Right, the proportion of neurons relative to the total number of recorded neurons on each task.
Fig. 3.
Fig. 3.. Neural population predictions of specific interactions within the group.
(A) Top, a neuron that displayed a change in its activity based on whether Other Monkey 1 or Other Monkey 2 was the actor. Bottom, a neuron that displayed a change in its activity based on whether Other Monkey 1 or Other Monkey 2 were the actor but only when they specifically offered a reward to the recorded. Insets, average firing rate for each condition during a 1s time window centered at 0.3 s before the reward was acquired. Lower inset, proportions of neurons encoding specific agent receiving a reward, the specific actor offering a reward and the combination of the specific actor and recipient across all possible interaction types. (B) Left, decoding performance for specific actor and recipient, separately. Right, decoding performance for specific interactions in which both the actor and recipient of reward were decoded on a trial-by-trial basis. Multi-class one-vs-all decoders were trained with 80% of trials and tested on the remainder 20% trials (1 s window advanced in 0.1 s intervals). The colored curves indicate mean prediction accuracy on test trials (± 95% confidence interval). (C) Left, decoding performance for the combination of specific actor and reward recipient in the previous trial when the recorded animal is the actor in the current trial and, therefore, planning their choice. Right, Venn diagram of the number of neurons displaying selectivity for the specific actor (blue) and the specific recipient (orange) in the past trial (* P < 0.05, ** P < 0.01).
Fig. 4.
Fig. 4.. Dependency between past interactions and predictions of upcoming choices.
(A) Neuronal responses accurately predicted the animal’s own upcoming choices before making their motor selection. (B) The animal’s past interactions modulated neuronal predictions of the animal’s upcoming choice. By considering both the other monkeys’ choices and the recorded animals’ current choice combinations, the curves here reflect neuronal population predictions contingent on the other’s past actions. (C) Summary of decoding results. Each column corresponds to one distinct epoch and each row to the relevant information decoded. The arrows reflect the actor (circle) offering a reward to another agent. Each set of arrows reflects the possible combinations of current/past behavior, predicted/observed behavior, and the relative strengths of decoding. Thus, for example, thick arrows indicate that those specific interactions could be highly accurately decoded from neural population response whereas thin arrows indicate that decoding accuracy for those interactions was poor when compared to chance. The relevant figures for each panel are shown on the right to allow for ease of comparison.
Fig. 5.
Fig. 5.. Effect of stimulation in the dmPFC on group interactions and its selectivity.
(A) Brief event-triggered electrical stimulation was delivered bilaterally to the dmPFC (200 Hz, 0.1 mA over 2 seconds, given between locking of the apparatus and trial start) as the primates performed the same task as before. Stimulation was given either when the animal was the actor (blue background) or when they were the observer (green background) for control comparison. (B) The bar plot provides the mean difference in probability of reciprocating, retaliating, or using the tit-for-tat strategy on stimulated vs. non-stimulated (baseline) trials ± SEM. Each point depicts individual sessions color-coded by the animal receiving stimulation. Additional controls used to confirm that stimulation did not affect more basic motoric behavior or cognitive processes such as attention are described in the Main Text. For specific comparisons * P < 0.05.

Comment in

References

    1. Clutton-Brock T, Cooperation between non-kin in animal societies. Nature 462, 51–57 (2009). - PubMed
    1. Sliwa J, Duhamel J-R, Pascalis O, Wirth S, Spontaneous voice–face identity matching by rhesus monkeys for familiar conspecifics and humans. Proceedings of the National Academy of Sciences 108, 1735–1740 (2011). - PMC - PubMed
    1. Hamilton WD, The evolution of altruistic behavior. The American Naturalist 97, 354–356 (1963).
    1. Nowak MA, Sigmund K, Tit for tat in heterogeneous populations. Nature 355, 250 (1992).
    1. Nowak MA, Five rules for the evolution of cooperation. Science 314, 1560–1563 (2006). - PMC - PubMed

Publication types