. 2021 Oct 28;184(22):5653-5669.e25.
doi: 10.1016/j.cell.2021.10.002. Epub 2021 Oct 20.

Mapping the genetic landscape of DNA double-strand break repair

Affiliations

Mapping the genetic landscape of DNA double-strand break repair

Jeffrey A Hussmann et al. Cell. .

Abstract

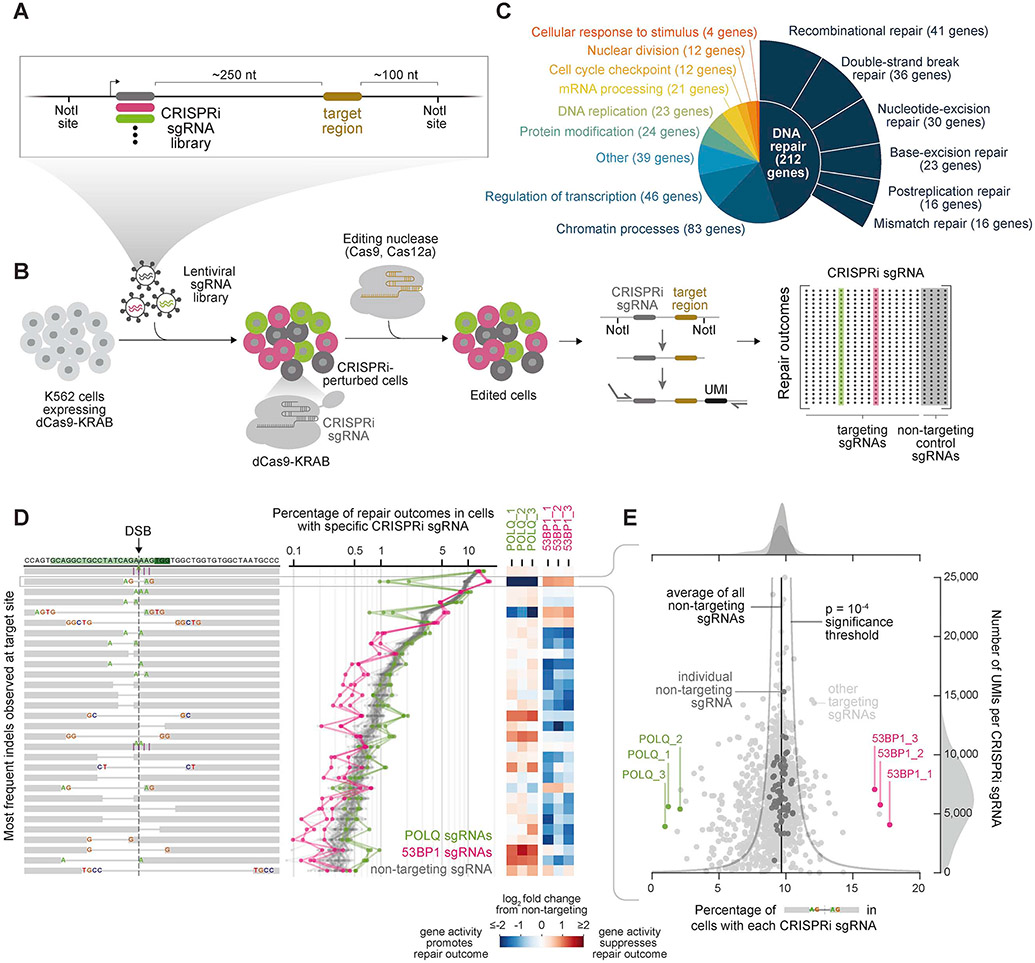
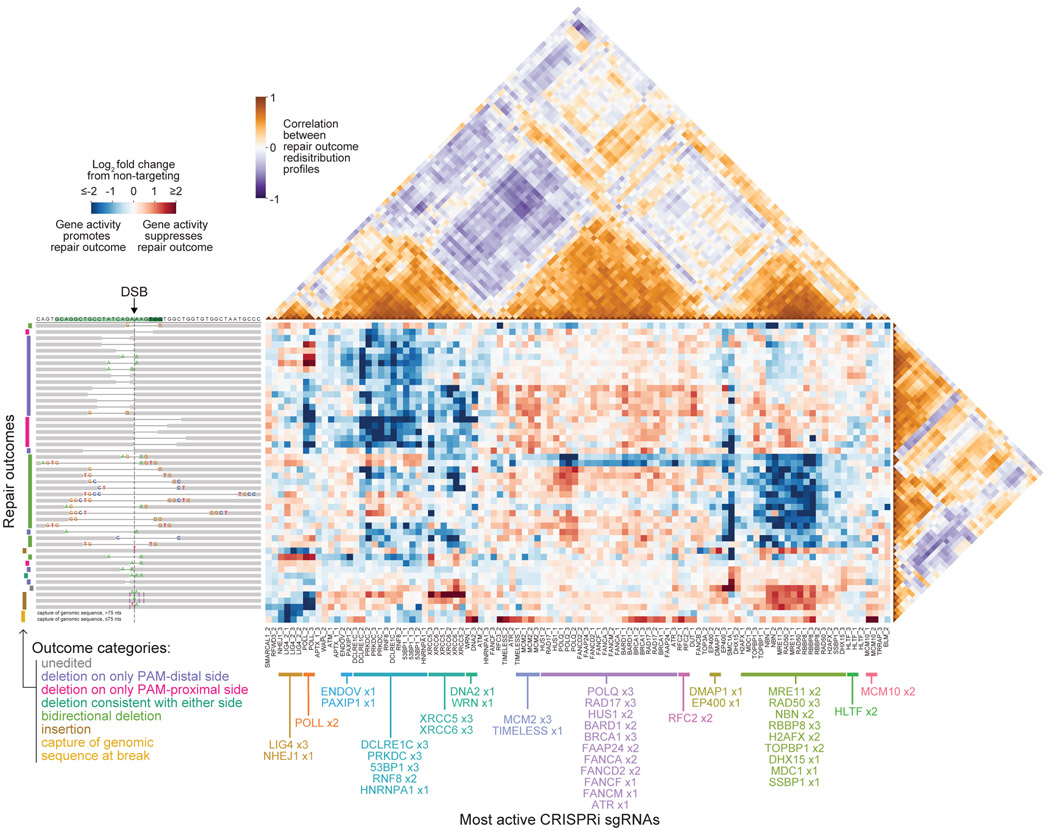
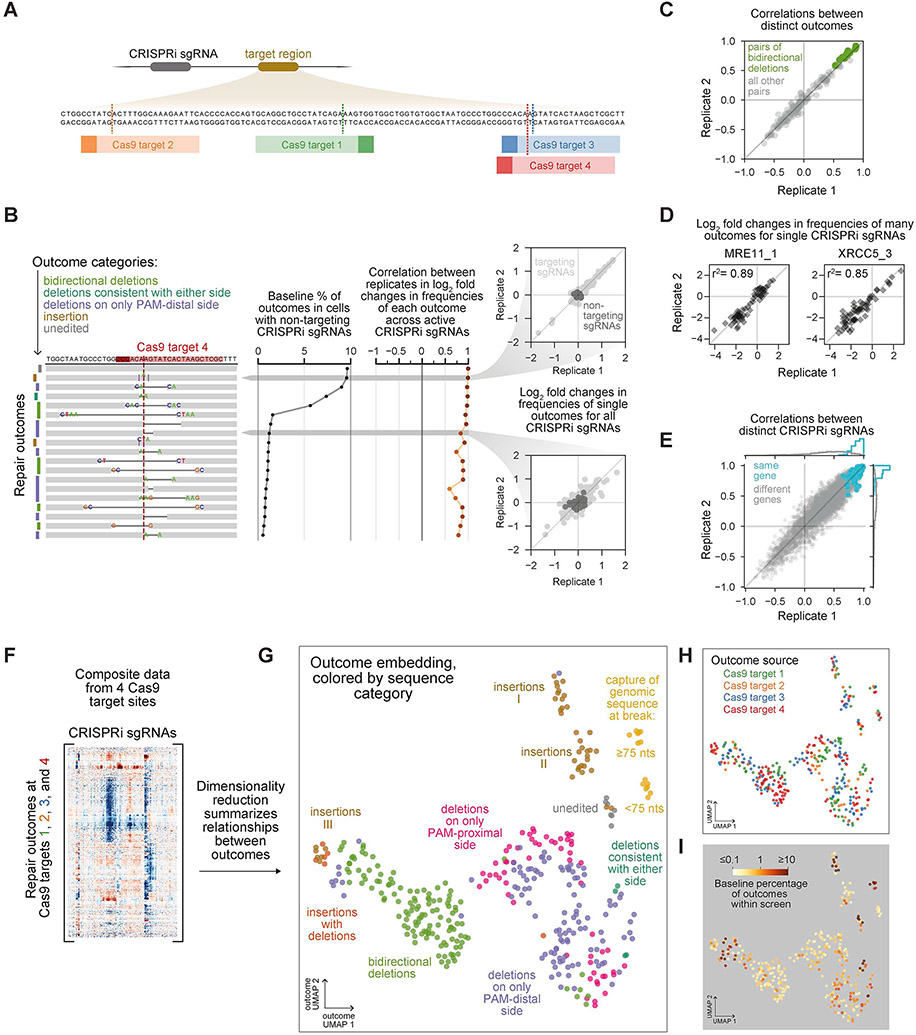
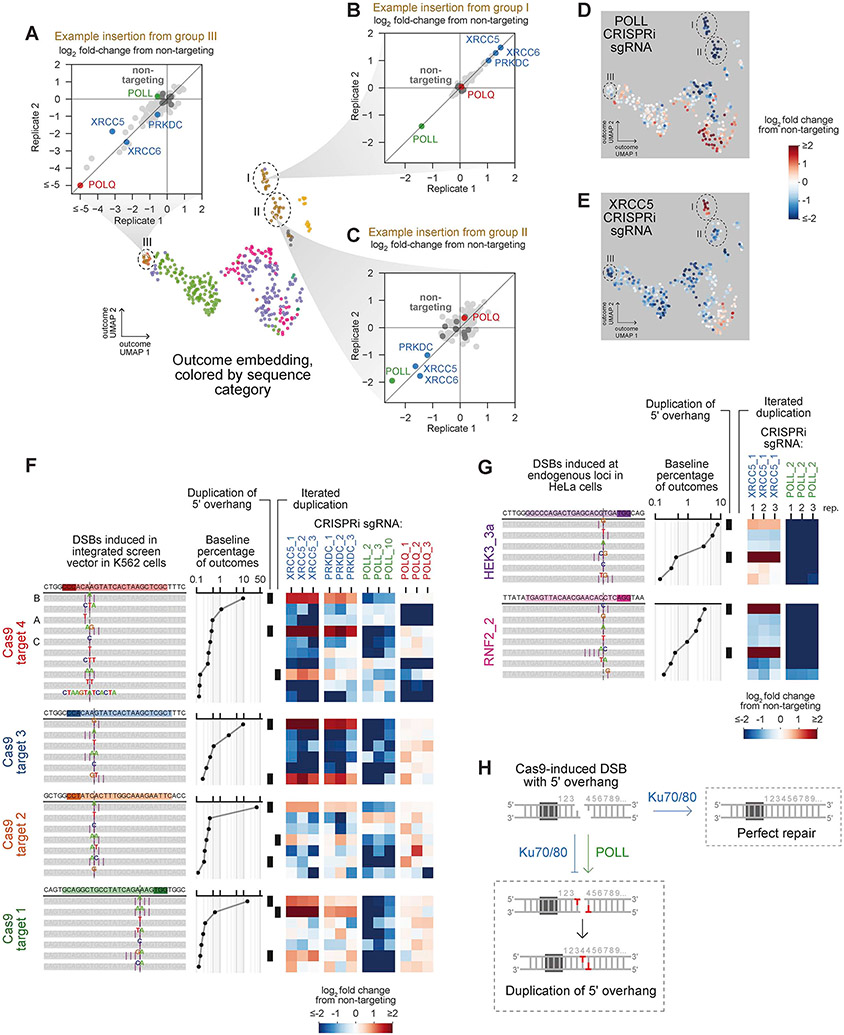
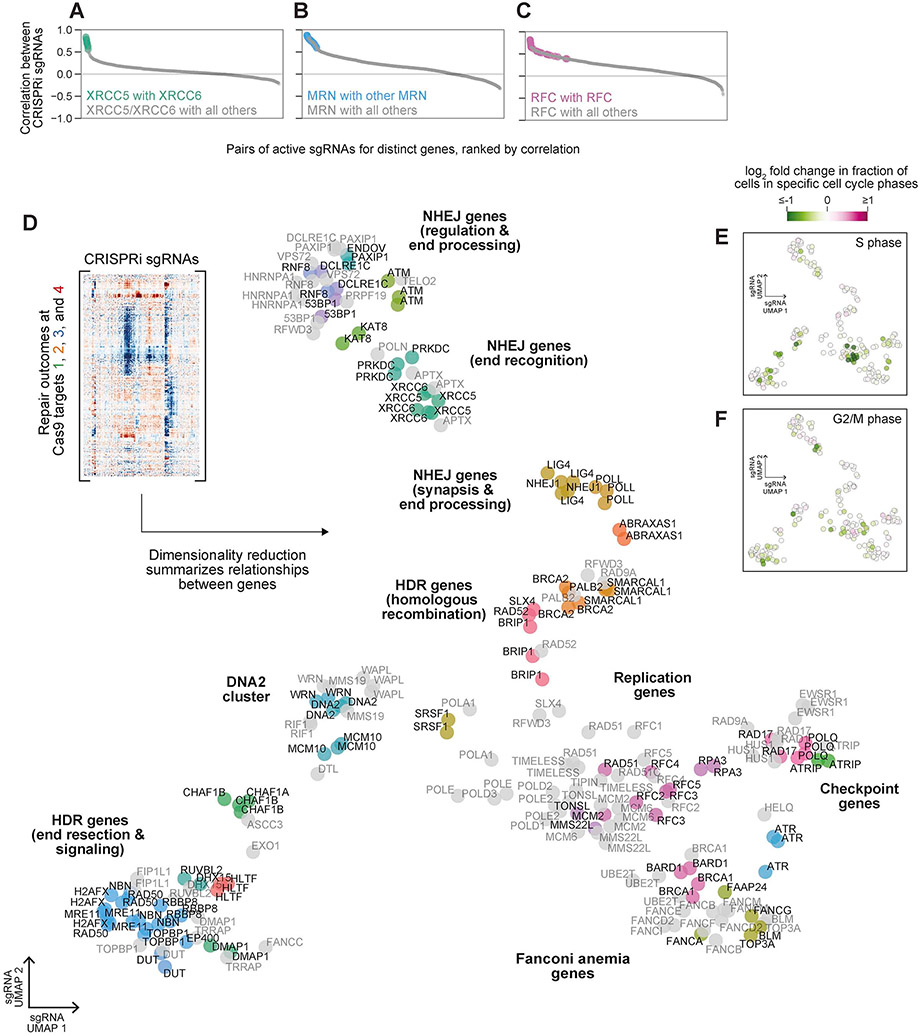
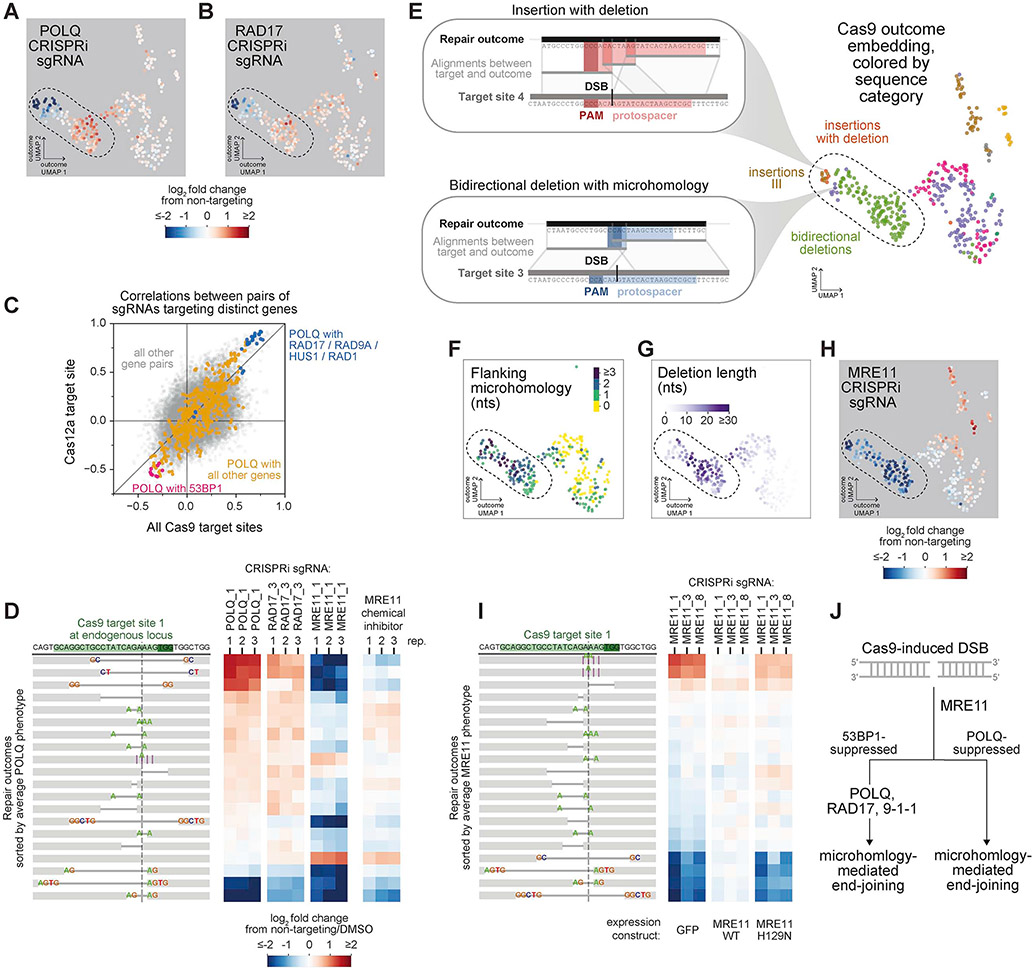
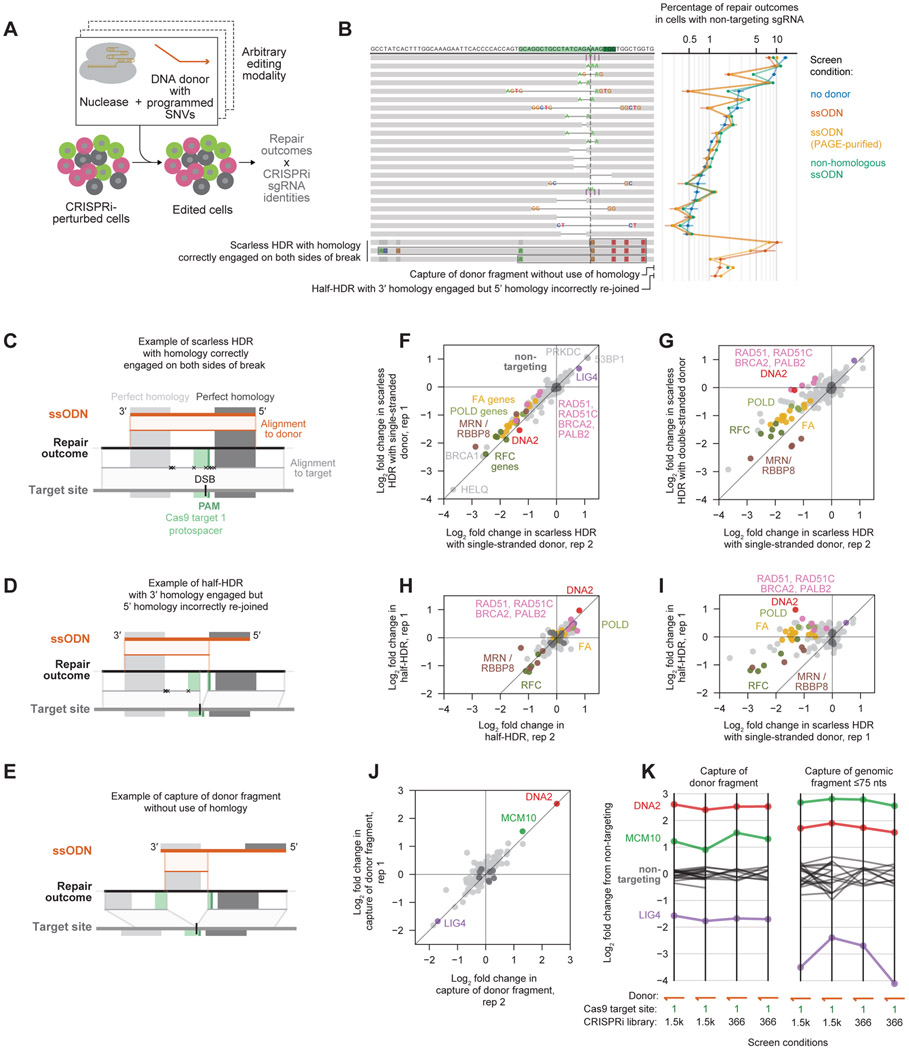
Cells repair DNA double-strand breaks (DSBs) through a complex set of pathways critical for maintaining genomic integrity. To systematically map these pathways, we developed a high-throughput screening approach called Repair-seq that measures the effects of thousands of genetic perturbations on mutations introduced at targeted DNA lesions. Using Repair-seq, we profiled DSB repair products induced by two programmable nucleases (Cas9 and Cas12a) in the presence or absence of oligonucleotides for homology-directed repair (HDR) after knockdown of 476 genes involved in DSB repair or associated processes. The resulting data enabled principled, data-driven inference of DSB end joining and HDR pathways. Systematic interrogation of this data uncovered unexpected relationships among DSB repair genes and demonstrated that repair outcomes with superficially similar sequence architectures can have markedly different genetic dependencies. This work provides a foundation for mapping DNA repair pathways and for optimizing genome editing across diverse modalities.

Keywords: CRISPR-Cas9; DNA repair; double-strand breaks; functional genomics; genome editing.


Conflict of interest statement

Declaration of interests Editas Medicine was involved in this work and provided reagents. B.A. was a member of a ThinkLab Advisory Board for, and holds equity in, Celsius Therapeutics. J.A.H. is a consultant for Tessera Therapeutics. J.S.W. declares outside interest in 5 AM Venture, Amgen, Chroma Medicine, KSQ Therapeutics, Maze Therapeutics, Tenaya Therapeutics, Tessera Therapeutics, and Third Rock Ventures. A.B. and C.C.-R. are former employees and shareholders of Editas Medicine and were employed by Editas at the time this work was conducted. J.A.H. and B.A. have filed patent applications on related work.

Figures

Figure 1.
Figure 1.. Repair-seq is a high-resolution screening platform for systematically interrogating DNA repair processes
(A) Schematic of Repair-seq screening vector with linked CRISPRi sgRNA expression cassette and target region for induced DNA damage. (B) Experimental workflow of a Repair-seq screen. Cells expressing a CRISPRi effector protein (dCas9-KRAB) are infected with CRISPRi sgRNAs linked to a targetable editing region. After allowing time for targeted gene repression, a programmable nuclease pre-complexed with a gRNA targeting the editing site is delivered to perturbed cells by electroporation. The genomic region containing the CRISPRi sgRNA and repair outcome is then isolated, ligated with a unique molecular identifier (UMI), and amplified. Paired-end sequencing of linked CRISPRi sgRNA identities and repair outcomes then measure perturbation-specific repair outcome distributions. (C) Functional annotations for 476 genes targeted by 1,573 sgRNA CRISPRi library. (D) Screen data viewed from perturbation-centric perspective. Diagrams (left) show the 30 most frequent indels observed. Green rectangles in the top row mark the protospacer and PAM of the Cas9 target site. Vertical dashed line marks the expected DSB location. Insertions are marked by purple vertical lines and deletions by grey horizontal lines. Line plots show frequencies of each outcome for indicated sgRNAs. Heatmaps show log2 fold changes in each outcome frequency for POLQ or 53BP1 sgRNAs relative to all non-targeting sgRNAs. (E) Screen data viewed from outcome-centric perspective, focusing on the indicated microhomology-flanked 4 nt deletion. Scatter plot shows number of UMIs recovered for each sgRNA (y-axis) against the percentage of UMIs reporting this deletion (x-axis).
Figure 2.
Figure 2.. Repair-seq enables data-driven inference of the genetic organization of DSB repair pathways
Central heatmap shows log2 fold changes in repair outcome frequencies for the 100 most active CRISPRi sgRNAs relative to the average of all non-targeting sgRNAs, hierarchically clustered along both dimensions. Rows correspond to outcomes depicted by diagrams on the left, and columns correspond to individual CRISPRi sgRNAs. Triangular heatmaps depict correlations between pairs of sgRNAs (above) and between pairs of outcomes (right). sgRNA cluster assignments are labeled below.
Figure 3.
Figure 3.. A systematic map of the genetic dependencies of repair outcomes generated at Cas9-induced DSBs
(A) Cas9 target sites. Data from screens at target site 4 are shown in panels B-E; data from other target sites are shown in Figure S3. (B) Reproducibility of the effects of CRISPRi sgRNAs on individual outcome frequencies. Black line (middle) shows baseline percentages averaged across two replicates. Brown line (right) shows correlations between replicates in log2 fold changes to outcome frequencies across the 100 most active sgRNAs (right). Insets compare changes in frequency of a common insertion (top) or less common deletion (bottom) for all CRISPRi sgRNAs between two replicates. (C) Correlations between pairs of distinct outcomes in log2 fold changes in frequency across active sgRNAs. Green points mark pairs of distinct bidirectional deletions; light grey points mark all other outcome pairs. (D) Log2 fold changes in frequency of outcomes produced by indicated sgRNAs targeting MRE11 and XRCC5 in two replicate screens. All outcomes above baseline frequency of 0.5% are plotted. (E) Correlations between pairs of distinct CRISPRi sgRNAs in log2 fold changes in frequency across outcomes. Blue points mark pairs of sgRNAs targeting the same gene; grey points mark pairs of sgRNAs targeting distinct genes. (F) Composite matrix of changes in outcome frequencies in screens performed at all four Cas9 target sites. See also Figure S4. (G) UMAP embedding summarizing relationships between outcomes at Cas9 target sites based on their genetic dependencies. Points represent outcomes from individual screen replicates; colors represent outcome sequence architecture categories. (H+I) UMAP embedding of Cas9 outcomes colored by Cas9 target site of origin (H) or baseline frequency of outcome (I).
Figure 4.
Figure 4.. Insertions at Cas9-induced DSBs have distinct sets of dependencies on core NHEJ factors
(A-C) Effects of gene knockdowns on the frequency of representative insertions from indicated outcome groups. Points depict the mean log2 fold change in frequency of the insertion relative to non-targeting sgRNAs for the two sgRNAs with the most extreme phenotypes targeting each gene. See also Figure 3G. (D+E) Log2 fold changes in outcome frequencies produced by indicated CRISPRi sgRNAs overlaid on UMAP embedding of Cas9 outcomes. (F) Effects of indicated CRISPRi sgRNAs on the most frequent insertions at four Cas9 target sites. Letters to the left of outcome diagrams mark insertions highlighted in panels (A-C). Black bars mark insertions that duplicate PAM-distal sequence adjacent to the canonical DSB location or insertions consistent with multiple iterated duplications. (G) Effects of indicated CRISPRi sgRNAs on insertions at endogenous loci in HeLa cells. (H) Model for generation of Cas9-induced insertions from 5′ overhangs.
Figure 5.
Figure 5.. Systematic inference of functional relationships between DNA repair genes
(A-C) Correlations between outcome redistribution signatures for pairs of active sgRNAs targeting distinct genes where one or both genes is a member of a known complex: XRCC5 and XRCC6 (A), MRE11, RAD50, and NBN (B), or RFC2, RFC3, RFC4, and RFC5 (C). (D) UMAP embedding of outcome redistribution signatures for individual sgRNAs (columns of the indicated composite matrix of Cas9 outcome frequency changes). sgRNAs are colored by cluster assignments prior to dimensionality reduction; grey points were not assigned to a specific cluster. sgRNAs are labeled with GeneCards gene symbols (www.genecards.org), except that a common alias 53BP1 is used for gene symbol TP53BP1. We note other common aliases: XLF (NHEJ1), ARTEMIS (DCLRE1C), PTIP (PAXIP1), KU80 (XRCC5), KU70 (XRCC6), DNAPK (PRKDC), H2AX (H2AXF), and NBS1 (NBN). (E+F) Changes in the fraction of cells for each sgRNA assigned to S phase (E) or G2/M phase (F) relative to all non-targeting sgRNAs based on expression profiles measured by Perturb-seq.
Figure 6.
Figure 6.. Repair-seq delineates microhomology-mediated end-joining pathways
(A+B) Log2 fold changes in outcome frequencies produced by indicated CRISPRi sgRNAs overlaid on the UMAP embedding of Cas9 outcomes. See also Figure 3G. (C) Comparison of correlations between outcome redistribution signatures for pairs of sgRNAs targeting distinct genes between composite Cas9 screens and Cas12a screen. (D) Effects of indicated CRISPRi sgRNAs or of chemical MRE11 inhibitor on repair outcome frequencies at Cas9 target site 1 in the endogenous HBB locus. Heatmaps display log2 fold changes in outcome frequency for the 20 outcomes with highest baseline frequency, sorted by average log2 fold change across POLQ sgRNA replicates. (E) Examples of Cas9-induced mutations consistent with known Pol θ-mediated architectures (insets). Top black lines represent the sequence of a repair outcome; bottom grey line represents the sequence flanking the targeted DSB in the integrated screening vector; lines between these depict local alignments; and red (top) and blue (bottom) rectangles mark the protospacer and PAM of Cas9 target sites. (F+G) Deletions in UMAP embedding of Cas9 outcomes colored by the length of microhomology flanking the deletion junction (F) or the length of sequence removed by the deletion (G). (H) Log2 fold changes in outcome frequencies produced by an MRE11-targeting sgRNA overlaid on the UMAP embedding of Cas9 outcomes. The region marked with a dotted line includes the vast majority of MRE11-promoted outcomes and is similarly indicated in panels (A, B, E, F, and G). (I) Effects of indicated CRISPRi sgRNAs on outcome frequencies in cells ectopically expressing MRE11 + GFP, or nuclease-inactive MRE11 (H129N) + GFP, or control (GFP). Heatmaps (right) display log2 fold changes in the frequencies of the 20 outcomes with highest baseline frequency, sorted by average log2 fold change across MRE11-targeting sgRNAs in control cells. (J) Model of genetically distinct sub-pathways of resection-initiated end joining.
Figure 7.
Figure 7.. Repair-seq is a versatile platform for mapping the genetic determinants of diverse genome editing modalities
(A) Repair-seq can be adapted to interrogate many DNA repair processes. (B) Comparison of baseline outcome frequencies in screens performed with no donor, a ssODN homologous to the target site with or without PAGE-purification, or a ssODN with no homology to the target site. Outcomes (depicted, left) are sorted by average baseline frequency in no-donor screen. Data in line plot (middle) show mean baseline outcome frequencies (+/− s.d.) across replicates. Bottom two rows report the combined frequency of all outcomes with sequence architectures shown in (D) and (E); three rows above these show scarless HDR outcomes containing different subsets of donor-programmed SNVs as in (C). (C+D+E) Examples of distinct categories of repair outcomes that incorporate sequence from ssODNs: scarless HDR outcome (C), “half-HDR” outcome (D), and outcome in which a fragment of the donor has been captured at the break without use of intended homology on either side (E). Middle black lines represent the sequence of a repair outcome; top orange lines represent the donor sequence; bottom grey lines represent the screen vector sequence; and lines between these represent alignments between an outcome and the relevant reference sequence. Xs mark any mismatches. Gray shaded boxes indicate regions of perfect homology between the donor and target region, which flank a homeologous region containing programmed SNVs. (F) Effects of gene knockdown on the frequency of scarless HDR in replicate screens performed using a single-stranded donor with the 1,573 CRISPRi sgRNA library. Each dot depicts the mean log2 fold change in combined frequency of all scarless HDR outcomes for the two sgRNAs targeting each gene with the most extreme phenotypes. (G) Comparison of the effects of gene knockdown on scarless HDR in a screen performed using a single-strand donor (x-axis) and a screen performed using a linear double-stranded donor with the same sequence (y-axis). (H) Effects of gene knockdown on the frequency of half-HDR outcomes in two replicate screens performed using a single-strand donor with the 366 CRISPRi sgRNA library. (I) Comparison of the effects of gene knockdown on the frequency of scarless HDR outcomes (x-axis) and half-HDR outcomes (y-axis) in a screen performed using a single-strand donor. (J) Effects of gene knockdown on the frequency of capture of donor fragment outcomes in two replicate screens performed using a single-stranded donor with the 366 CRISPRi sgRNA library. (K) The effects of repressing select genes on capture of donor fragments (left) and capture of genomic fragments >75 nts (right) in four screens performed using the same single-stranded donor.

Comment in

References

    1. Adamson B, Smogorzewska A, Sigoillot FD, King RW, and Elledge SJ (2012). A genome-wide homologous recombination screen identifies the RNA-binding protein RBMX as a component of the DNA-damage response. Nat. Cell Biol 14, 318–328. - PMC - PubMed
    1. Allen F, Crepaldi L, Alsinet C, Strong AJ, Kleshchevnikov V, De Angeli P, Páleníková P, Khodak A, Kiselev V, Kosicki M, et al. (2019). Predicting the mutations generated by repair of Cas9-induced double-strand breaks. Nat. Biotechnol 37, 64–72. - PMC - PubMed
    1. Anzalone AV, Koblan LW, and Liu DR (2020). Genome editing with CRISPR–Cas nucleases, base editors, transposases and prime editors. Nat. Biotechnol - PubMed
    1. Bothmer A, Phadke T, Barrera LA, Margulies CM, Lee CS, Buquicchio F, Moss S, Abdulkerim HS, Selleck W, Jayaram H, et al. (2017). Characterization of the interplay between DNA repair and CRISPR/Cas9-induced DNA lesions at an endogenous locus. Nat. Commun 8, 1–12. - PMC - PubMed
    1. Bothmer A, Bothmer A, Gareau KW, Abdulkerim HS, Abdulkerim HS, Buquicchio F, Buquicchio F, Buquicchio F, Cohen L, Cohen L, et al. (2020). Detection and Modulation of DNA Translocations during Multi-Gene Genome Editing in T Cells. Cris. J 3, 177–187. - PubMed

Publication types

Substances