. 2021 Dec 15;109(24):4080-4093.e8.
doi: 10.1016/j.neuron.2021.09.045. Epub 2021 Oct 20.

Interoception of breathing and its relationship with anxiety

Affiliations

Interoception of breathing and its relationship with anxiety

Olivia K Harrison et al. Neuron. .

Abstract

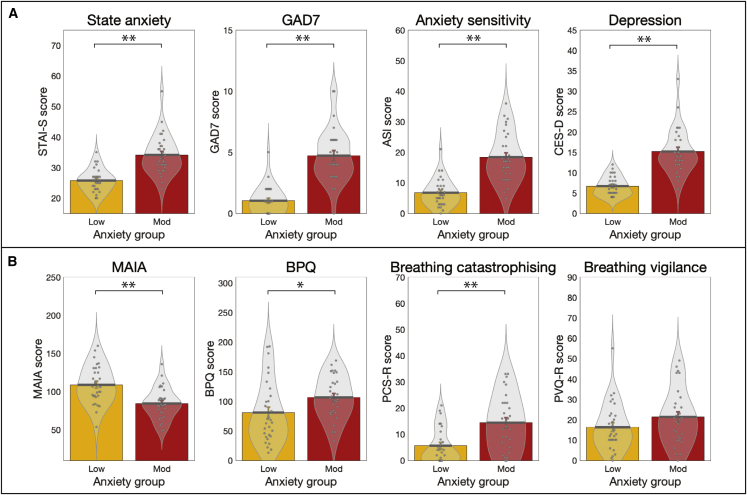
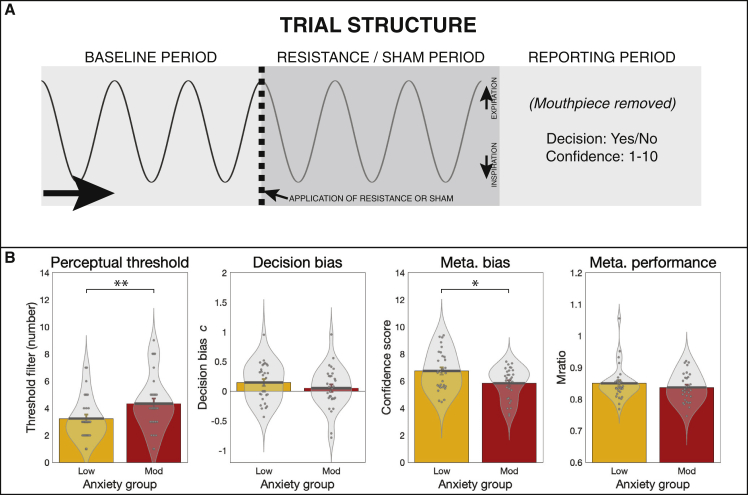
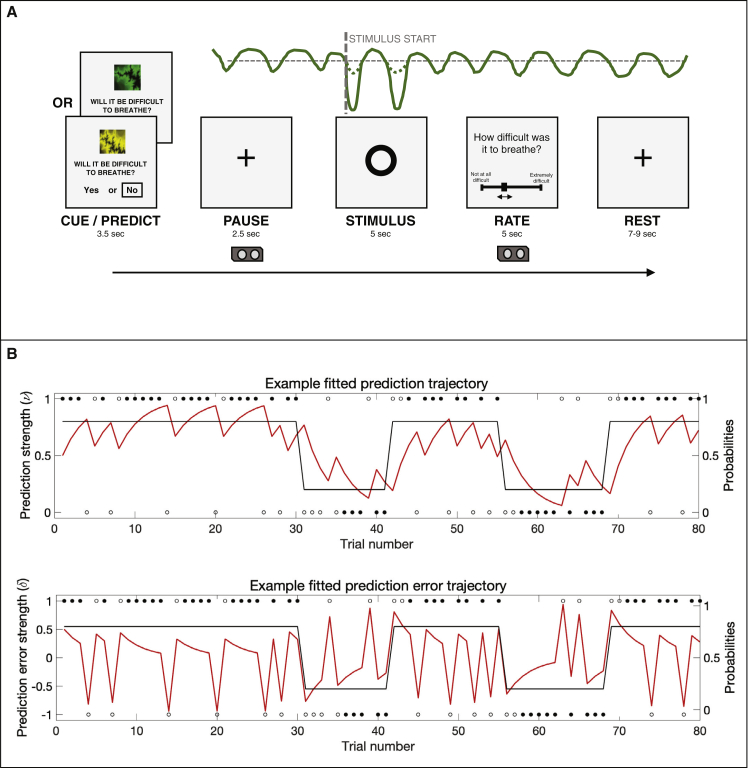
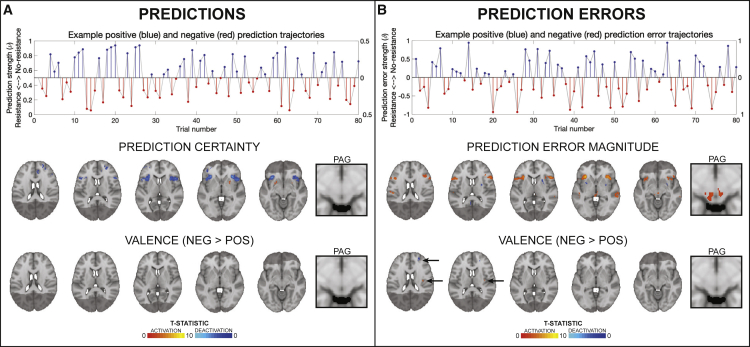
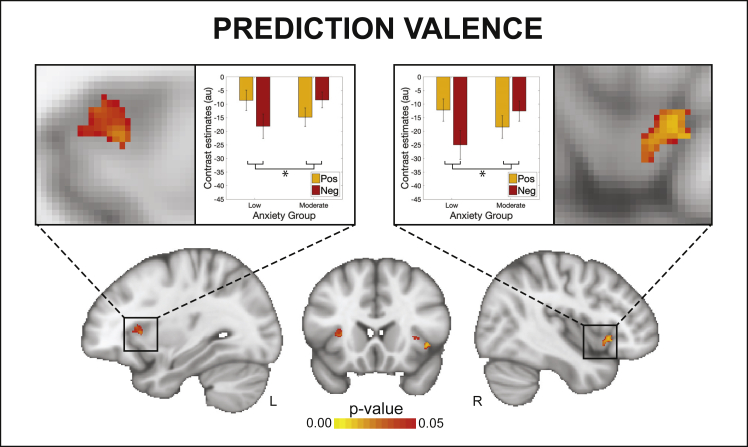
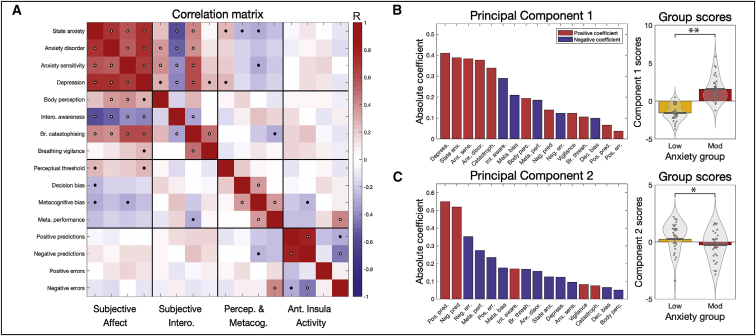
Interoception, the perception of internal bodily states, is thought to be inextricably linked to affective qualities such as anxiety. Although interoception spans sensory to metacognitive processing, it is not clear whether anxiety is differentially related to these processing levels. Here we investigated this question in the domain of breathing, using computational modeling and high-field (7 T) fMRI to assess brain activity relating to dynamic changes in inspiratory resistance of varying predictability. Notably, the anterior insula was associated with both breathing-related prediction certainty and prediction errors, suggesting an important role in representing and updating models of the body. Individuals with low versus moderate anxiety traits showed differential anterior insula activity for prediction certainty. Multi-modal analyses of data from fMRI, computational assessments of breathing-related metacognition, and questionnaires demonstrated that anxiety-interoception links span all levels from perceptual sensitivity to metacognition, with strong effects seen at higher levels of interoceptive processes.

Keywords: anxiety; breathing; inspiratory resistance; interoception.


Conflict of interest statement

Declaration of interests F.V. has been invited to scientific meetings, consulted and/or served as speaker, and received compensation from Lundbeck, Servier, Recordati, Janssen, Otsuka, LivaNova, and Chiesi. None of these links are related to this work. The authors declare no other competing interests.

Figures

Figure 1
Figure 1
Results from the affective and interoceptive questionnaires measured in groups of healthy individuals with either low or moderate levels of anxiety Participants with low anxiety scored 20–25 on the Spielberger Trait Anxiety Inventory (STAI-T), and those with moderate anxiety scored ≥35 on the STAI-T. (A) Affective questionnaires: state anxiety, Spielberger State Anxiety Inventory; GAD-7, Generalized Anxiety Disorder Questionnaire; anxiety sensitivity, Anxiety Sensitivity Index; depression, Center for Epidemiologic Studies Depression Scale. (B) Interoceptive questionnaires: MAIA, Multidimensional Assessment of Interoceptive Awareness Questionnaire; BPQ, Body Perception Questionnaire; breathing catastrophizing, Pain Catastrophizing Scale (with the word “pain” substituted for “breathing”); breathing vigilance, Pain Vigilance Awareness Questionnaire (with the word “pain” substituted for “breathing”). Significant at p < 0.05. ∗∗Significant following Bonferroni correction for multiple comparisons across all eight questionnaires. Bar plots represent mean ± SE, with the distribution of values overlaid in gray. Bar plot code adapted from the CANLAB Toolbox (https://github.com/canlab). See also Figure S1.
Figure 2
Figure 2
Trial structure and results from the filter detection task (FDT) (A) For each trial participants first took three breaths on the system (baseline period), before either an inspiratory resistance or sham was applied. Following three further breaths, participants removed the mouthpiece and reported their decision as to whether a resistance was added (yes or no), and their confidence in their decision (1–10, where 1 = not at all confident/guessing and 10 = maximally confident). Adapted from Harrison et al. (2021a) under Creative Commons license. (B) Results from the FDT: individuals with moderate anxiety (scores of ≥35 on the Spielberger Trait Anxiety Inventory [STAI-T]) demonstrated a higher (less sensitive) perceptual threshold and lower metacognitive bias (lower average confidence) compared with individuals with low levels of anxiety (scores of 20–25 on the STAI-T). No difference was found between groups for decision bias (where c values below zero indicate a tendency to report the presence of resistance) or metacognitive performance (where higher values indicate better metacognitive performance). Significant at p < 0.05. ∗∗Significant following Bonferroni correction for multiple comparisons across all FDT measures. Bar plots represent mean ± SE, with the distribution of values overlaid in gray. Bar plot code adapted from the CANLAB Toolbox (https://github.com/canlab).
Figure 3
Figure 3
The breathing learning task (BLT), used to measure dynamic learning of breathing-related stimuli (A) An overview of the single trial structure, in which one of two cues was presented and participants were asked to predict (on the basis of the cue) whether they thought that an inspiratory breathing resistance would follow. When the circle appeared on the screen, either an inspiratory resistance or no resistance was applied for 5 s, with the resistance set to 70% of the individual’s maximal inspiratory resistance. After every trial, participants were asked to rate the intensity of the previous stimulus. The trace in green is an example of a pressure trace recorded at the mouth. (B) The 80-trial trajectory structure of the probability that one cue predicts inspiratory resistance (black trace), where the alternative cue has an exactly mirrored contingency structure, together with example responses (circles). Filled black circles represent stimuli that were correctly predicted, and open black circles represent stimuli that were not correctly predicted. Example fitted prediction (top) and prediction error (bottom) trajectories are overlaid (red traces). The example trajectories were taken from the participant with the closest learning rate to the mean value across all participants. See also Figures S2 and S3 and Tables S1–S4 and S6.
Figure 4
Figure 4
Prediction and prediction-error-related trajectories and brain activity (A and B) Demonstration of how estimated prediction (A) and prediction error (B) trajectories are encoded as positive (i.e., toward no resistance) and negative (i.e., toward resistance) prediction certainty values and prediction error magnitudes. The example trajectories were taken from the participant with the closest learning rate to the mean value across all participants. The solid gray lines demonstrate the estimated prediction or prediction error traces (in stimulus space). Positive trial values are demonstrated in blue and the negative trial values in red, encoded as distance from zero (i.e., absolute values; right axes). The brain images represent significant activity across both groups for prediction certainty (averaged over trials with positive and negative prediction certainty) and the influence of valence on prediction certainty (difference between negative and positive predictions), prediction error magnitude (averaged over trials with positive and negative prediction errors), and the influence of valence on prediction error magnitude (difference between negative and positive prediction errors). The images consist of a color-rendered statistical map superimposed on a standard (MNI 1 × 1 × 1 mm) brain. The bright gray region represents the coverage of the coronal-oblique functional scan. Significant regions are displayed with a cluster threshold of p < 0.05, family-wise error (FWE) corrected for multiple comparisons across all voxels included in the functional volume. PAG, periaqueductal gray. See also Figures S4–S7.
Figure 5
Figure 5
An interaction effect observed between valence (i.e., trials with positive versus negative predictions) and anxiety group (low versus moderate) for activity in the anterior insula related to prediction certainty The images consist of a color-rendered statistical map superimposed on a standard (MNI 1 × 1 × 1 mm) brain. Voxel-wise statistics were performed using non-parametric permutation testing within a mask of the anterior insula and periaqueductal gray, with significant results determined by p < 0.05 (corrected for multiple comparisons within the mask). Bar plots represent mean ± SE for the individual contrast estimates within the significant voxels, plotted separately for each side of the anterior insula. See also Figures S4–S7.
Figure 6
Figure 6
Results from the multi-modal analysis incorporating questionnaires, breathing task data, and peak brain activity in the anterior insula (A) Correlation matrix results for the 16 included measures in the multi-modal analysis. Black dots represent significant values at p < 0.05, while white dots denote significance with correction for multiple comparisons. (B) The weights and group scores of the first significant principal component, where a strong anxiety group difference in component scores is observed. (C) The weights and group scores of the second significant principal component, where a weak anxiety group difference in principal component scores is observed. Significant difference between groups at p < 0.05. ∗∗Significant difference between groups at p < 0.05 with multiple comparison correction for the two significant components. Bar plots (rightmost panels) represent mean ± SE, with the distribution of values overlaid in gray. Bar plot code adapted from the CANLAB Toolbox (https://github.com/canlab). See also Table S7.

Comment in

References

    1. Adolfi F., Couto B., Richter F., Decety J., Lopez J., Sigman M., Manes F., Ibáñez A. Convergence of interoception, emotion, and social cognition: a twofold fMRI meta-analysis and lesion approach. Cortex. 2017;88:124–142. - PubMed
    1. Alius M.G., Pané-Farré C.A., Von Leupoldt A., Hamm A.O. Induction of dyspnea evokes increased anxiety and maladaptive breathing in individuals with high anxiety sensitivity and suffocation fear. Psychophysiology. 2013;50:488–497. - PubMed
    1. Allen M. Unravelling the neurobiology of interoceptive inference. Trends Cogn. Sci. 2020;24:265–266. - PubMed
    1. Allen M., Frank D., Schwarzkopf D.S., Fardo F., Winston J.S., Hauser T.U., Rees G. Unexpected arousal modulates the influence of sensory noise on confidence. eLife. 2016;5:e18103. - PMC - PubMed
    1. Allen M., Levy A., Parr T., Friston K.J. In the body’s eye: the computational anatomy of interoceptive inference. bioRxiv. 2019 doi: 10.1101/603928. - DOI - PMC - PubMed

Publication types

LinkOut - more resources