. 2021 Dec 1:192:1178-1184.
doi: 10.1016/j.ijbiomac.2021.10.058. Epub 2021 Oct 18.

Calsyntenin-3 interacts with the sodium-dependent vitamin C transporter-2 to regulate vitamin C uptake

Affiliations

Calsyntenin-3 interacts with the sodium-dependent vitamin C transporter-2 to regulate vitamin C uptake

Veedamali S Subramanian et al. Int J Biol Macromol. .

Abstract

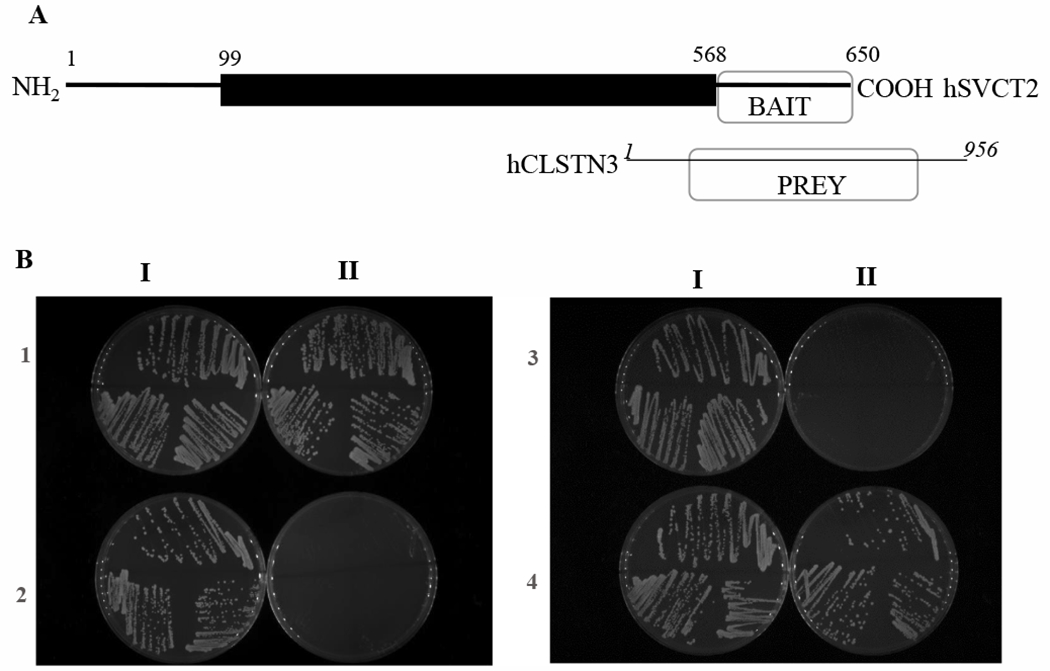
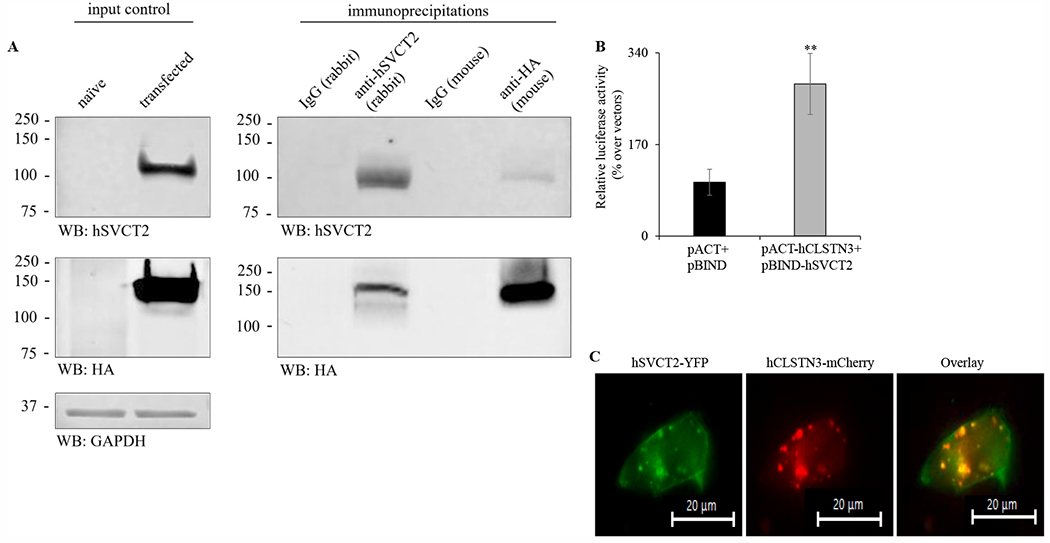
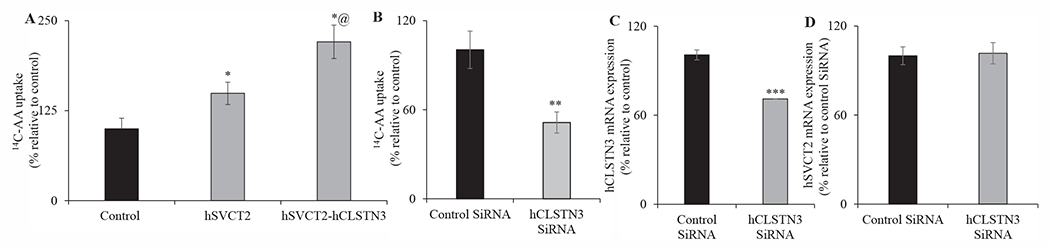
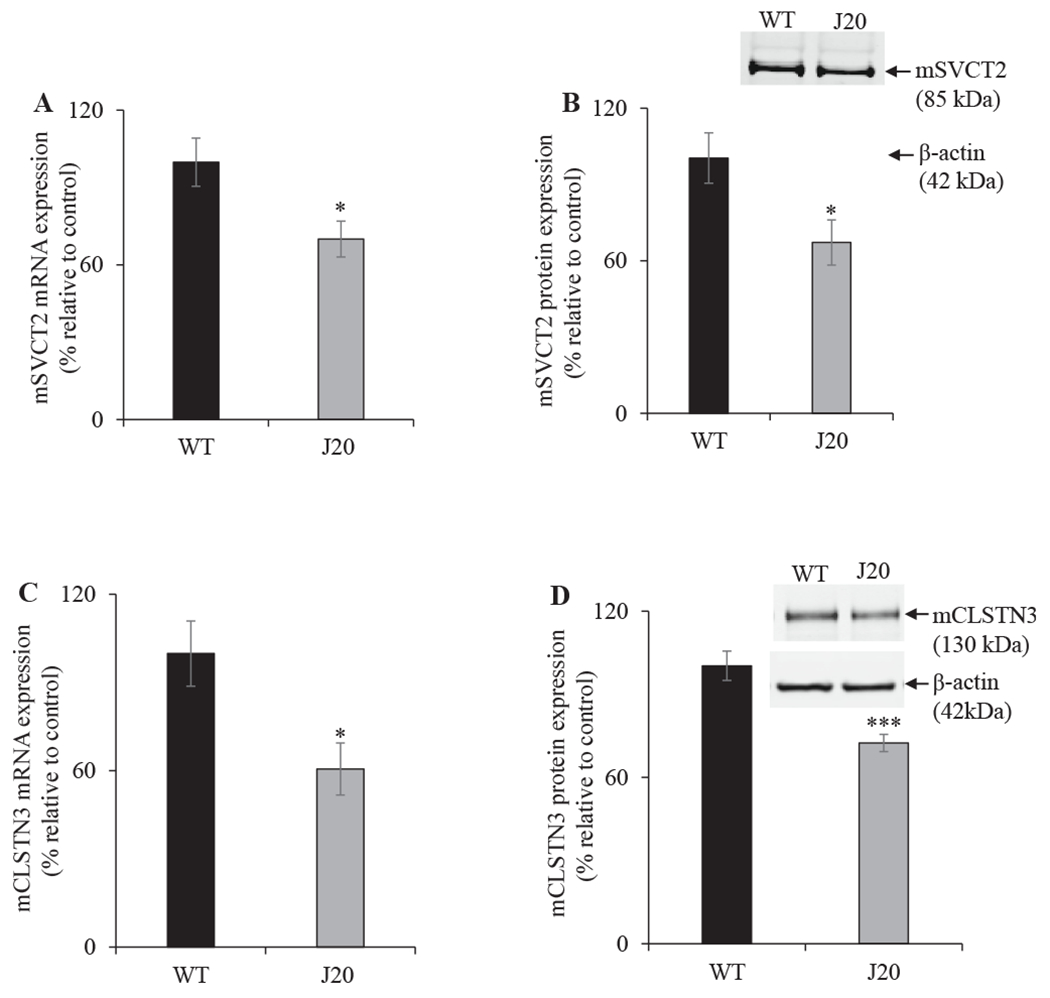
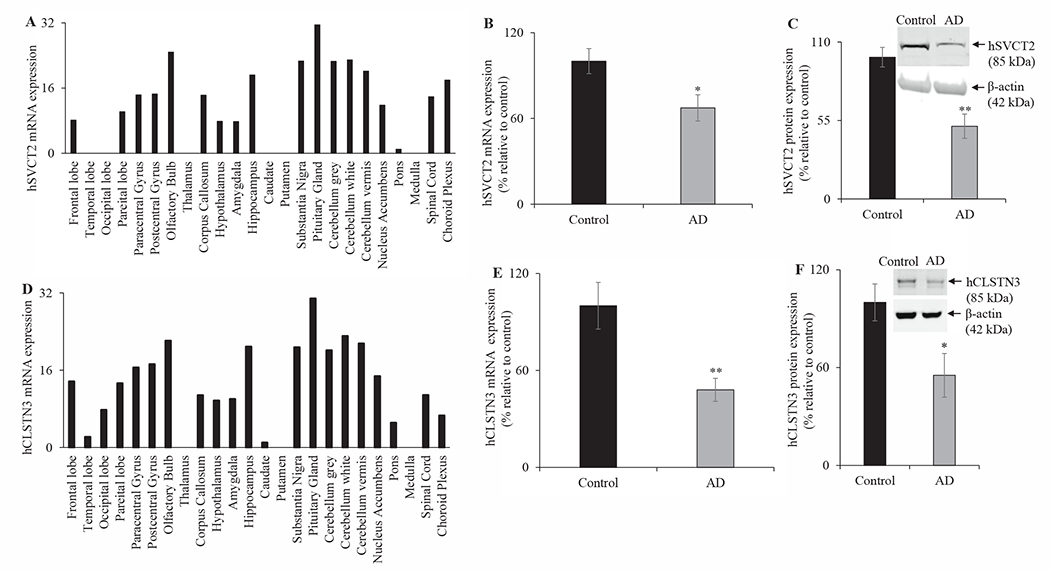
Ascorbic acid (AA) uptake in neurons occurs via a Na+-dependent carrier-mediated process mediated by the sodium-dependent vitamin C transporter-2 (SVCT2). Relatively little information is available concerning the network of interacting proteins that support human (h)SVCT2 trafficking and cell surface expression in neuronal cells. Here we identified the synaptogenic adhesion protein, calsyntenin-3 (CLSTN3) as an hSVCT2 interacting protein from yeast two-hybrid (Y2H) screening of a human adult brain cDNA library. This interaction was confirmed by co-immunoprecipitation, mammalian two-hybrid (M2H), and co-localization in human cell lines. Co-expression of hCLSTN3 with hSVCT2 in SH-SY5Y cells led to a marked increase in AA uptake. Reciprocally, siRNA targeting hCLSTN3 inhibited AA uptake. In the J20 mouse model of Alzheimer's disease (AD), mouse (m)SVCT2 and mCLSTN3 expression levels in hippocampus were decreased. Similarly, expression levels of hSVCT2 and hCLSTN3 were markedly decreased in hippocampal samples from AD patients. These findings establish CLSTN3 as a novel hSVCT2 interactor in neuronal cells with potential pathophysiological significance.

Keywords: Alzheimer's disease; CLSTN3; Interactor; SVCT2; Transport; Vitamin C.


Conflict of interest statement

Declaration of competing interest

The authors declare that there are no competing interests associated with the manuscript.

Figures

Fig. 1.
Fig. 1.
Interaction of hSVCT2 and hCLSTN3. (A) Schematic depiction of the coding regions of hSVCT2 and hCLSTN3 with carboxyl domain of hSVCT2 used for Y2H analysis boxed. (B) Images of ‘1-by-1’ Y2H interactivity growth assay on -histidine petri dishes. I: selective medium without tryptophan and leucine; II: selective medium without tryptophan, leucine and histidine. 1. Interaction positive control (SMAD and SMURF), 2. Negative control (empty bait plasmid and hCLSTN3 prey), 3. Negative control (hSVCT2 + empty prey plasmid) and 4. Interaction (hSVCT2 and hCLSTN3).
Fig. 2.
Fig. 2.
Conformational aspects of hCLSTN3 interaction with hSVCT2. (A) HEK-293 cells transiently expressing hSVCT2-YFP and hCLSTN3-HA were lysed and subsequently used for immunoprecipitation with anti-hSVCT2 and anti-HA antibodies as described in the “Methods”. Western blotting with the anti-hSVCT2 and anti-HA antibodies was then used to analyze immunoprecipitates separated on Any kD Criterion TGX gels. Control (ctrl), immunocomplex obtained from isotyped control IgG immunoprecipitated lysates. (B) Plasmids (pBIND-hSVCT2 and pACT-hCLSTN3) were co-transfected into SH-SY5Y cells in the presence of pG5luc vector. The dual luciferase assay system was able to quantify the Renilla-normalized firefly luciferase activity in transfected SH-SY5Y cells after 48 h. Values are the mean ± SEM of at least 5 different experiments and firefly luciferase activity was presented in folds over the vectors set at 1. **P < 0.01. (C) HEK-293 cells co-expressing hSVCT2-YFP and hCLSTN3-mCherry constructs following transient transfection. Live cell imaging was then done following 48 h of post-transfection. Fluorescence of YFP (left), mCherry (middle) and an overlay of images (right) are shown for cells expressing both constructs.
Fig. 3.
Fig. 3.
Functional effects of the hSVCT2 and hCLSTN3 protein-protein interaction. (A) SH-SY5Y cells were transiently transfected with hSVCT2-YFP alone or co-transfected with hSVCT2-YFP and hCLSTN3-HA and 14C-AA uptake (0.1 μCi; pH 7.4; 30 min) was performed after 48 h of transfection. (B) The hCLSTN3 gene specific siRNA or control siRNA (scrambled) transfected SH-SY5Y cells were utilized for 14C-AA uptake assay after 48 h of siRNA transfection. (C & D) RT-qPCR was done using hCLSTN3 as well as hSVCT2 gene-specific primers and cDNA reverse transcribed from RNA that was prepared from SH-SY5Y cells transfected with either the hCLSTN3 specific siRNA or the control siRNA (scrambled). Values are mean ± SEM of at least 3–5 independent uptake analyses with multiple batches of cells. ***P < 0.001; **P < 0.01; *P < 0.05; @significant compared to hSVCT2.
Fig. 4.
Fig. 4.
Effect of AD on the levels of expression of mSVCT2 and mCLSTN3 protein and mRNA in J20 and WT littermate mice hippocampus samples. cDNA from J20 and WT mice hippocampus were used for RT-qPCR analysis to determine the mRNA expression of mSVCT2 (A) and mCLSTN3 (C) relative to (β-actin. 40 μg of protein lysate from J20 and WT littermate mice hippocampus was used for Western blot to quantify the mSVCT2 (B) and mCLSTN3 (D) protein expression. Values are mean ± SEM of at least 5–7 sets of samples. ***P < 0.001; *P < 0.05.
Fig. 5.
Fig. 5.
Effect of AD on expression level of hSVCT2 and hCLSTN3 protein and mRNA in human normal and AD hippocampus samples. cDNA from 24 different regions of the normal human brain were obtained from a commercial source (“Materials and methods”) and RT-qPCR was performed to quantify the mRNA expression of hSVCT2 (A) and hCLSTN3 (D) relative to β-actin. cDNA from human normal and AD patient samples were analyzed by RT-qPCR to quantify the mRNA expression of hSVCT2 (B) and hCLSTN3 (E) relative to β-actin. Protein isolated from human normal and AD patients hippocampus was used for Western blot to determine the hSVCT2 (C) and hCLSTN3 (F) protein expression levels. Values are mean ± SEM of at least 4–10 sets of samples. **P < 0.01, *P < 0.05.

Similar articles

Cited by

References

    1. Carr AC, Frei B, Toward a new recommended dietary allowance for vitamin C based on antioxidant and health effects in humans, Am. J. Clin. Nutr 69 (1999) 1086–1107, 10.1093/ajcn/69.6.1086. - DOI - PubMed
    1. Packer L, Fuchs J, Marcel Dekker Inc, New York, NY, USA, 1997.
    1. Monacelli F, Acquarone E, Giannotti C, Borghi R, Nencioni A, Vitamin C, aging and Alzheimer’s disease, Nutrients 9 (2017), 10.3390/nu9070670. - DOI - PMC - PubMed
    1. Harrison FE, A critical review of vitamin C for the prevention of age-related cognitive decline and Alzheimer’s disease, J. Alzheimers Dis 29 (2012) 711–726, 10.3233/jad-2012-111853. - DOI - PMC - PubMed
    1. Dixit S, Bernardo A, Walker JM, Kennard JA, Kim GY, Kessler ES, Harrison FE, Vitamin C deficiency in the brain impairs cognition, increases amyloid accumulation and deposition, and oxidative stress in APP/PSEN1 and normally aging mice, ACS Chem. Neurosci. 6 (2015) 570–581, 10.1021/cn500308h. - DOI - PMC - PubMed