. 2021 Dec:145:1-12.
doi: 10.1016/j.cortex.2021.09.007. Epub 2021 Oct 2.

Reclassifying stroke lesion anatomy

Affiliations

Reclassifying stroke lesion anatomy

Anna K Bonkhoff et al. Cortex. 2021 Dec.

Abstract

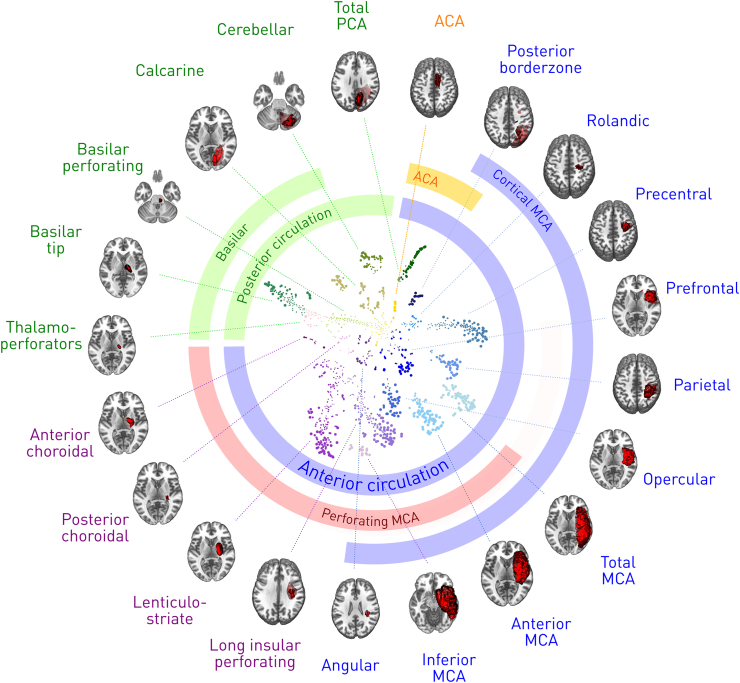
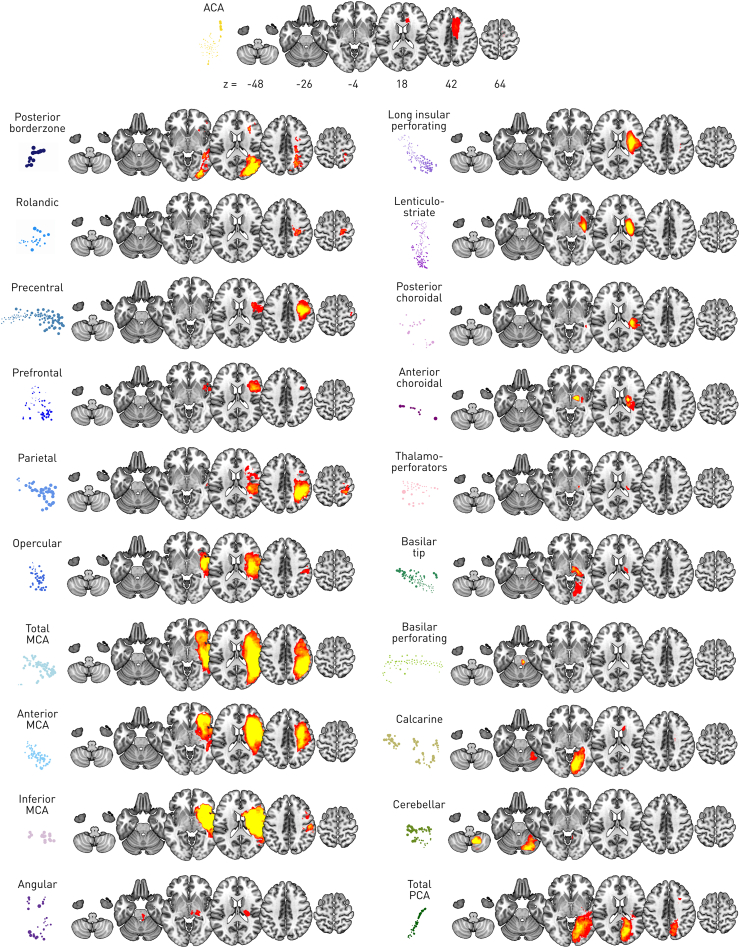
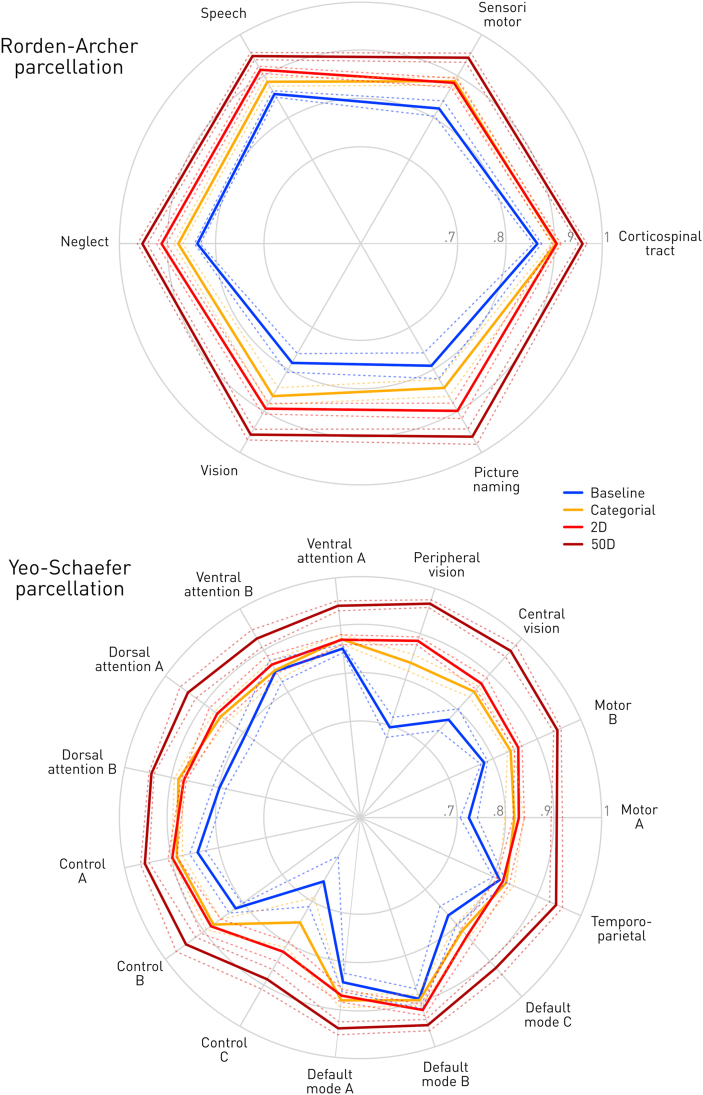
Cognitive and behavioural outcomes in stroke reflect the interaction between two complex anatomically-distributed patterns: the functional organization of the brain and the structural distribution of ischaemic injury. Conventional outcome models-for individual prediction or population-level inference-commonly ignore this complexity, discarding anatomical variation beyond simple characteristics such as lesion volume. This sets a hard limit on the maximum fidelity such models can achieve. High-dimensional methods can overcome this problem, but only at prohibitively large data scales. Drawing on one of the largest published collections of anatomically-registered imaging of acute stroke-N = 1333-here we use non-linear dimensionality reduction to derive a succinct latent representation of the anatomical patterns of ischaemic injury, agglomerated into 21 distinct intuitive categories. We compare the maximal predictive performance it enables against both simpler low-dimensional and more complex high-dimensional representations, employing multiple empirically-informed ground truth models of distributed structure-outcome relationships. We show our representation sets a substantially higher ceiling on predictive fidelity than conventional low-dimensional approaches, but lower than that achievable within a high-dimensional framework. Where descriptive simplicity is a necessity, such as within clinical care or research trials of modest size, the representation we propose arguably offers a favourable compromise of compactness and fidelity.

Keywords: Brain imaging; Dimensionality reduction; Lesion anatomy; Lesion–deficit prediction; Stroke.


Conflict of interest statement

Declaration of competing interest None.

Figures

Fig. 1
Fig. 1
The causal triad of stroke lesion anatomy. The spatial features of acutely presenting stroke lesions are generally determined by the interaction of three factors: the vascular topology (blue), the occlusive mechanism (green), and the symptomatic eloquence of the damaged brain (red). Incidental lesions (cyan) are free of the last constraint. Niche cases are global hypoperfusion (magenta) that need not involve focal occlusion or stenosis but will be shaped by vascular topology, and cardiogenic embolic “showers” (yellow) too small to be materially influenced by the structure of the vascular tree.
Fig. 2
Fig. 2
Two-dimensional representation and clustering of focal ischaemic lesions. Displayed as a scatter-plot in Cartesian latent dimensions (axes not shown) are the two-dimensional representations of each of the 1333 lesions, with point size proportional to lesion volume. Lesions with similar anatomical features are rendered proximal in this latent space in proportion to their similarity, yielding a set of natural clusters formalised with Ward hierarchical clustering into 21 distinct categories (coloured the same) plausibly related to the underlying vascular tree (coloured rings). Volumetric representations of the average lesion of each cluster—effectively the centroid—are shown in the periphery, centred on the most informative slice. Each category of cluster is given an identifying name for classification purposes. Note all data is collapsed onto one hemisphere for simplicity.
Fig. 3
Fig. 3
Detailed anatomy of the categorial lesion representation. The archetypal centroid of each cluster from the two-dimensional embedding (displayed on the left of each column row) is displayed overlaid on an illustrative normal brain image in Montreal Neurological Institute stereotactic space at the z axis locations given in the first row.
Fig. 4
Fig. 4
Quantification of simulated behavioural outcome predictive performance. For each of four incrementally enriched representations—baseline age and lesion volume (blue), cluster membership (orange), two-dimensional representation coordinates (red), and 50-dimensional NMF representations coordinates (claret)—achieved balanced accuracy is depicted as a spider-plot across individual areas within the Rorden-Archer parcellation (top), and the Yeo-Schaefer parcellation (bottom). Dotted lines identify 95% confidence intervals from the cross-validation procedure. The origin of the spider indicates prediction at chance level (50%); outer circles indicate 70%, 80% and 90% accuracy. Note that predictive accuracy generally increases with dimensionality but that the categorial representation performs substantially better than age and lesion volume alone.

References

    1. Abdelmoula W.M., Balluff B., Englert S., Dijkstra J., Reinders M.J.T., Walch A., et al. Data-driven identification of prognostic tumor subpopulations using spatially mapped t-SNE of mass spectrometry imaging data. Proceedings of the National Academy of Sciences. 2016;113(43):12244–12249. doi: 10.1073/pnas.1510227113. - DOI - PMC - PubMed
    1. Adams H.P., Jr., Bendixen B.H., Kappelle L.J., Biller J., Love B.B., Gordon D.L., et al. Classification of subtype of acute ischemic stroke. Definitions for use in a multicenter clinical trial. TOAST. Trial of Org 10172 in Acute Stroke Treatment. Stroke; a Journal of Cerebral Circulation. 1993;24(1):35–41. - PubMed
    1. Adolphs R. Human lesion studies in the 21st Century. Neuron. 2016;90(6):1151–1153. doi: 10.1016/j.neuron.2016.05.014. - DOI - PMC - PubMed
    1. Amarenco P., Bogousslavsky J., Caplan L.R., Donnan G.A., Hennerici M.G. New approach to stroke Subtyping: The A-S-C-O (phenotypic) classification of stroke. Cerebrovascular Diseases. 2009;27(5):502–508. doi: 10.1159/000210433. - DOI - PubMed
    1. Amir E.D., Davis K.L., Tadmor M.D., Simonds E.F., Levine J.H., Bendall S.C., et al. ViSNE enables visualization of high dimensional single-cell data and reveals phenotypic heterogeneity of leukemia. Nature Biotechnology. 2013;31(6):545–552. doi: 10.1038/nbt.2594. - DOI - PMC - PubMed

Publication types