. 2021 Dec 1;131(23):e141051.
doi: 10.1172/JCI141051.

T cell receptor-targeted immunotherapeutics drive selective in vivo HIV- and CMV-specific T cell expansion in humanized mice

Affiliations

T cell receptor-targeted immunotherapeutics drive selective in vivo HIV- and CMV-specific T cell expansion in humanized mice

Mengyan Li et al. J Clin Invest. .

Abstract

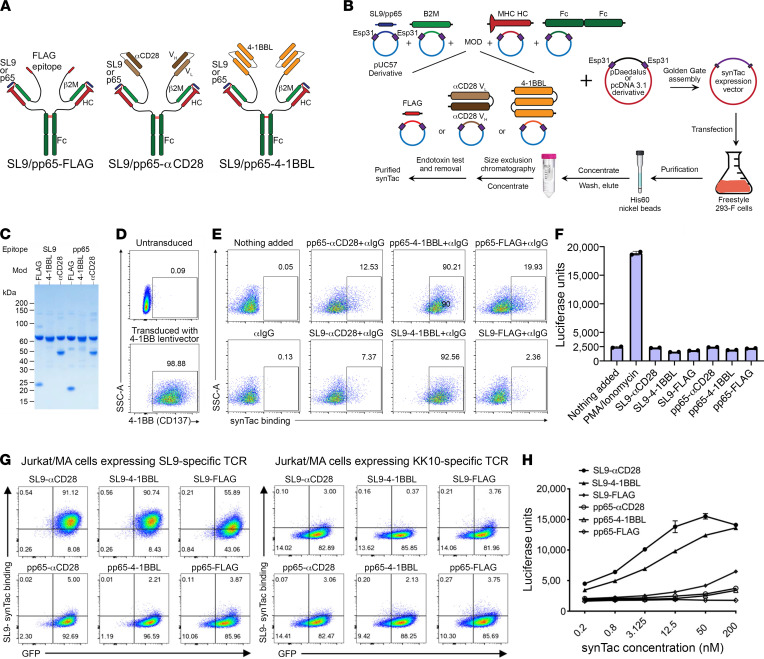
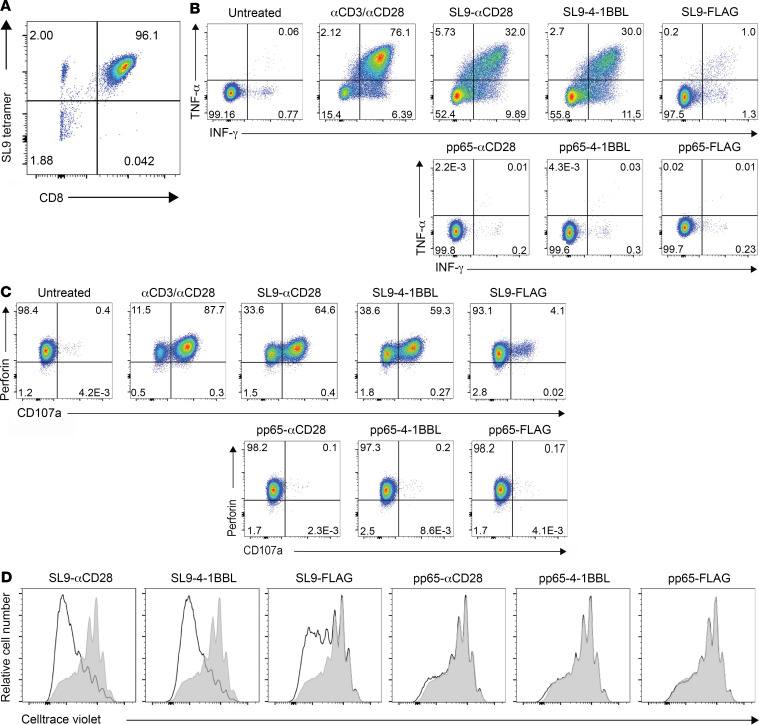
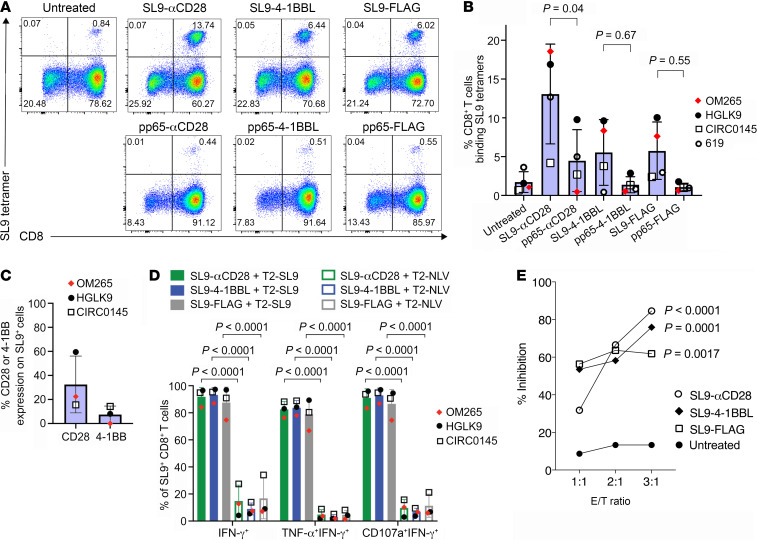
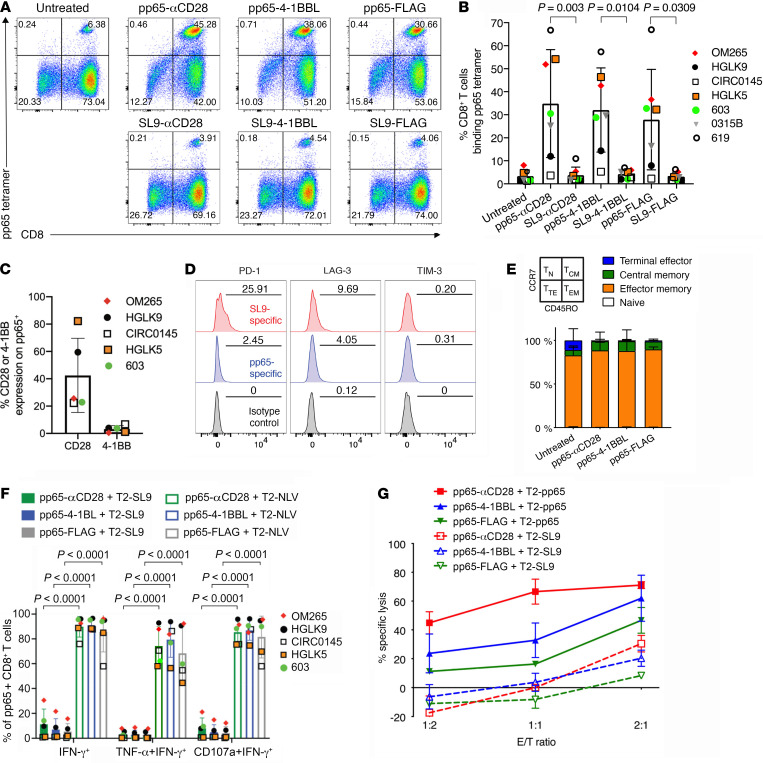
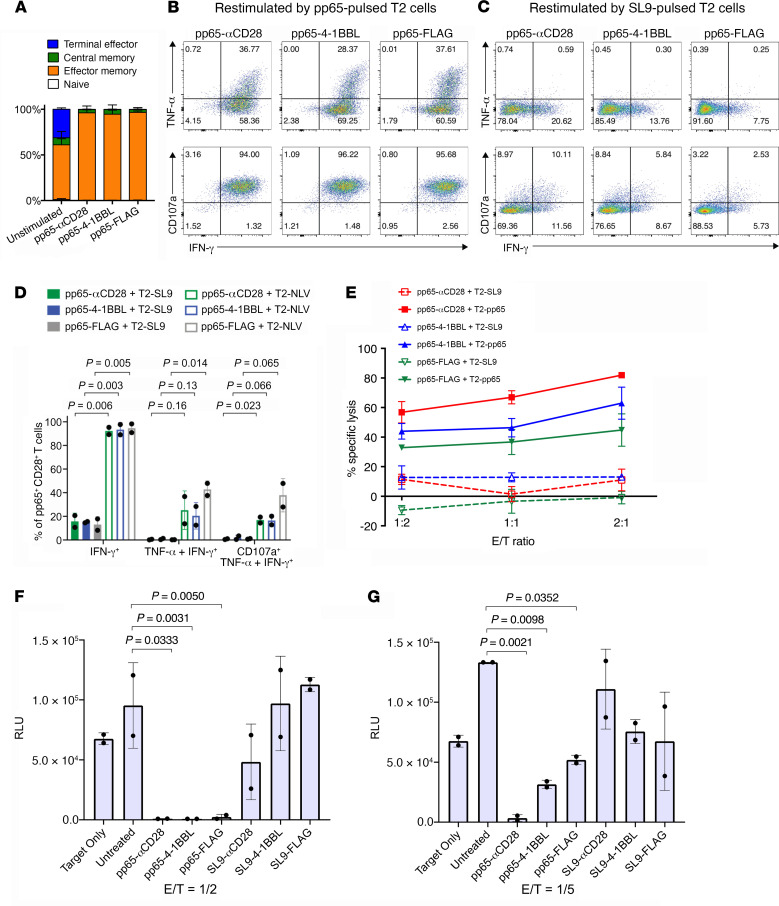
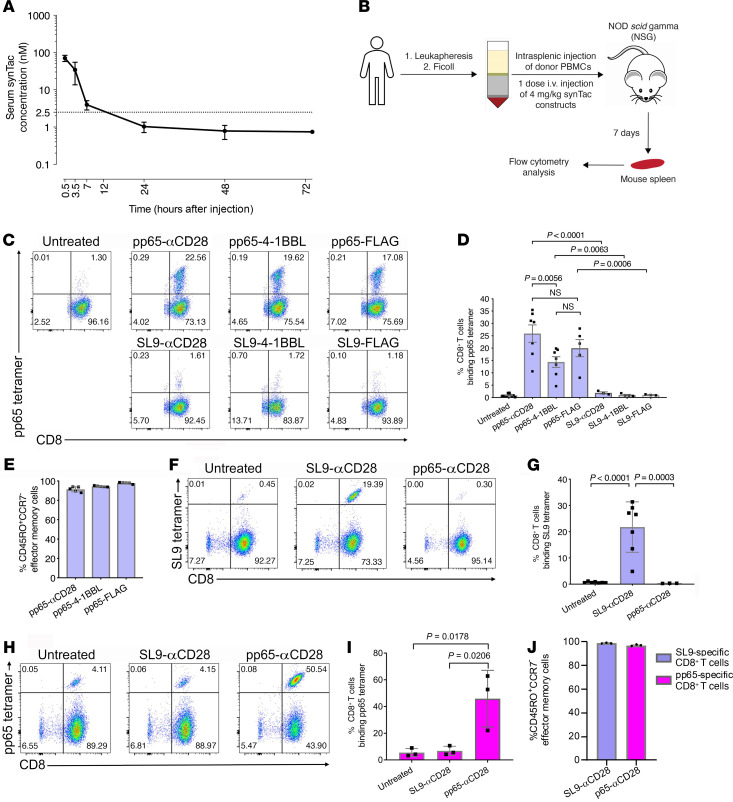
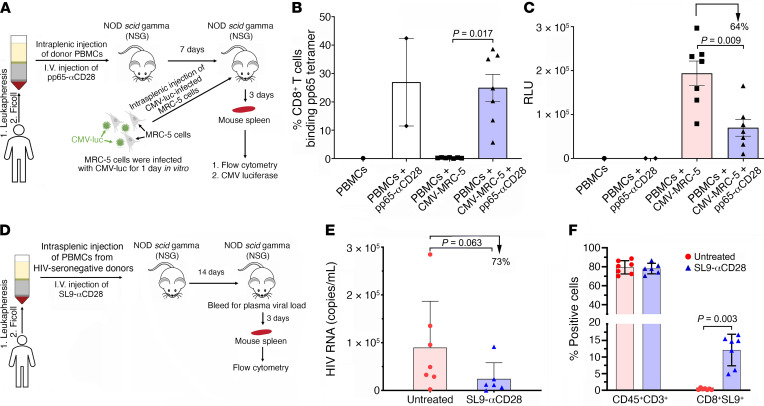
To delineate the in vivo role of different costimulatory signals in activating and expanding highly functional virus-specific cytotoxic CD8+ T cells, we designed synTacs, infusible biologics that recapitulate antigen-specific T cell activation signals delivered by antigen-presenting cells. We constructed synTacs consisting of dimeric Fc-domain scaffolds linking CD28- or 4-1BB-specific ligands to HLA-A2 MHC molecules covalently tethered to HIV- or CMV-derived peptides. Treatment of HIV-infected donor PBMCs with synTacs bearing HIV- or CMV-derived peptides induced vigorous and selective ex vivo expansion of highly functional HIV- and/or CMV-specific CD8+ T cells, respectively, with potent antiviral activities. Intravenous injection of HIV- or CMV-specific synTacs into immunodeficient mice intrasplenically engrafted with donor PBMCs markedly and selectively expanded HIV-specific (32-fold) or CMV-specific (46-fold) human CD8+ T cells populating their spleens. Notably, these expanded HIV- or CMV-specific CD8+ T cells directed potent in vivo suppression of HIV or CMV infections in the humanized mice, providing strong rationale for consideration of synTac-based approaches as a therapeutic strategy to cure HIV and treat CMV and other viral infections. The synTac platform flexibility supports facile delineation of in vivo effects of different costimulatory signals on patient-derived virus-specific CD8+ T cells, enabling optimization of individualized therapies, including HIV cure strategies.

Keywords: AIDS/HIV; Costimulation; Immunology; T cells.


Conflict of interest statement

Conflict of interest: SCA, SJG, RDS, and RJC are coinventors of the SynTac technology, which was developed in the laboratory of SCA, described in a pending patent application, “SynTac Polypeptides and Uses Thereof” (US patent application 16/740,752), and licensed to Cue Biopharma. The use of synTacs for application in HIV is also patent pending with HG and SCA as coinventors and is described in “Precision Activation of HIV-Specific CTLs to Eliminate Reactivated Latent T Cells” (US patent application 16/603,306). SCA, RDS, and RJC are cofounders and stockholders of Cue Biopharma. RDS and RJC are employees of Cue Biopharma. SCA and HG received financial support from Cue Biopharma for previous research studies.

Figures

Figure 1
Figure 1. Structural representation of synTac proteins and their production and functional activity.
(A) SynTacs were constructed as a split sc-pMHC-Fc fusion, with the β2M and the MHC HLA-A*0201 alpha chain linked through engineered interchain disulfide bonds, and the FLAG, αCD28, or 4-1-BBL domains linked to the β2M carboxy end. (B) Outline of protocol for production of SL9- or pp65-FLAG, -αCD28, and -4-1BBL synTacs. (C) SDS-PAGE gel showing the molecular weights of the reduced synTacs. (D) 4-1BB expression on Jurkat/MA cells that were transduced with a 4-1BB–encoding lentiviral vector. (E) Quantification of synTac (1 nM) bound to 4-1BB–expressing Jurkat/MA cells. (F) 4-1BB–expressing Jurkat/MA cells that express an NFAT-driven luciferase reporter were incubated with synTac constructs (100 nM) or stimulated with PMA/ionomycin. After overnight incubation, luciferase activity was measured. (G) Jurkat/MA cells were transduced with a lentivector encoding a TCR specific for either SL9 (left) or KK10 (right), incubated with the indicated synTac molecules (1.56 nM) for 30 minutes, and bound synTac molecules were detected by flow cytometry. (H) Luciferase activity was quantified after overnight incubation of SL9-TCR–transduced Jurkat/MA cells with synTac molecules (0.2 nM to 200 nM).
Figure 2
Figure 2. synTac stimulation of an SL9-specific CD8+ T cell clone.
(A) SL9 tetramer staining of the SL9-specific CTL clone. (B and C) The SL9-specific CTL clone was untreated or treated overnight with anti-CD3/anti-CD28 or the indicated synTacs (100 nM) and analyzed for intracellular expression of (B) IFN-γ and TNF-α and (C) the degranulation marker CD107a and perforin. (D) The SL9-specific CTL clone was stained with Cell Trace Violet (0.25 μM), treated with the indicated synTac (100 nM), cultured for 6 days in complete RPMI with added IL-2 (50 U/mL), and cellular proliferation was determined by flow cytometric analysis of cellular dye dilution.
Figure 3
Figure 3. SL9-synTac treatment stimulated in vitro expansion of functional SL9-specific CD8+ T cells from HLA-A*0201 HIV-infected donors.
(A) HIV-seropositive donor (donor OM265) PBMCs treated with the indicated synTacs (0.1 nM) were cultured for 12 days in complete RPMI media with IL-2 (100 U/mL) and Raltegravir (1 μM), and analyzed by flow cytometry. (B) Summary data from 4 different HIV-infected donors (individual donors denoted as OM265, HGLK9, CIRC0145, and 619) treated with the indicated pp65- or SL9-synTacs. Data represent mean ± SD, analyzed using a 1-way ANOVA, followed by Tukey’s multiple comparisons test. (C) Baseline level of CD28 or 4-1BBL expression by SL9-specific CD8+ T cells from the 3 HIV-infected donors shown in B. (D) Quantification of SL9-αCD28, 4-1BBL, or FLAG synTac-expanded cells expressing IFN-γ, both TNF-α and IFN-γ, or both CD107a and IFN-γ by flow cytometry after stimulation overnight with T2 cells loaded with SL9 or CMV-pp65 peptides in complete IMDM with IL-2 (100 U/mL). (E) SL9-specific CD8+ T cells from HIV-seropositive donor 619 expanded by treatment of PBMCs with SL9-αCD28, SL9-4-1BBL, or SL9-FLAG synTac were added to IMC-Bal super-infected autologous PBMCs at E/T ratios of 1:1, 2:1, and 3:1, respectively. Three days later, LucR levels were quantified. An experiment representative of 2 independent experiments is shown. Statistical significance of infection inhibition was determined by percentage of reduction of IMC-Bal–infected PBMC LucR levels in cultures with added untreated cells as compared with synTac-treated cells at an E/T ratio of 3:1 using 2-way ANOVA followed by Sidak’s multiple comparison’s test.
Figure 4
Figure 4. pp65 synTac stimulates in vitro expansion of functional pp65-specific CD8+ T cells from HLA-A*0201 HIV-infected donors.
(A) PBMCs from HIV-seropositive donor OM265 were treated with the indicated synTacs (0.1 nM), cultured for 12 days in complete IMDM with IL-2 (100 U/mL) and Raltegravir (1 μM) and analyzed by flow cytometry. (B) Summary data from 7 different donors (OM265, HGLK9, CIRC0145, HGLK5, 603, 0315B, and 619) of pp65-specific CD8+ T cells after treatment with indicated synTacs are shown as mean ± SD with statistical analysis performed using ordinary 1-way ANOVA followed by Tukey’s multiple comparisons test. (C) Baseline level of CD28 or 4-1BBL expression from pp65-specific CD8+ T cells of 5 HIV-infected donors shown in B. (D) PD-1 (left), LAG-3 (middle), and TIM-3 (right) expression on SL9-specific (red shade) or pp65-specific (blue shaded) CD8+ T cells from HIV-seropositive donor 619. The numbers in each panel indicate the percentage positive for each marker compared with the isotype control (gray shaded). (E) Frequency of TN (naive, CD45ROCCR7+), TCM (central memory, CD45RO+CCR7+), TTE (terminal effector, CD45ROCCR7), and TEM (effector memory, CD45RO+CCR7) from pp65-specific CD8+ T cells expanded by pp65-synTac treatment of seropositive donor OM265 PBMCs. Data represent the mean ± SD of 2 independent experiments of this donor. (F) Intracellular cytokine expression of pp65-specific CD8+ T cells from 5 different donors expanded by treatment with the indicated synTac that expresses IFN-γ, TNF-α and IFN-γ, or CD107a and IFN-γ after stimulation with pp65- or SL9-peptide–pulsed T2 cells. (G) Cytolytic activity of synTac-expanded pp65-specific CD8+ T cells from HIV-seropositive donor HGLK5 directed at pp65- or SL9-peptide–pulsed T2 cells determined using EuTDA cytotoxicity assay cocultured at the indicated E/T ratios. Data shown represent mean ± SD of 3 experimental replicates and 2 independent experiments.
Figure 5
Figure 5. pp65 synTac treatment potently stimulates in vitro expansion of functional pp65-specific CD8+ T cells in an HIV-seronegative donor.
(A) HGLK055 PBMCs were treated with the indicated synTac (2.5 nM), cultured for 12 days in complete RPMI media with IL-2 (100 U/mL), and analyzed by flow cytometry. (B) Results from 4 independent experiments as described in A showing percentage of pp65-specific CD8+ T cells 12 days after PBMCs from donor HGLK055 were treated with synTacs; mean ± SD are shown and statistical significance was assessed by ordinary 1-way ANOVA followed by Tukey’s multiple comparisons test. (C) The percentage of pp65-specific CD8+ T cells 12 days after treatment of HGLK055 PBMCs with the indicated synTac doses and cultured in complete IMDM with IL-2 (100 U/mL). Data shown are representative of 2 independent experiments. (D) HGLK055 PBMCs were treated with the indicated synTacs (2.5 nM) and percentage of pp65-specific CD8+ T cells was determined after 7 and 12 days after culture in complete media with IL-2 (100 U/mL). Data shown represent mean ± SD of 3 independent experiments. (EH) After 4 days and 7 days of culture as described in D, cell culture supernatant was analyzed using the MILLIPLEX Multiplex assay to quantify concentrations of (E) IFN-γ, (F) granzyme B, (G) MIP-1β, and (H) perforin. Data represent mean ± SD of replicate samples and were analyzed using a 2-way ANOVA, followed by Tukey’s multiple comparisons test.
Figure 6
Figure 6. pp65-synTac expanded pp65-specific CD8+ T cells from a HIV-seronegative donor are polyfunctional and potently inhibit CMV infection.
(A) Frequency of pp65-specific cells that are TN, TCM, TTE, and TEM. Data represent 2 independent experiments showing mean ± SD. (B and C) Intracellular cytokine staining of IFN-γ and TNF-α (upper panels) or CD107a and IFN-γ (lower panels), in pp65-specific CD8+ T cells expanded by treatment with the indicated synTac after overnight stimulation with (B) pp65- or (C) SL9-pulsed T2 cells. Dot plots shown were gated from the pp65-tetramer+ population and are representative of 2 independent experiments. (D) Quantification of cells that express IFN-γ, TNF-α and IFN-γ, TNF-α, and IFN-γ and CD107a combined from 2 independent experiments showing mean ± SD and statistically analyzed using ordinary 1-way ANOVA followed by Tukey’s multiple comparisons test. (E) Twelve days after treatment with the indicated synTac, cytolytic activity directed at pp65- or SL9-peptide–pulsed T2 cells was evaluated after 4-hour culture at the indicated E/T ratios using an EuTDA cytotoxicity assay. Data shown represent mean ± SD of 3 experimental replicates and are representative of 2 independent experiments. (F and G) PBMCs treated with the indicated synTac (0.1 nM) for 7 days were cocultured with HLA-A*0201–expressing human fibroblasts infected with a recombinant CMV-luc (MOI = 3) at E/T ratios of (F) 1:2 and (G) 1:5. After 3 days, luciferase activity was measured. Results from an experiment representative of 2 independent experiments are shown and statistical analysis was performed using Tukey’s multiple comparisons test.
Figure 7
Figure 7. In vivo pp65- or SL9-synTac treatment stimulates expansion of pp65- and SL9-specific CD8+ T cells from HIV-seronegative and -seropositive donors in a humanized mouse model.
(A) pp65-4-1BBL-synTac serum levels at indicated time points after intravenous injection (n = 5 mice) measured by ELISA and presented as mean ± SD. (B) Experimental design. (C) NSG mice intrasplenically injected with HGLK055 PBMCs were untreated or intravenously injected with the indicated synTacs (4 mg/kg) and after 1 week, the spleens were analyzed by flow cytometry and gated for viability and expression of human CD45 and CD8. (D) pp65-specific CD8+ T cells in the spleens of mice that were untreated (n = 8) or treated with pp65-αCD28-synTac (n = 7), pp65-4-1BBL-synTac (n = 7), pp65-FLAG- synTac (n = 5), SL9-αCD28 synTac (n = 3), SL9-4-1BBL synTac (n = 3), or SL9-FLAG synTac (n = 3). Shown are pooled data from more than 3 independent experiments statistically analyzed using 1-way ANOVA followed by Tukey’s multiple comparisons test. (E) Fraction of pp65-specific CD8+ T cells in the spleens of humanized mice treated with the indicated synTac shown in C, which were effector memory (CD45RO+CCR7) cells. (FJ) NSG mice were intrasplenically injected with PBMCs from HIV-seropositive donor 619 and untreated or intravenously injected with SL9-αCD28-synTac or pp65-αCD28-synTac. One week later, spleens were analyzed by flow cytometry. Dot plots represent SL9 (F) or pp65 (H) tetramer staining from a representative mouse from each group. (G) Summary of the percentage of SL9-specific CD8+ T cells in the spleens of mice that were untreated (n = 7) or treated with SL9-αCD28 synTac (n = 7) or pp65-αCD28-synTac (n = 3). (I) Summary of the percentage of pp65-specific CD8+ T cells in the spleens of mice that were untreated or treated with SL9-αCD28-synTac or pp65-αCD28-synTac (n = 3/group). Statistical significance was determined by ordinary 1-way ANOVA followed by Tukey’s multiple comparisons test. (J) Percentage of SL9-specific CD8+ T cells or pp65-specific CD8+ T cells, which were effector memory (CD45RO+CCR7) cells in the spleens of mice treated with SL9-αCD28-synTac (n = 3 mice) or pp65-αCD28-synTac (n = 3 mice), respectively shown in G and I.
Figure 8
Figure 8. In vivo treatment with synTac expands pp65- and SL9-specific CD8+ T cells and inhibits in vivo CMV and HIV infection.
(A) NSG mice (n = 17 mice) intrasplenically injected with HGLK055 PBMCs were untreated (n = 8 mice) or intravenously injected with pp65-αCD28-synTac (4 mg/kg, n = 9 mice). One week later, CMV-luc–infected MRC-5 cells were intrasplenically injected into the indicated mice. On day 10, the mouse spleens were harvested to quantify (B) pp65-specific CD8+ T cells by flow cytometry and (C) CMV infection by luciferase quantification. Dot plots in B and C show percentage of pp65-specific CD8+ T cells and CMV luciferase levels in the mouse spleens and mean ± SEM, respectively, with percentage of suppression versus untreated mice shown. (D) NSG mice (n = 13 mice) intrasplenically injected with PBMCs (32 × 106) from HIV-seropositive donor 619 and CD8+ T cell–depleted PBMCs (14 × 106) from donor HGLK67 were untreated (n = 7 mice) or intravenously treated with SL9-αCD28-synTac at 0.4 mg/kg (n = 6 mice). The mice received no ART. Two weeks later the mice were bled and 3 days later the mouse spleens were harvested. (E) HIV viral loads in the plasma were quantified and values for each mouse are shown with mean ± SEM for the untreated and SL9-αCD28-synTac–treated mice and percentage of reduction of the plasma HIV viral loads in the SL9-αCD28-synTac–treated mice as compared with the untreated mice. (F) The percentage of human CD45+CD3+ and CD8+ SL9-specific T cells in the spleens of each mouse are shown with mean ± SEM for the untreated and SL9-αCD28-synTac–treated mice. Statistical significance was determined by the Wilcoxon Mann-Whitney U test.

Similar articles

Cited by

References

    1. Wykes MN, Lewin SR. Immune checkpoint blockade in infectious diseases. Nat Rev Immunol. 2018;18(2):91–104. doi: 10.1038/nri.2017.112. - DOI - PMC - PubMed
    1. Chen L, Flies DB. Molecular mechanisms of T cell co-stimulation and co-inhibition. Nat Rev Immunol. 2013;13(4):227–242. doi: 10.1038/nri3405. - DOI - PMC - PubMed
    1. Watts TH. TNF/TNFR family members in costimulation of T cell responses. Annu Rev Immunol. 2005;23:23–68. doi: 10.1146/annurev.immunol.23.021704.115839. - DOI - PubMed
    1. Mescher MF, et al. Signals required for programming effector and memory development by CD8+ T cells. Immunol Rev. 2006;211:81–92. doi: 10.1111/j.0105-2896.2006.00382.x. - DOI - PubMed
    1. Curtsinger JM, Mescher MF. Inflammatory cytokines as a third signal for T cell activation. Curr Opin Immunol. 2010;22(3):333–340. doi: 10.1016/j.coi.2010.02.013. - DOI - PMC - PubMed

Publication types

MeSH terms