. 2021 Dec 8;6(23):e150735.
doi: 10.1172/jci.insight.150735.

VEGFR2 activity on myeloid cells mediates immune suppression in the tumor microenvironment

Affiliations

VEGFR2 activity on myeloid cells mediates immune suppression in the tumor microenvironment

Yuqing Zhang et al. JCI Insight. .

Abstract

Angiogenesis, a hallmark of cancer, is induced by vascular endothelial growth factor-A (hereafter VEGF). As a result, anti-VEGF therapy is commonly used for cancer treatment. Recent studies have found that VEGF expression is also associated with immune suppression in patients with cancer. This connection has been investigated in preclinical and clinical studies by evaluating the therapeutic effect of combining antiangiogenic reagents with immune therapy. However, the mechanisms of how anti-VEGF strategies enhance immune therapy are not fully understood. We and others have shown selective elevation of VEGFR2 expression on tumor-associated myeloid cells in tumor-bearing animals. Here, we investigated the function of VEGFR2+ myeloid cells in regulating tumor immunity and found VEGF induced an immunosuppressive phenotype in VEGFR2+ myeloid cells, including directly upregulating the expression of programmed cell death 1 ligand 1. Moreover, we found that VEGF blockade inhibited the immunosuppressive phenotype of VEGFR2+ myeloid cells, increased T cell activation, and enhanced the efficacy of immune checkpoint blockade. This study highlights the function of VEGFR2 on myeloid cells and provides mechanistic insight on how VEGF inhibition potentiates immune checkpoint blockade.

Keywords: Cancer immunotherapy; Immunology; Macrophages; Oncology.


Conflict of interest statement

Conflict of interest: RAB received research support from OncXerna to support these studies.

Figures

Figure 1
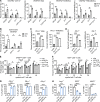
Figure 1. Selective inhibition of VEGF activation of VEGFR2 by mcr84 delays tumor progression and reduces the vascular immune barrier in syngeneic models.
(AC) In vivo assessment of tumor growth in response to mcr84 treatment in orthotopically or subcutaneously implanted tumors. (A) A total of 1 × 10⁵ 4T1 cells (n = 9–10/group) were injected orthotopically into 8-week-old BALB/c mice. (B) A total of 1 × 10⁵ E0771 cells (n = 9–10/group) were injected orthotopically into 8-week-old C57BL/6 mice. (C) A total of 1 × 10⁵ MC38 cells were injected subcutaneously into 8-week-old C57BL/6 mice (n = 8–9/group). Mice with established tumors (50–150 mm3) were treated with control antibody (C44, 250 μg/dose, twice per week) or mcr84 (250 μg/dose, twice per week). Mice were monitored daily and tumor volume was measured twice per week. All mice were sacrificed when tumor volume in the control group reached 2000 mm3. Data are displayed as mean ± SEM. **, P < 0.01 vs. control, by Welch’s t test. (D) Lung metastasis burden was evaluated in the 4T1 model. Formalin-fixed, paraffin-embedded (FFPE) lung tissues were sectioned serially at a 150 μm interval. H&E staining was performed to evaluate metastasis. Metastasis index was calculated by metastatic area/total lung area. Representative images of H&E staining are shown. Scale bar: 100 μm (left), 250 μm (right). (E) IHC of FFPE 4T1 tumors for CD31, CD31 and neural/glial antigen 2 (NG2), CD31 and vascular cell adhesion protein 1 (VCAM-1), CD31 and intercellular adhesion molecule 1 (ICAM-1), and CD31 and Fas ligand (FasL). Slides were scanned and images were analyzed using NIS Elements (Nikon) and Fiji software. Representative images are shown with CD31 in red and other markers in brown. Scale bar, 50 μm. Quantification is shown. Data are displayed as mean ± SEM (n = 5/group). *, P < 0.05; **, P < 0.005 vs. control, by Welch’s t test.
Figure 2
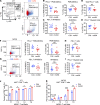
Figure 2. Expression of VEGFR2 on myeloid cells is elevated specifically in tumor-bearing animals and is associated with an immunosuppressive myeloid phenotype.
(A) BM-derived total myeloid cells, macrophages (MQs), and MDSCs from NTB animals; MC38, E0771, and 4T1 TB animals; and colony-stimulating factor 1 receptor–Cre+ Flk-1fl/fl (Csf1r-Cre+ Flk-1fl/fl) animals were analyzed for VEGFR2 expression by flow cytometry. (B) Gr-1+Ly-6G+ MDSCs were sorted from splenocytes of NTB mice, MC38, E0771 and 4T1 TB mice and VEGFR2 expression were evaluated by flow cytometry. Data are displayed as mean ± SEM with 3 independent experiments. *, P < 0.05; **, P < 0.005; ***, P < 0.001, by Welch’s t test. (C and D) BM-derived myeloid cells from NTB mice and Flk-1fl/fl and Csf1r-Cre+ Flk-1fl/fl mice bearing F246-6 breast tumors were analyzed by flow cytometry for PD-L1 and Arg-1 expression. Data are displayed as mean ± SEM with 3 independent experiments. *, P < 0.05; **, P < 0.005; ***, P < 0.001; ****, P < 0.0001 by ANOVA with Tukey’s multiple comparisons test (MCT). (E and F) BM-derived myeloid cells from NTB mice and MC38, Flk-1fl/fl, and Csf1r-Cre+ Flk-1fl/fl TB mice at day 6 were harvested and added to CD8+ T cells at different ratios. Percentages of proliferating CD8+ T cells after 72 hours were analyzed by CFSE signal (E) or intracellular Ki67 staining (F) with flow cytometry. Data are displayed as mean ± SEM with 3 independent experiments. *, P < 0.05; **, P < 0.005 by ANOVA with Tukey’s MCT. (G and H) KDR was overexpressed by lentiviral transduction in J774M cells, and clones (A6 and F6) were chosen. J774M-Ctrl and J774M-KDR (A6) as well as J774M-KDR (F6) cells were analyzed for PD-L1 and other myeloid cell markers as indicated by flow cytometry. Data are displayed as mean ± SEM with 3 independent experiments. ***, P < 0.001; ****, P < 0.0001 by ANOVA with Tukey’s MCT.
Figure 3
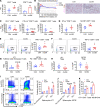
Figure 3. VEGF blockade by mcr84 decreases PD-L1 expression on myeloid cells.
(A) Flow cytometry gating strategy for PMN-MDSCs and M-MDSCs and representative flow cytometry analysis of PD-L1 expression on gated PMN-MDSCs and M-MDSCs. (BE) Flow cytometry analysis of the indicated cell types in 4T1 tumors treated as indicated. Each dot indicates 1 tumor. Expression of PD-L1 on PMN-MDSCs (B), M-MDSCs (C), and total CD11b+ myeloid cells (E) as well as total numbers of MDSCs (B and C) and PD-L1+ cells (D) were evaluated. (FI) Flow cytometry analysis of the indicated cell types in MC38 tumors. The left panels in (F) and (G) show representative flow cytometry analysis of PD-L1 expression on gated PMN-MDSCs and M-MDSCs. Data are displayed as mean ± SEM with n = 9 to 10 per group analyzed. *, P < 0.05; ***, P < 0.001 vs. control, by Welch’s t test. (J and K) Sorted tumor-infiltrating MDSCs from C44- or mcr84-treated 4T1 (J) or MC38 (K) TB mice were cocultured with CD8+ T cells isolated from splenocytes of wild-type C57BL/6 mice at ratios indicated. After 72 hours, Ki67 expression was evaluated by flow cytometry. Data are displayed as mean ± SEM with n = 2 to 3 per group analyzed. *, P < 0.05; **, P < 0.005; ***, P < 0.001, by Welch’s t test.
Figure 4
Figure 4. VEGF directly upregulates PD-L1 expression on myeloid cells through VEGFR2.
(A) Intratumor IFN-γ level was analyzed from whole tumor lysates with indicated treatments by ELISA. Data are displayed as mean ± SEM with n = 7/group analyzed. *, P < 0.05 vs. control, by Welch’s t test. (B and C) bEnd.3 endothelial cells were pretreated with VEGF with/without C44 or mcr84 for 24 hours. Conditioned media (CM) were harvested, and BM from C57BL/6 mice was differentiated into MDSCs as shown in the schematics (B). On day 7, PD-L1 expression on MDSCs was analyzed by flow cytometry as shown (C). Data are displayed as mean ± SD with 2 independent experiments. (D) Gr-1+Ly-6G+ MDSCs were sorted from splenocytes of NTB mice and E0771 TB mice. (E) Gr-1dimLy-6G M-MDSCs were sorted from splenocytes of Flk-1fl/fl and Csf1r-Cre+ Flk-1fl/fl TB mice. PD-L1 expression after VEGF (100 ng/mL) stimulation for 24 hours was evaluated by quantitative PCR. Three independent experiments using duplicate samples were performed. Data are displayed as fold change normalized to NTB mice or control (mean ± SEM). *, P < 0.05, by Welch’s t test. (F) CD11b+Ly-6G+ MDSCs were sorted from 4T1 and E0771 digested tumors (5–6 tumors pooled in each model) and were stimulated with VEGF (100 ng/mL or 200 ng/mL) for 48 hours. PD-L1 expression was analyzed by flow cytometry. Three to four independent experiments were performed (mean ± SEM). *, P < 0.05; **, P < 0.005, by Welch’s t test in 4T1 model or ANOVA with Tukey’s MCT in E0771 model. (GJ) F246-6 tumors grown in Flk-1fl/fl or Csf1r-Cre+ Flk-1fl/fl mice were analyzed by flow cytometry for PD-L1 expression on indicated myeloid cells. Data are displayed as mean ± SEM with n = 6–9/group analyzed. *, P < 0.05; **, P < 0.005; ***, P < 0.001; ****, P < 0.0001 by ANOVA with Tukey’s MCT.
Figure 5
Figure 5. VEGF blockade by mcr84 promotes perivascular accumulation of T cells and stimulates T cell activation.
(A) Flow cytometry analysis or IHC of the indicated cell types in 4T1 tumors. (B) Normalized distribution of CD8+ T cells around CD31+ blood vessels in 4T1 tumors (n = 5/group). Representative images of CD8 (brown) and CD31 (red) staining in 4T1 tumors are shown. Scale bar: 50 μm. (C and D) Flow cytometry analysis of PD-1, CTLA-4, EOMES, intracellular IFN-γ, and granzyme B on CD8+ T cells in 4T1 tumors treated as indicated. (E and F) Flow cytometry analysis of intracellular IFN-γ (E) and TNF-α (F) expression on CD8+ T cells in MC38 tumors treated as indicated. The left panels (E and F) show representative flow cytometry analysis of indicated cytokines in gated CD8+ T cells. (G and H) Flow cytometry analysis of T effector cells/exhausted T cells (G) and Tregs (H) in 4T1 and MC38 tumors treated as indicated. T effector cells were characterized as PD-1Ki67+CD8+ T cells. Exhausted T cells were characterized as CTLA-4+PD-1+CD8+ T cells. Tregs were characterized as CD25+FoxP3+CD4+ T cells. Each dot indicates 1 tumor. Data are displayed as mean ± SEM with 5 to 9 animals per group. (IK) An in vitro cell cytotoxicity assay was performed following the instructions of the basic cytotoxicity assay kit. Splenocytes from animals treated as indicated, or splenic CD8+ T cells from OT-1 MC38 TB mice were cocultured with CFSE prelabeled 4T1, MC38, or MC38-OVA cells at different ratios for 72 or 48 hours. Dead cells were labeled with 7-AAD. Samples were analyzed by flow cytometry. Representative images of gating strategy of 4T1 coculture are shown (I). Cytotoxicity percentages were calculated in (I) (4T1), (J) (MC38), and (K) (MC38-OVA). n = 2 to 3/group. *, P < 0.05; **, P < 0.005 vs. control, by Welch’s t test.
Figure 6
Figure 6. CTLA-4 blockade enhances the antitumor activity of mcr84.
(A) A total of 1 × 10⁵ 4T1 cells (n = 7–8/group) were injected orthotopically into 8-week-old BALB/c mice. Mice with established tumors (50–150 mm3) were treated with control antibody (C44, 250 μg/dose, twice per week), mcr84 (250 μg/dose, twice per week), anti–CTLA-4 antibody (clone: 9d9, 100 μg/dose, every 3 days) or mcr84 and anti–CTLA-4. Mice were monitored daily and tumor volume was measured twice per week. All mice were sacrificed when tumor volume in the control group reached 2000 mm3. Tumor growth was analyzed. Data are displayed with mean ± SEM. **, P < 0.005 vs. control C44, by Welch’s t test. (B) Growth curves of individual tumors. Arrows indicate start of treatments (day 7). Colors of labeling correspond to legends in A. (C) Combination efficacy of VEGF and PD-1 blockade in 4T1 syngeneic model. Experiment was performed similarly as described in A. Anti–PD-1 antibody (clone: RMP14-1, 100 μg/dose, i.p.) was dosed twice per week. Data are displayed with mean ± SEM. **, P < 0.005 vs. control C44, by ANOVA with Tukey’s MCT.
Figure 7
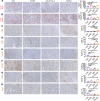
Figure 7. VEGF blockade in combination with anti–CTLA-4 therapy increases T cell infiltration and polarizes macrophages to an immunostimulatory phenotype.
FFPE 4T1 tumors were assessed for CD31 and NG2 (A); CD31 and ICAM-1 (B); T cell markers CD3 (C), CD8 (D), and FoxP3 (E); as well as macrophage markers F4/80 (F), iNOS (G), and Arg-1 (H). Slides were scanned and images were analyzed using NIS Elements (Nikon) and Fiji software. Representative images are shown with CD31 in red and other markers in brown. Scale bar, 50 μm. Quantification is shown to the right. Data are displayed as mean ± SEM (n = 4–6/group). *, P < 0.05; **, P < 0.005, by ANOVA with Tukey’s MCT.

References

    1. Carmeliet P, Jain RK. Molecular mechanisms and clinical applications of angiogenesis. Nature. 2011;473(7347):298–307. doi: 10.1038/nature10144. - DOI - PMC - PubMed
    1. Sullivan LA, et al. r84, a novel therapeutic antibody against mouse and human VEGF with potent anti-tumor activity and limited toxicity induction. PLoS One. 2010;5(8):e12031. doi: 10.1371/journal.pone.0012031. - DOI - PMC - PubMed
    1. Horikawa N, et al. Expression of vascular endothelial growth factor in ovarian cancer inhibits tumor immunity through the accumulation of myeloid-derived suppressor cells. Clin Cancer Res. 2017;23(2):587–599. doi: 10.1158/1078-0432.CCR-16-0387. - DOI - PubMed
    1. Fukumura D, et al. Enhancing cancer immunotherapy using antiangiogenics: opportunities and challenges. Nat Rev Clin Oncol. 2018;15(5):325–340. doi: 10.1038/nrclinonc.2018.29. - DOI - PMC - PubMed
    1. Welti J, et al. Recent molecular discoveries in angiogenesis and antiangiogenic therapies in cancer. J Clin Invest. 2013;123(8):3190–3200. doi: 10.1172/JCI70212. - DOI - PMC - PubMed

Publication types

MeSH terms

Substances