

Myeloid cell modulation by a GLP-1 receptor agonist regulates retinal angiogenesis in ischemic retinopathy
- PMID: 34673570
- PMCID: PMC8675187
- DOI: 10.1172/jci.insight.93382
Myeloid cell modulation by a GLP-1 receptor agonist regulates retinal angiogenesis in ischemic retinopathy
Abstract
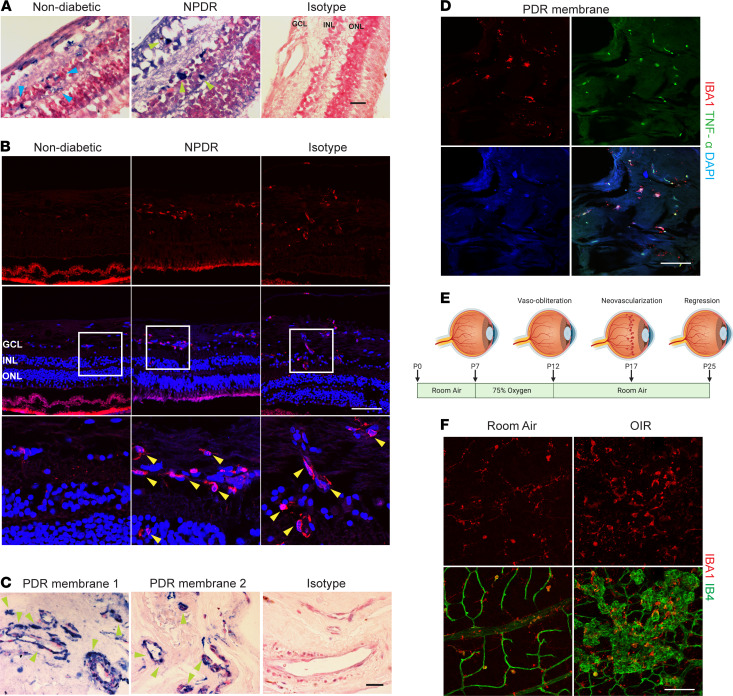
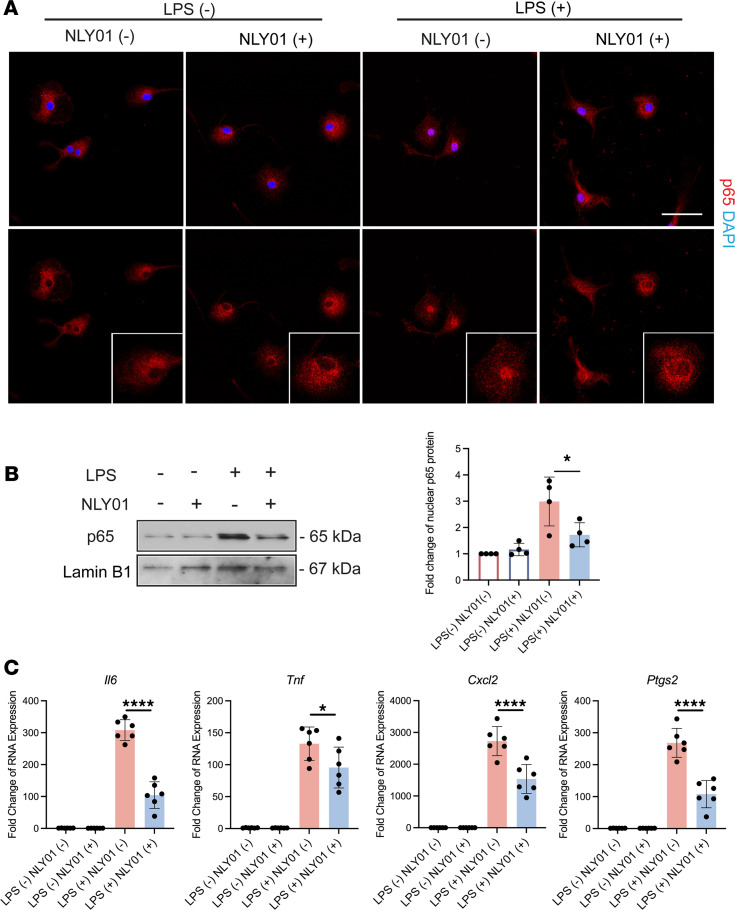
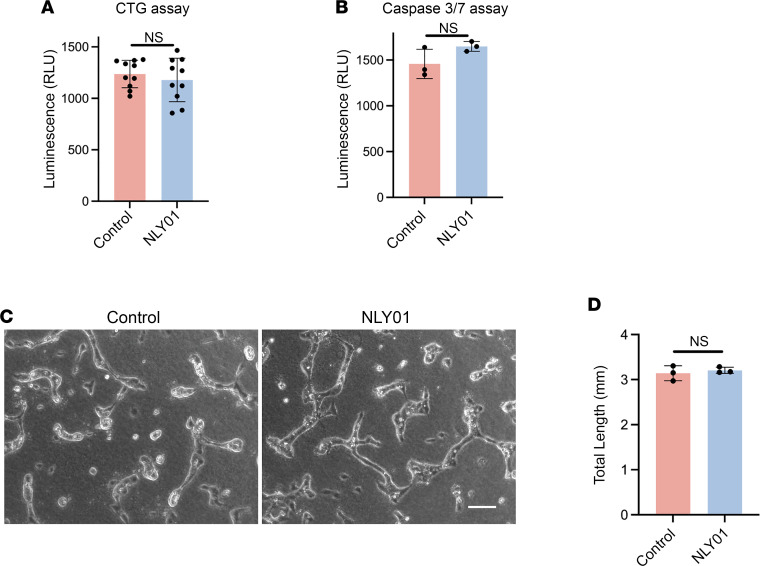
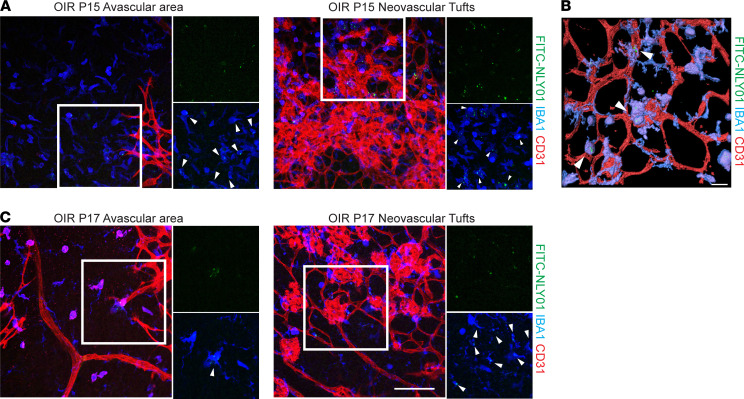
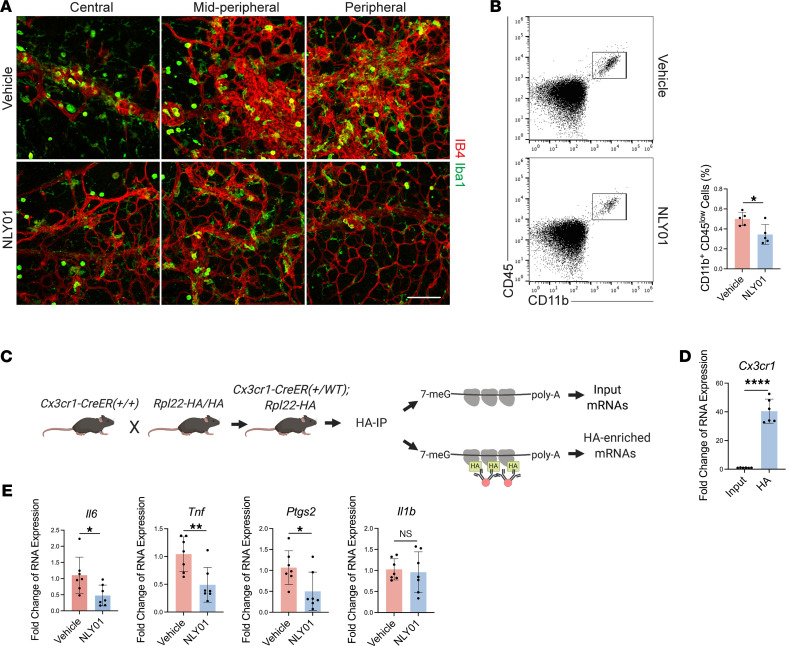
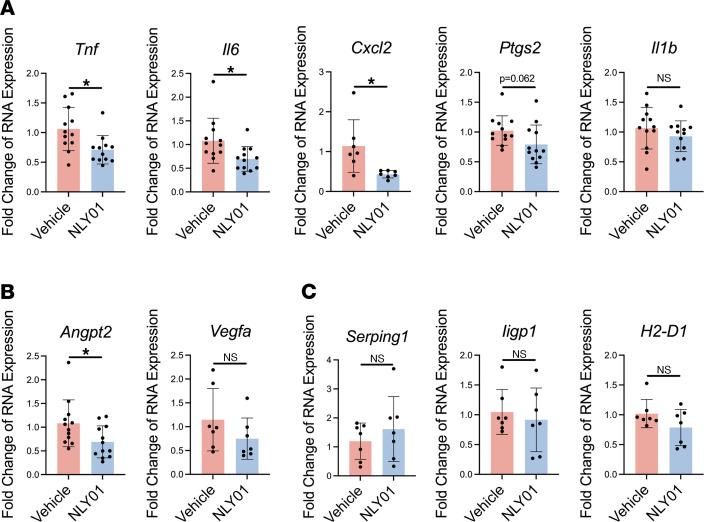
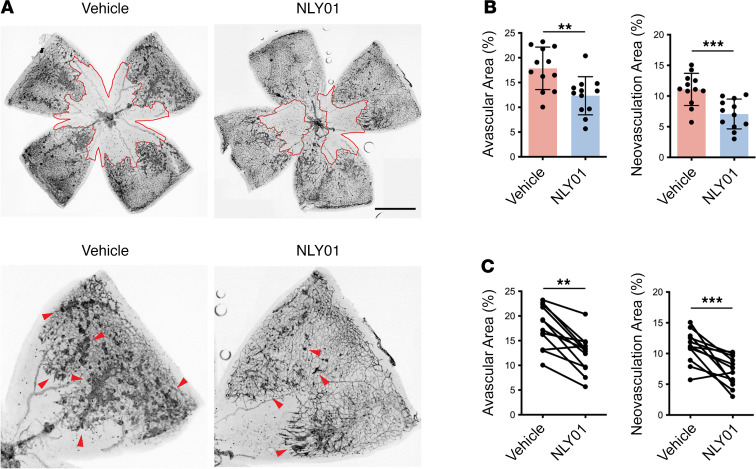
Ischemic retinopathies including diabetic retinopathy are major causes of blindness. Although neurons and Müller glia are recognized as important regulators of reparative and pathologic angiogenesis, the role of mononuclear phagocytes (MPs) - particularly microglia, the resident retinal immune cells - is unclear. Here, we found MP activation in human diabetic retinopathy, especially in neovessels from human neovascular membranes in proliferative retinopathy, including TNF-α expression. There was similar activation in the mouse oxygen-induced retinopathy (OIR) model of ischemia-induced neovascularization. Glucagon-like peptide-1 receptor (GLP-1R) agonists are in clinical use for glycemic control in diabetes and are also known to modulate microglia. Herein, we investigated the effect of a long-acting GLP-1R agonist, NLY01. Following intravitreal administration, NLY01 selectively localized to MPs in retina with OIR. NLY01 modulated MPs but not retinal endothelial cell viability, apoptosis, and tube formation in vitro. In OIR, NLY01 treatment inhibited MP infiltration and activation, including MP expression of cytokines in vivo. NLY01 significantly suppressed global induction of retinal inflammatory cytokines, promoted reparative angiogenesis, and suppressed pathologic retinal neovascularization. Collectively, these findings indicate the important role of mononuclear phagocytes in regulation of retinal vascularization in ischemia and suggest modulation of MPs as a potentially new treatment strategy for ischemic retinopathies.
Keywords: Ophthalmology; Retinopathy.
Conflict of interest statement
Figures
Similar articles
-
Suppression of inner blood-retinal barrier breakdown and pathogenic Müller glia activation in ischemia retinopathy by myeloid cell depletion.J Neuroinflammation. 2024 Aug 24;21(1):210. doi: 10.1186/s12974-024-03190-9. J Neuroinflammation. 2024. PMID: 39182142 Free PMC article.
-
Anti-angiogenic effects of the DPP-4 inhibitor linagliptin via inhibition of VEGFR signalling in the mouse model of oxygen-induced retinopathy.Diabetologia. 2018 Nov;61(11):2412-2421. doi: 10.1007/s00125-018-4701-4. Epub 2018 Aug 10. Diabetologia. 2018. PMID: 30097694
-
Modulation of cGAS-STING signaling by PPARα in a mouse model of ischemia-induced retinopathy.Proc Natl Acad Sci U S A. 2022 Nov 29;119(48):e2208934119. doi: 10.1073/pnas.2208934119. Epub 2022 Nov 21. Proc Natl Acad Sci U S A. 2022. PMID: 36409895 Free PMC article.
-
Harnessing retinal phagocytes to combat pathological neovascularization in ischemic retinopathies?Pflugers Arch. 2022 Jun;474(6):575-590. doi: 10.1007/s00424-022-02695-7. Epub 2022 May 7. Pflugers Arch. 2022. PMID: 35524802 Free PMC article. Review.
-
[Pathological role of apelin in angiogenic eye disease].Yakugaku Zasshi. 2011;131(8):1201-6. doi: 10.1248/yakushi.131.1201. Yakugaku Zasshi. 2011. PMID: 21804324 Review. Japanese.
Cited by
-
Anti-Inflammatory Effects of GLP-1R Activation in the Retina.Int J Mol Sci. 2022 Oct 17;23(20):12428. doi: 10.3390/ijms232012428. Int J Mol Sci. 2022. PMID: 36293281 Free PMC article. Review.
-
Diabetic retinopathy: Involved cells, biomarkers, and treatments.Front Pharmacol. 2022 Aug 9;13:953691. doi: 10.3389/fphar.2022.953691. eCollection 2022. Front Pharmacol. 2022. PMID: 36016568 Free PMC article. Review.
-
PERK Inhibition Suppresses Neovascularization and Protects Neurons During Ischemia-Induced Retinopathy.Invest Ophthalmol Vis Sci. 2023 Aug 1;64(11):17. doi: 10.1167/iovs.64.11.17. Invest Ophthalmol Vis Sci. 2023. PMID: 37566408 Free PMC article.
-
Glucagon-Like Peptide 1 Receptor Agonist Stimulation Inhibits Laser-Induced Choroidal Neovascularization by Suppressing Intraocular Inflammation.Invest Ophthalmol Vis Sci. 2025 May 1;66(5):15. doi: 10.1167/iovs.66.5.15. Invest Ophthalmol Vis Sci. 2025. PMID: 40332908 Free PMC article.
-
Suppression of inner blood-retinal barrier breakdown and pathogenic Müller glia activation in ischemia retinopathy by myeloid cell depletion.J Neuroinflammation. 2024 Aug 24;21(1):210. doi: 10.1186/s12974-024-03190-9. J Neuroinflammation. 2024. PMID: 39182142 Free PMC article.
References
Publication types
MeSH terms
Substances
Grants and funding
LinkOut - more resources
Full Text Sources
Medical
Molecular Biology Databases
