. 2021 Dec 15;131(24):e151976.
doi: 10.1172/JCI151976.

Melanocortin 4 receptor stimulation prevents antidepressant-associated weight gain in mice caused by long-term fluoxetine exposure

Affiliations

Melanocortin 4 receptor stimulation prevents antidepressant-associated weight gain in mice caused by long-term fluoxetine exposure

María José Ortuño et al. J Clin Invest. .

Abstract

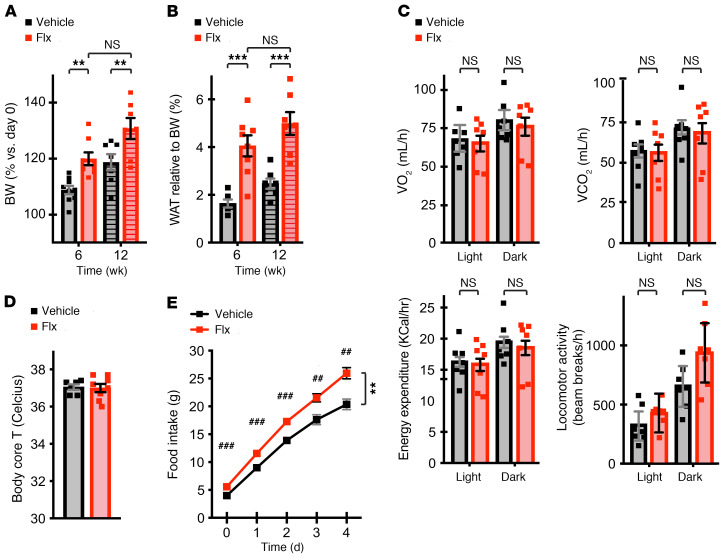
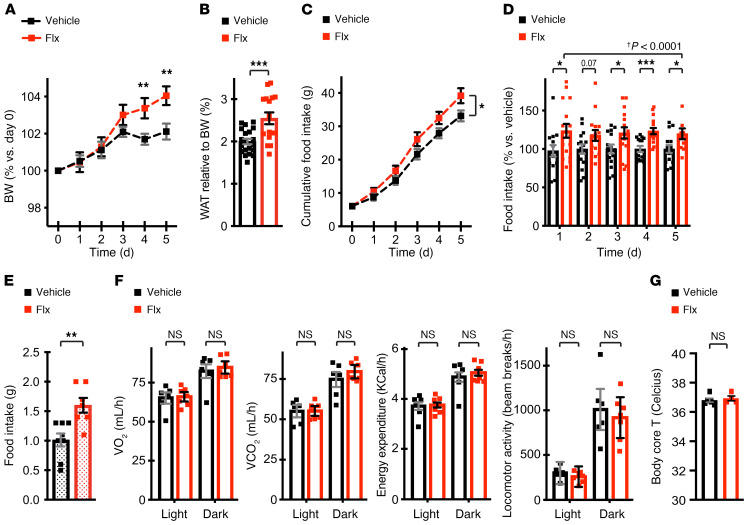
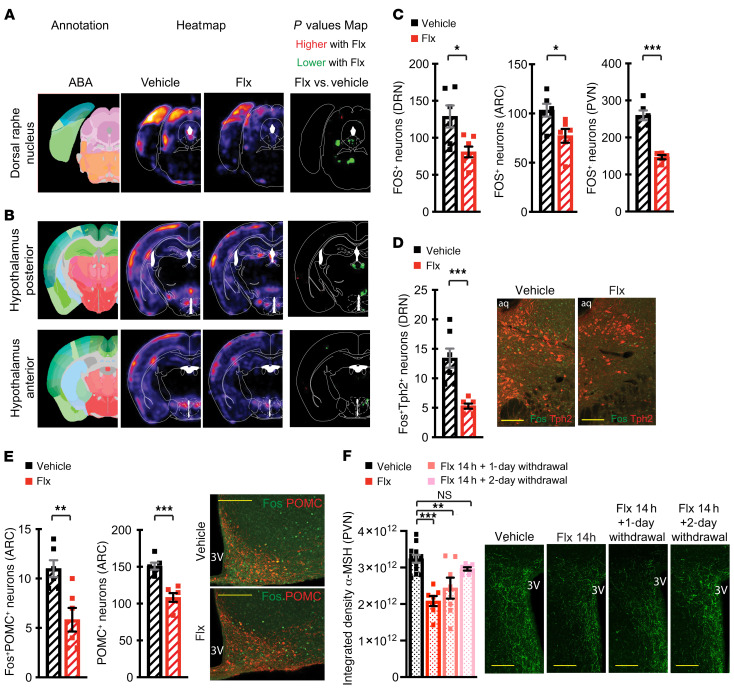
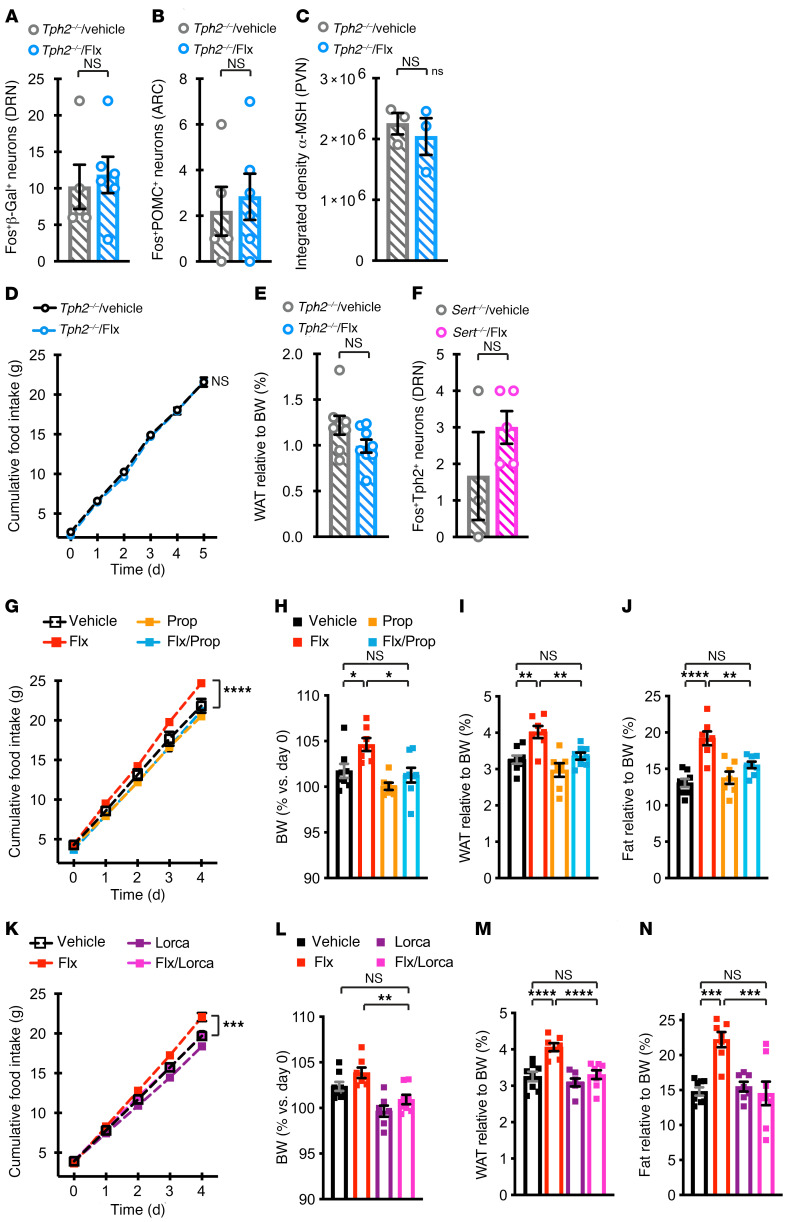
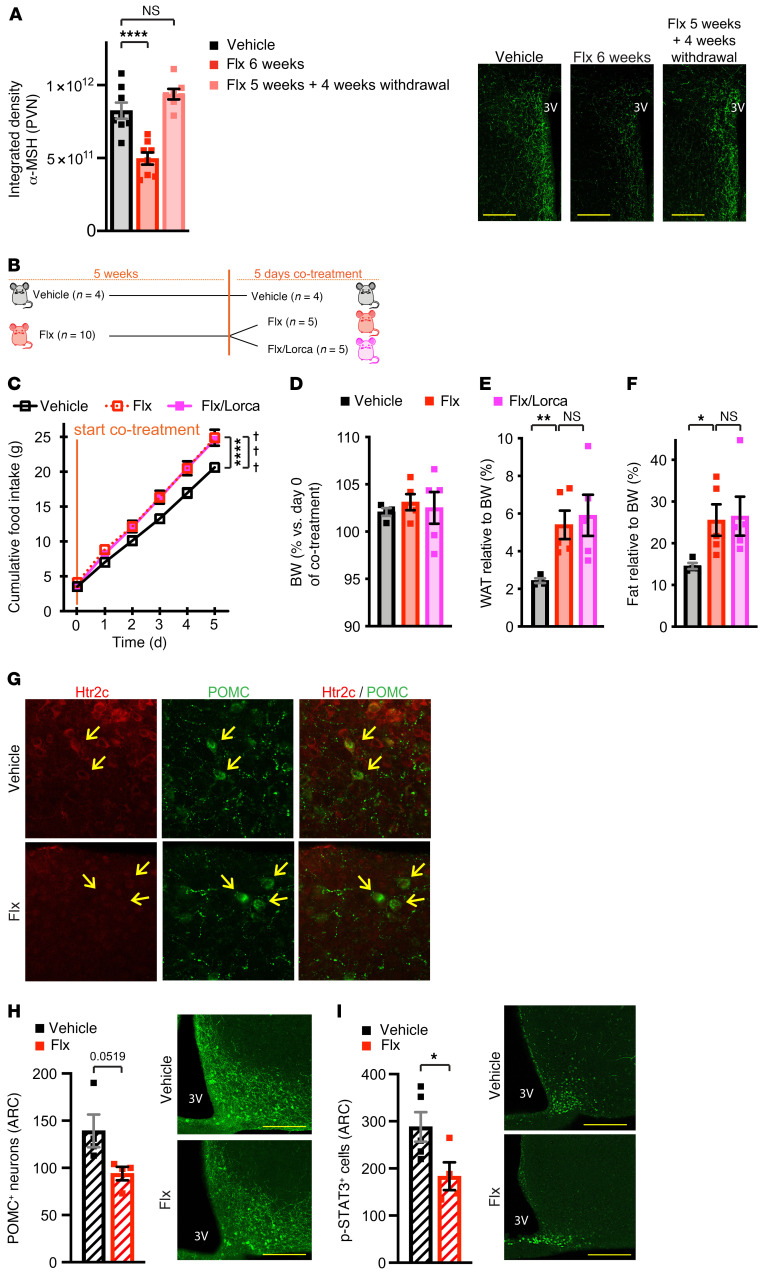
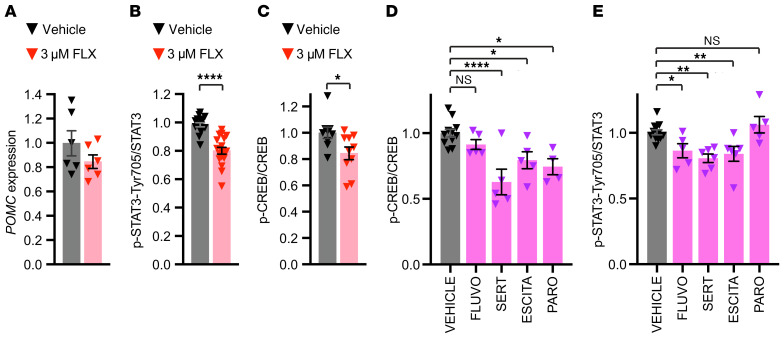
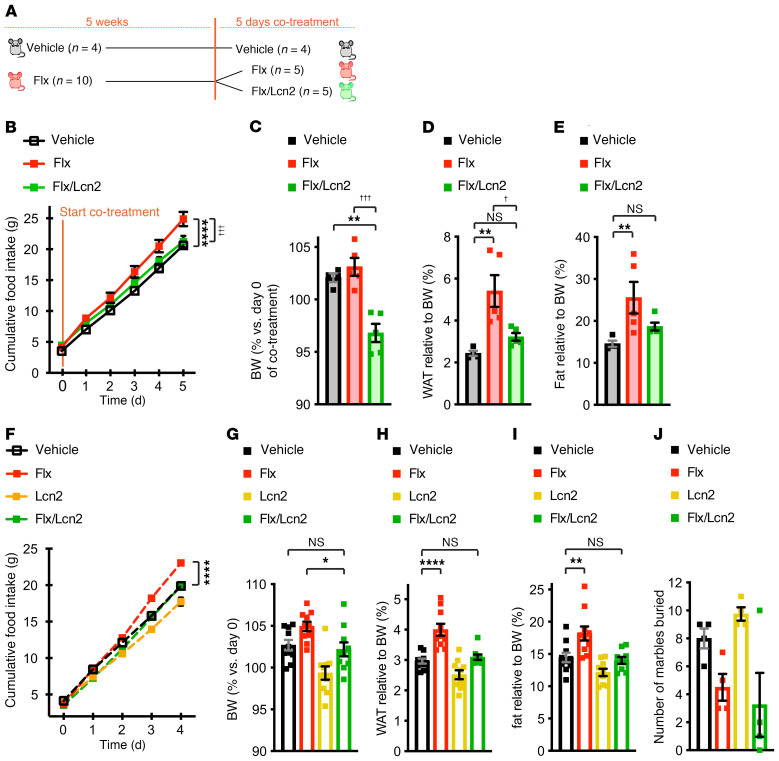
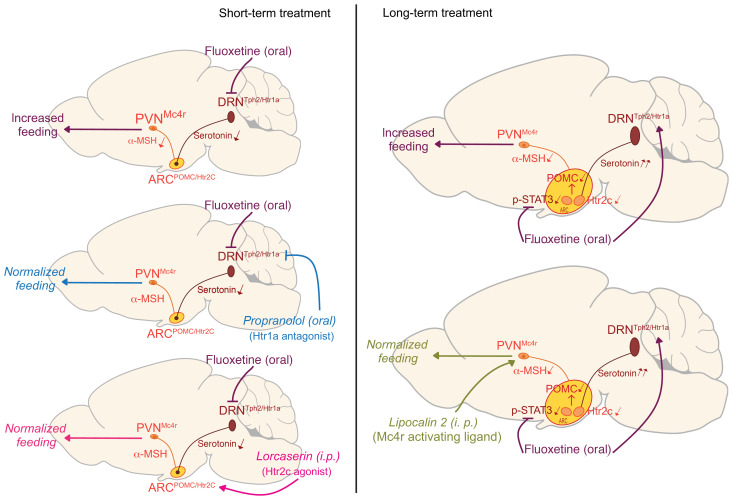
Contrasting with the predicted anorexigenic effect of increasing brain serotonin signaling, long-term use of selective serotonin reuptake inhibitor (SSRI) antidepressants correlates with body weight (BW) gain. This adverse outcome increases the risk of transitioning to obesity and interferes with treatment compliance. Here, we show that orally administered fluoxetine (Flx), a widely prescribed SSRI, increased BW by enhancing food intake in healthy mice at 2 different time points and through 2 distinct mechanisms. Within hours, Flx decreased the activity of a subset of brainstem serotonergic neurons by triggering autoinhibitory signaling through 5-hydroxytryptamine receptor 1a (Htr1a). Following a longer treatment period, Flx blunted 5-hydroxytryptamine receptor 2c (Htr2c) expression and signaling, decreased the phosphorylation of cAMP response element-binding protein (CREB) and STAT3, and dampened the production of pro-opiomelanocortin (POMC, the precursor of α-melanocyte stimulating hormone [α-MSH]) in hypothalamic neurons, thereby increasing food intake. Accordingly, exogenous stimulation of the melanocortin 4 receptor (Mc4r) by cotreating mice with Flx and lipocalin 2, an anorexigenic hormone signaling through this receptor, normalized feeding and BW. Flx and other SSRIs also inhibited CREB and STAT3 phosphorylation in a human neuronal cell line, suggesting that these noncanonical effects could also occur in individuals treated long term with SSRIs. By defining the molecular basis of long-term SSRI-associated weight gain, we propose a therapeutic strategy to counter this effect.

Keywords: Depression; Metabolism; Pharmacology; Psychiatric diseases; Therapeutics.


Conflict of interest statement

Conflict of interest: The authors have declared that no conflict of interest exists.

Figures

Figure 1
Figure 1. Long-term oral treatment with Flx increases BW and adiposity by specifically enhancing food intake.
(A) Percentage of BW relative to day 0 in WT female mice treated with vehicle or Flx for 6 weeks (plain gray bars, n = 8–9 mice/group, representative of 6 independent experiments) or 12 weeks (hatched bars, n = 7 mice/group). (B) Percentage of WAT content relative to BW at the end of the 6-week (n = 6–8 mice/group) and 12-week (n = 7 mice/group) treatment periods. (C and E) WT females treated with vehicle or Flx for 6 weeks. (C) Energy expenditure measured by VO2, VCO2, heat production, and locomotor activity recorded over the last 3 days of treatment (n = 7 mice/group). (D) Core body temperature (T) at the end of the treatment period (n = 6–8 mice/group). (E) Cumulative food intake measured over the last 5 days of treatment (n = 6–7 mice/group; data are representative of 2 independent experiments). Values represent the mean ± SEM. **P ≤ 0.01 and ***P ≤ 0.001, by 2-way ANOVA followed by Šidák’s test (A and B, locomotion activity in C), ANCOVA (C, except for locomotor activity), and paired Student’s t test (E) versus vehicle. ##P ≤ 0.01 and ###P ≤ 0.001, by Student’s t test for Flx versus vehicle, analyzed for each time point.
Figure 2
Figure 2. Short-term treatment with Flx induces a rapid increase in feeding.
(AD) WT female mice were treated with vehicle or Flx for 5 days. (A) Percentage of BW relative to BW on day 0 of treatment (n = 16–17 mice/group). (B) Percentage of WAT content relative to BW at the end of the treatment period (n = 16–20 mice/group). (C) Cumulative food intake. (D) Daily percentage of food intake relative to that by vehicle-treated mice (n = 14–16 mice/group). (E) Food intake by WT female mice treated with vehicle or Flx for 14 hours during the active (dark) phase of the day (n = 7–8 mice/group). (F and G) WT female mice were treated with vehicle or Flx for 5 days. (F) Energy expenditure was measured by VO2, VCO2, heat production, and locomotor activity averaged over the last 4 days of the treatment (n = 6–7 females/group). (G) Core body temperature at the end of the treatment period (n = 4–6 mice/group). Values represent the mean ± SEM. *P ≤ 0.05, **P ≤ 0.01, and ***P ≤ 0.001, by unpaired Student’s t test versus vehicle (AD), ANCOVA (F, except for locomotor activity), or 2-way ANOVA followed by Šidák’s test (locomotor activity in F). P < 0.001, by paired Student’s t test for Flx compared with vehicle (E).
Figure 3
Figure 3. Acute treatment with Flx decreases the activity of DRN neurons and hypothalamic α-MSH levels.
(A and B) iDISCO+ whole-brain imaging and ClearMap analysis of c-Fos from compressed coronal views of the DRN (A) and hypothalamus (B) of WT female mice treated with vehicle (second column) or Flx (third column) for 2 hours (n = 5–6 mice/group). First column: ABA annotated image. Second and third columns: heatmaps. Fourth column: voxel-based statistical analysis. Regions with significantly different numbers of Fos+ cells in the Flx versus vehicle treatment conditions are highlighted. (C) IHF validation of iDISCO+ results for brain slices from WT female mice treated with vehicle or Flx for 2 hours. Graphs show the quantification of Fos+ neurons in the DRN, ARC, and PVN (n = 5–7 mice/group). (D and E) Representative images and quantification following double-IHF as indicated, in brain slices from WT female mice treated with Flx or vehicle for 2 hours (D, n = 7 mice/group; E, n = 6 mice/group). (F) Representative IHF images and levels of α-MSH in PVN neurons quantified as integrated density in brain slices from WT female mice treated with vehicle or Flx for 14 hours. Flx was then withdrawn in some of the groups as indicated (n = 12 vehicle, n = 7 mice/other groups). aq, aqueduct; 3V, third ventricle. Scale bars: 200 μm. Values represent the mean ± SEM. *P ≤ 0.05, **P ≤ 0.01, ***P ≤ 0.001, and ****P ≤ 0.0001, by unpaired Student’s t test versus vehicle (CE) or 1-way ANOVA followed by Dunnett’s test (F).
Figure 4
Figure 4. Short-term Flx-induced hyperphagia is serotonin dependent and can be countered by pharmacological inhibition of Htr1a or activation of Htr2c signaling.
(A and B) IHF in brain slices from Tph2–/– female mice treated with Flx or vehicle for 2 hours. (A) Quantification of Fos+β-gal+ neurons in the DRN or (B) Fos+POMC+ neurons in the ARC (n = 5–6 mice/group). (C) IHF in brain slices from Tph2–/– female mice treated with Flx or vehicle for 14 hours. Graph shows the levels of α-MSH measured as integrated density (n = 3 mice/group). (D and E) Tph2–/– females were treated with Flx or vehicle for 5 days (n = 8 mice/group). (D) Cumulative food intake. (E) Percentage of WAT content relative to BW. (F) Quantification of Fos+Tph2+ neurons in the DRN by IHF in brain slices from Sert–/– female mice treated with Flx or vehicle for 2 hours (n = 3–5 mice/group). (GJ) WT females were treated for 4 days with vehicle, Flx, Prop, or both drugs (n = 7–8 mice/group). (G) Cumulative food intake. (H) Percentage of BW relative to day 0 of treatment. (I) Percentage of WAT content relative to BW. (J) Fat content measured by EchoMRI relative to BW. (KN) WT female mice were treated for 4 days with vehicle, Flx, Lorca, or both drugs (n = 7–8 mice/group). (K) Cumulative food intake. (L) Percentage of BW relative to day 0 of treatment. (M) Percentage of WAT content relative to BW. (N) Fat content measured by EchoMRI relative to BW. Values represent the mean ± SEM. *P ≤ 0.05, **P ≤ 0.01, ***P ≤ 0.001, and ****P ≤ 0.0001, by unpaired (AC, E, and F) or paired (D) Student’s t test versus vehicle, or by 2-way ANOVA (G and K) or 1-way ANOVA (HJ and LN) followed by Tukey’s test.
Figure 5
Figure 5. Long-term treatment with Flx impairs Htr2c signaling, STAT3 phosphorylation, and α-MSH production in hypothalamic neurons.
(A) Representative images of IHF and levels of α-MSH quantified as integrated density in brain slices from WT female mice treated with Flx or vehicle for 6 weeks. Flx was then withdrawn in some of the groups as indicated (n = 7–8 mice/group). (BF) WT female mice were treated for 5 weeks with vehicle or Flx and were then treated with vehicle or Flx alone or Flx and Lorca for 5 additional days (n = 4–5 mice/group). (B) Schema of experimental design. (C) Cumulative food intake. (D) Percentage of BW relative to day 0 of cotreatment. (E) Percentage of WAT content relative to BW. (F) Fat content measured by EchoMRI relative to BW. (GI) WT females were treated with vehicle or Flx for 6 weeks (n = 4 mice/group). (G) Representative IHF images of Htr2c expression in POMC+ ARC neurons. Arrows point to POMC+ cells. Representative images and quantification of (H) POMC+ and (I) p-STAT3+ neurons in arcuate nuclei. Scale bars: 200 μm. Values represent the mean ± SEM. *P ≤ 0.05 and **P ≤ 0.01, and ****P ≤ 0.0001, for vehicle versus Flx treatment; †††P ≤ 0.001, for vehicle versus Flx plus Lorca treatment. Significance was determined by 1-way (A, E, and F) or 2-way (C) ANOVA followed by Tukey’s test, or by unpaired Student’s t test (H and I).
Figure 6
Figure 6. Flx and other SSRIs interfere with STAT3 and CREB phosphorylation in human neuronal cells.
SY5Y neuron-like cells were differentiated for 5 days and treated with vehicle, Flx, or other SSRIs as indicated. (A) Gene expression analysis of POMC by qPCR after 4 hours of treatment. (B and E) Analysis of p-STAT3 and (C and D) p-CREB by Western blotting after a 2-hour treatment with Flx or vehicle. FLUVO, fluvoxamine; SERT, sertraline; ESCITA, escitalopram; PARO, paroxetine. Values represent the mean ± SEM. *P ≤ 0.05, **P ≤ 0.01, and ****P ≤ 0.0001, by Student’s t test versus vehicle (B and C) or 1-way ANOVA followed by Dunnett’s test (D and E).
Figure 7
Figure 7. Cotreatment with Lcn2 can block the long-term effects of Flx on feeding and BW.
(AE) WT female mice were treated for 5 weeks with vehicle or Flx and then with vehicle, Flx, or Flx plus Lcn2 for 5 additional days (n = 4–5 mice/group). (A) Schema of the experimental design. (B) Cumulative food intake. (C) Percentage of BW on the last day of cotreatment relative BW on day 0 of cotreatment. (D) Percentage of WAT content relative to BW. (E) Fat content relative to BW. (FJ) WT female mice were treated for 4 days with vehicle, Flx, Lcn2, or both drugs as indicated (n = 10 mice/group). (F) Cumulative food intake. (G) Percentage of BW on the last day of treatment relative to BW on day 0. (H) Percentage of WAT content relative to BW. (I) Fat content relative to BW. (J) Marble-burying test. Values represent the mean ± SEM. *P ≤ 0.05, **P ≤ 0.01, ***P ≤ 0.001, and ****P ≤ 0.0001, for vehicle versus Flx; P ≤ 0.05 and †††P ≤ 0.001, for Flx compared with Flx+Lcn2+. Two-way ANOVA (B and F) or 1-way ANOVA (CE and GJ) followed by Tukey’s test.
Figure 8
Figure 8. Mechanisms of Flx-induced short-term and long-term hyperphagia and weight gain.
In the short term (left), within hours of oral treatment with Flx, Tph2+Htr1a+ DRN neurons are inhibited, leading to a decrease in the serotonin-dependent activation of POMC+Htr2c+ ARC (ARCPOMC/Htr2c) and Mc4r+ PVN (PVNMc4r) neurons, which causes an increase in food intake (left, top). Blocking the Htr1a-dependent inhibition of Tph2+Htr1a+DRN (DRNTph2/Htr1a) neurons using Prop (left, middle) or activating POMC+Htr2c+ ARC (ARCPOMC/Htr2c) neurons using Lorca (left, bottom) can therefore normalize feeding in this setting. Upon long-term treatment (right), however, Flx decreases Htr2c expression and signaling and inhibits STAT3 phosphorylation in ARC neurons, resulting in reduced α-MSH production (right, top). This noncanonical and multifactorial activity of Flx explains the paradoxical hyperphagia and weight gain associated with its long-term use as well as the failure of Lorca to counter this effect. In contrast, cotreatment with Lcn2, a Mc4r ligand, can normalize feeding and prevent weight gain (right, bottom).

Similar articles

Cited by

References

    1. Kane SP. https://clincalc.com/DrugStats/Drugs/Fluoxetine ClinCalc DrugStats Database, Version 21.1; 2020.
    1. Wong DT, et al. Prozac (fluoxetine, Lilly 110140), the first selective serotonin uptake inhibitor and an antidepressant drug: twenty years since its first publication. Life Sci. 1995;57(5):411–441. doi: 10.1016/0024-3205(95)00209-O. - DOI - PubMed
    1. Fox M, et al. A pharmacological analysis of mice with a targeted disruption of the serotonin transporter. Psychopharmacology (Berl) 2007;195(2):147–166. doi: 10.1007/s00213-007-0910-0. - DOI - PubMed
    1. Heisler LK, et al. Serotonin reciprocally regulates melanocortin neurons to modulate food intake. Neuron. 2006;51(2):239–249. doi: 10.1016/j.neuron.2006.06.004. - DOI - PubMed
    1. Xu Y, et al. 5-HT2CRs expressed by pro-opiomelanocortin neurons regulate energy homeostasis. Neuron. 2008;60(4):582–589. doi: 10.1016/j.neuron.2008.09.033. - DOI - PMC - PubMed

Publication types

MeSH terms